 Duplex
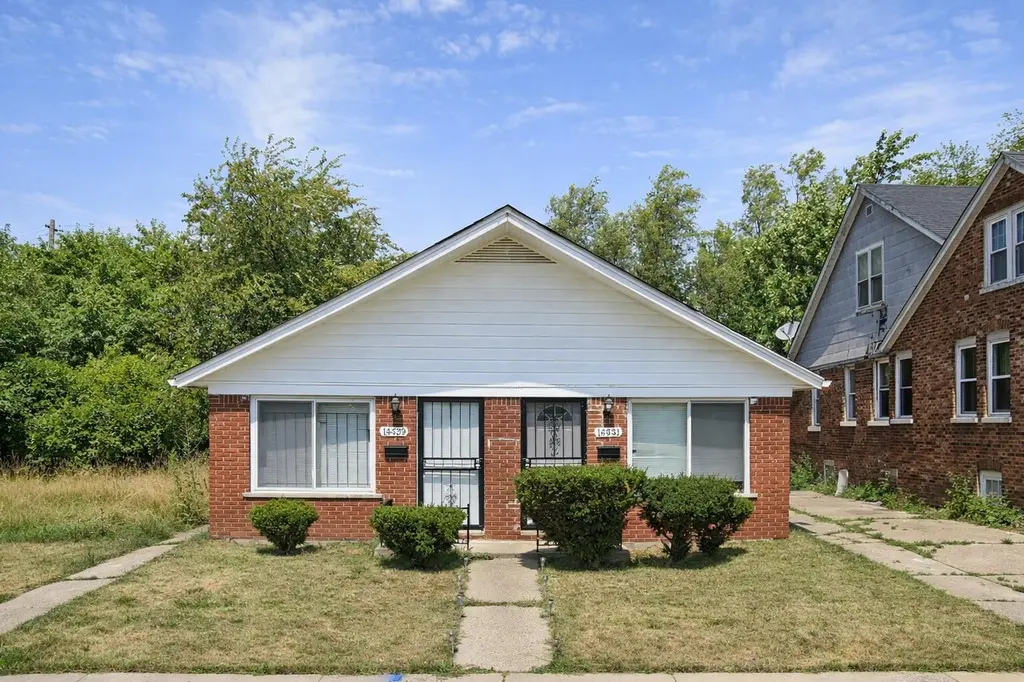
14439 Kent St · Detroit, MI
Flood risk 1/10 · Minimal
- FEMA flood zone
- X (unshaded)
- Chance of flooding over 30 yrs
- 0.0%
- Est. flood insurance / yr
- $507 – $1,088
Fire risk 1/10 · Minimal
- Est. fire insurance / yr
- $784 – $1,456
Heat risk 3/10 · Minor
- Hot days now (above 95°F)
- 7 days/yr
- Hot days in 30 yrs
- 15 days/yr
Wind risk 2/10 · Minimal
- Chance of severe wind over 30 yrs
- —
Air-quality risk 3/10 · Minor
- Unhealthy air days now
- 2 days/yr
- Unhealthy air days in 30 yrs
- 5 days/yr
Risk factors via First Street. Map © Google.
Why this score? — see what drove the B- grade
The composite is a weighted blend of 9 inputs, each scored 0–100. Each bar is that input's sub-score; the figure is the points it added to the 100-point composite (weight × sub-score).
- Cash flow +30.0/30.0
- 1% rule +10.0/10.0
- DSCR +10.0/10.0
- ARV discount +7.5/15.0
- Livability +3.7/5.0
- Rent growth +2.5/5.0
- Condition / age +2.2/5.0
- Schools +1.3/10.0
- Appreciation +0.0/10.0
$115,000
🖨 Deal sheet 📄 Offer letter ✓ Due diligence
Multi-family units
County records classify this as Multi-Family (2-4 Unit). Listing-text estimate: 2 units. confirmed
Listing remarks MLS
Charming side-by-side duplex featuring two 1-bedroom, 1-bath units, each with its own private entrance. One unit is currently occupied, providing immediate rental income, while the other unit is vacant, creating a great house-hacking opportunity for an owner-occupant or the ability to lease at market rent. Both units offer functional layouts with comfortable living spaces and ample natural light. Ideal for investors or buyers looking to live in one unit while offsetting housing costs with rental income. Conveniently located near major roadways, shopping, dining, and neighborhood amenities. A versatile, income-producing property with strong long-term potential.
Key facts
- Natural light
- Private entrance
- Rental income
Tags
Neighborhood map
What this means for you Summary
Snapshot
- This is a 2 × 1-bed/1.0-bath units multifamily listed at $115k. Condition is rated fair.
Deal economics
- At list price, monthly cash flow is $782 ($9k/yr) — positive. Per door: $391/mo.
- The deal already cash-flows at list — no discount required.
- Meets the 1% rule at list price ($2k rent vs $115k).
- Recommended offer: $105k (9.0% below list) — sets the bar for market timing.
- Cap rate 14.5% vs local median 10.2% in Detroit — top-decile yield for the area; either an underpriced asset or a hidden risk that comps aren't pricing in. Stress-test before assuming the spread holds.
Location & tenants
- Location reads 73/100 on livability (#218 in MI) — a middle-class / working-renter tenant base. Strengths: amenities A+, commute A+, cost of living A+; Watch: schools F, crime F, employment F.
- Detroit Public Schools Community District (urban): math 10% / reading 24% proficiency, ranked #499 of 540 in MI (top 92%) — low school quality limits family demand, transient renter base, plan for 1-2y turnover; 90% free/reduced lunch — lower-income household profile, screen leases tightly.
- Market conditions: 190 active listings in the ZIP; 40 comparable units currently listed for rent nearby; rentals at typical pace (median 18d on market — plan ~3-4 weeks tenant-placement turnaround); lower-income renter base — watch delinquency; 2,639 units permitted in Wayne County in 2024 (1,216 in 5+ unit buildings).
- At $1,996/mo this rent would consume 70% of the median local household income ($34k/yr) (locally 1202% of renters already pay >50% of income on rent) — very limited rent-growth headroom before tenants either downsize or default.
Forward outlook
- Local home prices are declining (-3.0%/yr); year-one equity from $795 of loan paydown is wiped out by about $3k of value loss. Plan a longer hold.
- Wayne County population projected at -17% by 2050 — secular population decline; favor cash flow + early exit over multi-decade hold.
- At projected returns (-3.0% appreciation + 3.0% rent growth), your $32k cash investment doubles in ~5 years — after that, you're playing with house money.
Negotiation context
- It's been on market 91 days — a 9% lower offer ($105k) is reasonable based on typical stale-listing flexibility.
- 7 sale attempts since 2y ago with the ask held roughly flat each time — persistent listings suggest the price (not the market) is what's stuck; bring a comps-based counter.
Questions for the listing agent
- It's been on market 91 days. Have you received any prior offers? Is the seller open to a 9% concession, seller financing, or rate buy-down credit?
- Can we see the unit-by-unit rent roll, current vacancy, and any below-market leases? What's the average tenancy length?
- What capital expenditures (roof, boiler, parking lot, exteriors) have been made in the last 5 years, and what's planned in the next 2?
- Have any recent inspections been done? Can we get a copy of the seller's disclosures and any deferred-maintenance estimates?
- Built in 1965 — when were the roof, HVAC, electrical panel, plumbing, and water heater last replaced?
- Why hasn't it sold? Are there any deal-killer items the seller is aware of (foundation, flood, title, zoning, code violations)?
- Is there a deadline driving the sale (1031 exchange, divorce, estate, relocation)? That informs how much negotiation room exists.
- Schools are F-rated, which usually means shorter tenancies and higher turnover. Who's the typical renter profile here, and what's been the actual vacancy rate?
- Crime grade is F in this area — have there been break-ins, vandalism, or insurance claims at this property in the last 3 years? What carrier currently insures it and at what premium?
- What's the average days-on-market for RENTAL listings here right now (not sales)? A rising rental-DOM trend means longer vacancies and softer asking-rent achievability than the comps imply.
- What's the recent tenant-quality profile in this submarket — average credit score on applications, eviction rate, late-payment / NSF rate, and stable-employment percentage? A property-management company in the area should have these aggregated.
- How much new apartment / multifamily construction is in the pipeline within 1–3 miles? Heavy new supply (>2% of stock underway) typically softens rents 12–24 months out; light construction supports rent growth.
Investment metrics
- 1% rule
- 1.74% ✓
- Cap rate
- 14.45%
- Cash-on-cash
- 29.15%
- DSCR
- 2.30
- GRM
- 4.8
CMA / ARV
- ARV (median comp)
- $74,263
- List price
- $115,000
- Delta
- 54.86%
- Verdict
- OVERPRICED
- Comps
- 20 within 1.0 mi
Show comp detail 12 sales within ~0.75 mi
| Address | Dist | Beds/Ba | Sqft | Sold | Price | $/sf | Match |
|---|---|---|---|---|---|---|---|
| 13364 Corbett St | 0.34mi | 4/2.5 | 1,706 | 1mo | $70,000 | $41 | 65 |
| 5960 Chalmers St | 0.29mi | 4/2.0 | — | 5mo | $110,000 | — | 62 |
| 9516 Wayburn St | 0.37mi | 4/2.0 | 1,548 | 3mo | $95,000 | $61 | 60 |
| 5975 Lakeview St | 0.43mi | 4/2.0 | 2,037 | 8mo | $51,500 | $25 | 53 |
| 5577 Chalmers St | 0.53mi | 4/2.0 | 1,750 | 3mo | $200,000 | $114 | 52 |
| 5258 Alter Rd | 0.69mi | 4/2.0 | 1,788 | 1mo | $58,000 | $32 | 46 |
| 5569 Drexel St | 0.69mi | 4/2.0 | 2,986 | 2mo | $171,000 | $57 | 46 |
| 5500 Chalmers St | 0.59mi | 4/2.0 | 1,951 | 9mo | $113,000 | $58 | 45 |
| 5919 Balfour Rd | 0.69mi | 4/2.0 | — | 4mo | $130,000 | — | 44 |
| 5527 Nottingham Rd | 0.75mi | 4/2.0 | 2,016 | 4mo | $128,000 | $63 | 42 |
| 5511 Drexel St | 0.73mi | 4/2.0 | 1,985 | 8mo | $30,000 | $15 | 39 |
| 5261 Lakeview St | 0.74mi | 3/2.0 (-1) | 1,383 | 9mo | $124,122 | $90 | 32 |
Match score weights: distance 35% · size 25% · config 20% · recency 20%. Top-matched comps best support the ARV.
Projected returns pro-forma
-3.0% appreciation · 3.0% rent growth · sell at horizon
- IRR
- 23.6%
- Equity multiple
- 1.97×
- Total profit
- $31,208
- Equity at exit
- $17,147
- IRR
- 31.5%
- Equity multiple
- 3.84×
- Total profit
- $91,439
- Equity at exit
- $9,943
Cash invested: $32,200 (down + closing). Projections, not guarantees.
Landlord ↔ Tenant lean methodology
- Overall (STATE)
- 62 Landlord-Friendly
- State Michigan
- 62 Landlord-Friendly · EVEN
- County
- — inherits STATE
- City
- — inherits STATE
ZIP-level market 48213
- Active inventory
- 190
- Price-to-rent
- 9.6×
Monthly cashflow live
- Estimated rent
- $1,996 high interval (Pro) →
- Mortgage (P&I)
- −$603
- Tax est. 1.5%
- −$144 /mo · $1,725/yr
- Insurance
- −$48
- HOA
- −$0
- Vacancy / Maint / Mgmt
- −$419
- Net cashflow
- $782
Break-even live
2-unit breakdown (identical units grouped — click to expand)
| Units | Beds | Baths | Est. rent |
|---|---|---|---|
| 2× units | 1 | 1 | $1,996 |
| #1 | 1 | 1 | $998 |
| #2 | 1 | 1 | $998 |
| Total (2 units) | $1,996 | ||
UW: 25.0% down · 7.5% · 30yr · 1.5% tax · 5.0% vac · 8.0% maint · 8.0% mgmt
Financing live
Cash to close
- Down payment
- $28,750
- Closing costs
- $3,450
- Reserves months
- —
- Total cash needed
- —
Loan-product check · same deal, 3 products live
Conventional
25% down · 7.5% · 30yr
- Down + closing
- —
- Monthly P&I
- —
- Monthly cashflow
- —
- DSCR
- —
- Eligible?
- —
Personal DTI + credit; lowest rate.
DSCR
20% down · 8.5% · 30yr
- Down + closing
- —
- Monthly P&I
- —
- Monthly cashflow
- —
- DSCR
- —
- Eligible?
- —
No personal income docs; deal must DSCR.
Hard money
10% down · 12.0% · 12mo
- Down + closing
- —
- Monthly P&I
- —
- Monthly cashflow
- —
- DSCR
- —
- Eligible?
- —
Short-term bridge; refi at stabilization.
Rent comps 40 comps
| Address | Beds | Baths | Sqft | Rent | $/sqft | DOM | Units | Dist |
|---|---|---|---|---|---|---|---|---|
| 14295 Wade St Detroit, MI | 3.0 | 1.0 | — | $1,200 | — | 43d | 1 | 0.15mi |
| 13395 Maiden St Detroit, MI | 5.0 | 2.0 | 1750 | $1,600 | $0.91 | 24d | 1 | 0.30mi |
| 9168 Wayburn St Detroit, MI | 3.0 | 1.0 | 1274 | $1,300 | $1.02 | 20d | 1 | 0.31mi |
| 5966 Eastlawn St Unit NA Detroit, MI | 3.0 | 1.5 | 1366 | $1,500 | $1.10 | 24d | 1 | 0.37mi |
| 9400 Lakepointe St Detroit, MI | 3.0 | 1.0 | 1300 | $1,150 | $0.88 | 4d | 1 | 0.38mi |
| 9755 Wayburn St Detroit, MI | 3.0 | 2.0 | 1498 | $1,400 | $0.93 | 3d | 1 | 0.40mi |
| 13400 Longview St Detroit, MI | 3.0 | 1.5 | 1000 | $1,400 | $1.40 | 43d | 1 | 0.41mi |
| 13137 Elmdale St Detroit, MI | 3.0 | 1.0 | 1115 | $1,400 | $1.26 | 24d | 1 | 0.47mi |
| 5747 Lakepointe St Detroit, MI | 3.0 | 1.5 | 1316 | $1,473 | $1.12 | 43d | 1 | 0.54mi |
| 10141 Roxbury St Detroit, MI | 3.0 | 1.0 | 1115 | $1,000 | $0.90 | 43d | 1 | 0.56mi |
| 10630 Whitehill St Detroit, MI | 3.0 | 2.0 | — | $1,750 | — | 1d | 1 | 0.58mi |
| 9927 Beaconsfield St Detroit, MI | 3.0 | 1.0 | 942 | $1,375 | $1.46 | 14d | 1 | 0.58mi |
| 10724 Whitehill St Detroit, MI | 4.0 | 3.0 | — | $1,550 | — | 43d | 1 | 0.63mi |
| 10724 Whitehill St Detroit, MI | 3.0 | 3.0 | 1425 | $1,550 | $1.09 | 17d | 1 | 0.63mi |
| 9409 Balfour Rd Detroit, MI | 3.0 | 1.0 | 1195 | $1,200 | $1.00 | 43d | 1 | 0.64mi |
| 5751 Nottingham Rd Unit 5/21/26 Detroit, MI | 3.0 | 1.0 | 1100 | $1,250 | $1.14 | 14d | 1 | 0.64mi |
| 9984 Beaconsfield St Detroit, MI | 3.0 | 1.0 | 1222 | $1,575 | $1.29 | 43d | 1 | 0.65mi |
| 5791 Somerset Ave Detroit, MI | 3.0 | 2.0 | 1660 | $1,400 | $0.84 | 17d | 1 | 0.66mi |
| 5791 Somerset Ave Detroit, MI | 3.0 | 1.5 | — | $1,400 | — | 16d | 1 | 0.66mi |
| 10813 Whitehill St Detroit, MI | 3.0 | 1.0 | 1392 | $1,350 | $0.97 | 17d | 1 | 0.68mi |
| 14498 Kilbourne St Detroit, MI | 3.0 | 1.0 | — | $1,100 | — | 43d | 1 | 0.71mi |
| 13001 Promenade St Detroit, MI | 3.0 | 1.0 | — | $1,150 | — | 24d | 1 | 0.76mi |
| 15857 Evanston St Detroit, MI | 3.0 | 1.5 | 1232 | $1,250 | $1.01 | 4d | 1 | 0.78mi |
| 5081 Wayburn St Detroit, MI | 3.0 | 1.5 | — | $1,400 | — | 17d | 1 | 0.80mi |
| 9832 Balfour Rd Detroit, MI | 3.0 | 1.0 | — | $1,500 | — | 17d | 1 | 0.80mi |
| 11018 Whitehill St Detroit, MI | 3.0 | 1.0 | 1146 | $1,450 | $1.27 | 10d | 1 | 0.80mi |
| 5274 Nottingham Rd Detroit, MI | 4.0 | 2.5 | — | $1,520 | — | 17d | 1 | 0.83mi |
| 13004 Rosemary St Detroit, MI | 5.0 | 2.0 | — | $1,700 | — | 43d | 1 | 0.85mi |
| 12840 Kilbourne St Detroit, MI | 3.0 | 1.0 | 1136 | $1,350 | $1.19 | 17d | 1 | 0.91mi |
| 5574 Buckingham Ave Detroit, MI | 3.0 | 1.0 | — | $1,450 | — | 4d | 1 | 0.96mi |
| 5574 Buckingham Ave Detroit, MI | 3.0 | 1.0 | — | $1,475 | — | 19d | 1 | 0.96mi |
| 5574 Buckingham Ave Detroit, MI | 3.0 | 1.0 | 1430 | $1,450 | $1.01 | 4d | 1 | 0.96mi |
| 12809 Kilbourne St Detroit, MI | 3.0 | 1.0 | — | $1,100 | — | 17d | 1 | 0.96mi |
| 11067 Wayburn St Detroit, MI | 3.0 | 2.0 | — | $1,400 | — | 17d | 1 | 0.97mi |
| 4708 Lakewood St Detroit, MI | 3.0 | 1.0 | — | $1,100 | — | 43d | 1 | 1.00mi |
| 10440 Nottingham Rd Detroit, MI | 3.0 | 1.5 | — | $1,249 | — | 44d | 1 | 1.01mi |
| 12210 Longview St Detroit, MI | 3.0 | 1.0 | 1020 | $1,100 | $1.08 | 43d | 1 | 1.02mi |
| 10803 Roxbury St Detroit, MI | 3.0 | 1.0 | 1150 | $900 | $0.78 | 20d | 1 | 1.02mi |
| 15000 Mayfield St Detroit, MI | 3.0 | 1.0 | 1146 | $970 | $0.85 | 17d | 1 | 1.06mi |
| 5267 Haverhill St Detroit, MI | 3.0 | 1.5 | 1458 | $1,300 | $0.89 | 17d | 1 | 1.06mi |
Listing history 18 events
-
2026-06-04days on market $115,000 Active 91 DOM
-
2026-06-03days on market $115,000 Active 90 DOM
-
2026-06-01days on market $115,000 Active 88 DOM
-
2026-05-31days on market $115,000 Active 87 DOM
-
2026-03-23historical $1,028
-
2026-03-11status Active 668-char remark
Show marketing remark (668 chars)
Charming side-by-side duplex featuring two 1-bedroom, 1-bath units, each with its own private entrance. One unit is currently occupied, providing immediate rental income, while the other unit is vacant, creating a great house-hacking opportunity for an owner-occupant or the ability to lease at market rent. Both units offer functional layouts with comfortable living spaces and ample natural light. Ideal for investors or buyers looking to live in one unit while offsetting housing costs with rental income. Conveniently located near major roadways, shopping, dining, and neighborhood amenities. A versatile, income-producing property with strong long-term potential.
-
2026-03-10historical 668-char remark
Show marketing remark (668 chars)
Charming side-by-side duplex featuring two 1-bedroom, 1-bath units, each with its own private entrance. One unit is currently occupied, providing immediate rental income, while the other unit is vacant, creating a great house-hacking opportunity for an owner-occupant or the ability to lease at market rent. Both units offer functional layouts with comfortable living spaces and ample natural light. Ideal for investors or buyers looking to live in one unit while offsetting housing costs with rental income. Conveniently located near major roadways, shopping, dining, and neighborhood amenities. A versatile, income-producing property with strong long-term potential.
-
2026-03-04$115,000 Active 668-char remark
Show marketing remark (668 chars)
Charming side-by-side duplex featuring two 1-bedroom, 1-bath units, each with its own private entrance. One unit is currently occupied, providing immediate rental income, while the other unit is vacant, creating a great house-hacking opportunity for an owner-occupant or the ability to lease at market rent. Both units offer functional layouts with comfortable living spaces and ample natural light. Ideal for investors or buyers looking to live in one unit while offsetting housing costs with rental income. Conveniently located near major roadways, shopping, dining, and neighborhood amenities. A versatile, income-producing property with strong long-term potential.
-
2026-03-01$1,028
-
2025-10-30historical
-
2025-10-29historical
-
2025-07-28$110,000 Active
-
2025-07-27$110,000 Active
-
2024-10-17historical
-
2024-08-07price $110,000
-
2024-08-07price $110,000
-
2024-07-16$120,000 Active
ⓘ Source: listings_history table (triggers on properties + properties_extension) + one-shot
backfill from property_details.listing_events for pre-trigger history.
Climate risk First Street
- Flood 1/10 Low FEMA zone X (unshaded) · 0% chance over 30 yrs
- Wildfire 1/10 Low
- Heat 3/10 Moderate 7 d/yr ≥95°F today · 15 d/yr by 30 yrs out
- Wind 2/10 Low
- Air quality 3/10 Moderate 2 unhealthy d/yr today · 5 by 30 yrs out
Nearby sold comps map
Loading sold comps map…
Walkable amenities ~0.75 mi
Loading nearby amenities…
Taxation est. · year 1
- Rental income
- $23,952
- − Mortgage interest
- −$6,442
- − Property taxes
- −$1,725
- − Insurance
- −$575
- − Repairs & maintenance
- −$1,916
- − Management
- −$1,916
- − Depreciation
- −$3,345
- Taxable income
- $8,032
- Est. tax owed @ 24.0%
- −$1,928
- After-tax cash flow
- $7,457/yr
For passive investors: Depreciation is non-cash, so a rental often shows a tax loss while cash-flowing — sheltering income. Rental losses are passive: they offset passive income freely, and up to $25,000/yr can offset ordinary (W-2) income if you actively participate and your MAGI is under $100k (phasing out to $0 by $150k); unused losses carry forward. On sale, claimed depreciation is recaptured at up to 25%, and gains may owe capital-gains tax (a 1031 exchange can defer both). Figures are a year-1 estimate at your 24.0% rate — not tax advice; consult a CPA.
Condition & rehab AI · 0 photos
The property is a side-by-side duplex in fair condition with moderate rehabilitation needs. Immediate updates to the exterior and interior can significantly increase its resale and rental value.
Repairs flagged
- Minor Kitchen cabinets — The cabinets appear to be in good condition with no visible signs of damage.
- Minor Bathroom fixtures — The fixtures appear to be in good condition with no visible signs of damage.
- Minor Exterior paint — The paint appears to be fresh and in good condition.
Value-add opportunities
- Both Paint exterior — Fresh paint can significantly improve curb appeal and the home's overall appearance, attracting more potential buyers or renters.
- Both Replace outdated fixtures — Upgrading the fixtures in the bathrooms and kitchen can improve the home's functionality and appeal to potential buyers or renters.
- Both Landscaping — A well-maintained and aesthetically pleasing landscape can enhance the home's curb appeal and attract more potential buyers or renters.
Renovation cost estimate screening
| Repair item | Severity | Est. cost |
|---|---|---|
| Kitchen cabinets · The cabinets appear to be in good condition with no visible signs of damage. | Minor | $500–3,000 |
| Bathroom fixtures · The fixtures appear to be in good condition with no visible signs of damage. | Minor | $500–3,000 |
| Exterior paint · The paint appears to be fresh and in good condition. | Minor | $500–3,000 |
| Total estimated repair cost · 3 items | $1,500–9,000 |
Value-add ROI direction
- Both Paint exterior — Fresh paint can significantly improve curb appeal and the home's overall appearance, attracting more potential buyers or renters. ↑
- Both Replace outdated fixtures — Upgrading the fixtures in the bathrooms and kitchen can improve the home's functionality and appeal to potential buyers or renters. ↑
- Both Landscaping — A well-maintained and aesthetically pleasing landscape can enhance the home's curb appeal and attract more potential buyers or renters. ↑
ⓘ Cost ranges are severity-bucket heuristics (US national rule-of-thumb). Get contractor quotes + a written scope before underwriting a rehab budget.
Schools (NCES district)
- District
- Detroit Public Schools Community District
- NCES district ID
- 2601103
- Math proficiency
- 10% ▼ -2.00%
- Reading proficiency
- 24% ▲ 6.00%
- Median HH income
- $25,815
- Composite
- 13.06/100
- National rank
- #9564
- State rank
- #499 of 540 in MI
Livability — Detroit
- Score
- 73/100
- State rank
- #218
- US rank
- #5427
Category grades
Schools grade is shown separately in the Schools card above.
Census & demographics
- Census place
- Detroit, MI
- County
- Wayne County · 1,562,939 people
- City population
- 572,865
- Metro
- Detroit-Warren-Dearborn, MI
- Population (ZIP)
- 20,075
- Household income
- $34,003
- Rent vs Own
- Severe rent burden
- 1202.0
Population outlook (Wayne County) Hauer SSP2
- Today (2025)
- 1,675,273 people
- By 2030
- 1,620,300 · -3.3%
- By 2040
- 1,502,341 · -10.3%
- By 2050
- 1,384,039 · -17.4%
- By 2075
- 1,124,592 · -32.9%
- By 2100
- 881,193 · -47.4%
Race, ethnicity, and origin ACS 2023
- Neighborhood character
- Predominantly Black (92%)
- Race & ethnicity
- Black 92% White 4% Hispanic / Latino 2% Two or more races 1%
- Common ancestry
- Slovak 1%
- Foreign-born
- 2% · Canada
- Languages at home
- 97% English-only · Arabic 1% Spanish 1%
Political lean MEDSL · Wayne
- 2024 margin
- Strong D (+29.0) · D 62.7% · R 33.7% · Other 3.6%
- 2008→2024 swing
- -20.5pp toward R · 2008: 49.5pp · 2024: 29.0pp
- All cycles
- 2024: D+29.0 2020: D+38.1 2016: D+37.3 2012: D+46.9 2008: D+49.5
Not yet ingested
- Civics
- —
Market trends
- HPI YoY
- ▼ -122.86%
- Current HPI
- 217.2037
- Rent YoY
- —
- Metro
- Detroit-Warren-Dearborn, MI
- State GDP YoY
- ▲ 1.37%
- F500 in state
- 28
Industry mix (Fortune 500 HQ in MI)
| Industry | F500 HQs | Revenue |
|---|---|---|
| Automotive Parts | 3 | $48B |
|
||
| Automotive | 2 | $372B |
|
||
| Chemicals | 1 | $45B |
|
||
| Automotive Retail | 1 | $29B |
|
||
| Healthcare / Medical Devices | 1 | $23B |
|
||
| Automotive Technology | 1 | $20B |
|
||
Price history
-99.1% since first listed14 events — show timeline
- 2026-03-23 Rental Removed $1,028 RENTLY
- 2026-03-11 Relisted — REALCOMP
- 2026-03-10 Listing Removed — REALCOMP
- 2026-03-04 Listed $115,000 MiRealSource-MiMLS
- 2026-03-04 Listed $115,000 REALCOMP
- 2026-03-01 Listed for Rent $1,028 RENTLY
- 2025-10-30 Listing Removed — MiRealSource-MiMLS
- 2025-10-29 Listing Removed — REALCOMP
- 2025-07-28 Listed $110,000 REALCOMP
- 2025-07-27 Listed $110,000 MiRealSource-MiMLS
- 2024-10-17 Listing Removed — MiRealSource-MiMLS
- 2024-08-07 Price Changed $110,000 MiRealSource-MiMLS
- 2024-08-07 Price Changed $110,000 SW Michigan MLS
- 2024-07-16 Listed $120,000 MiRealSource-MiMLS
Cash-flow waterfall
monthlySold comps — $/sqft
last 12 mo · ≤1 miLoading sold comps…