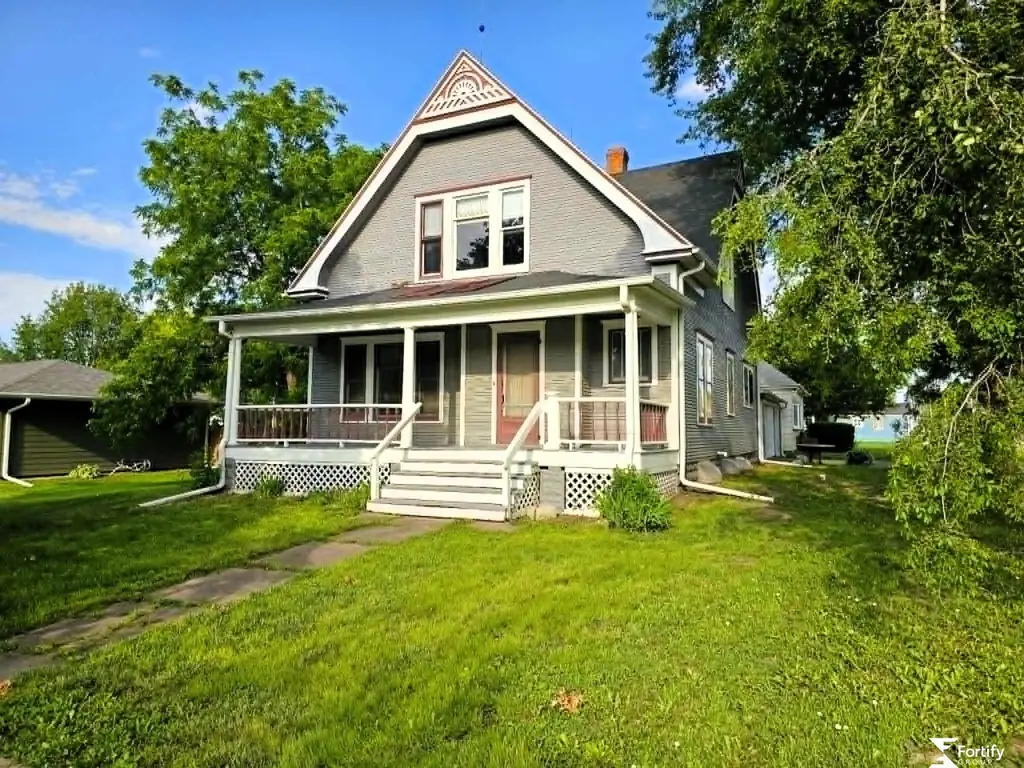
201 S Jefferson St · Bruning, NE
Flood risk 1/10 · Minimal
- FEMA flood zone
- X (unshaded)
- Chance of flooding over 30 yrs
- 0.0%
- Est. flood insurance / yr
- $473 – $860
Fire risk 1/10 · Minimal
- Est. fire insurance / yr
- $1,161 – $2,155
Heat risk 3/10 · Minor
- Hot days now (above 104°F)
- 7 days/yr
- Hot days in 30 yrs
- 16 days/yr
Wind risk 2/10 · Minimal
- Chance of severe wind over 30 yrs
- —
Air-quality risk 1/10 · Minimal
- Unhealthy air days now
- 0 days/yr
- Unhealthy air days in 30 yrs
- 0 days/yr
Risk factors via First Street. Map © Google.
Why this score? — see what drove the B+ grade
The composite is a weighted blend of 9 inputs, each scored 0–100. Each bar is that input's sub-score; the figure is the points it added to the 100-point composite (weight × sub-score).
- Cash flow +30.0/30.0
- 1% rule +10.0/10.0
- DSCR +10.0/10.0
- ARV discount +7.5/15.0
- Schools +5.2/10.0
- Appreciation +5.1/10.0
- Livability +3.4/5.0
- Rent growth +2.5/5.0
- Condition / age +2.5/5.0
$70,000
🖨 Deal sheet 📄 Offer letter ✓ Due diligence
Listing remarks
This 4 or 5-bedroom, 1-bath home, built in 1910 and set on a corner lot, keeps the character that makes vintage Nebraska houses worth holding on to. Original wood floors and woodwork, 9-foot ceilings, pocket doors between the living and dining rooms, French doors off the flex room, and a clawfoot tub in the bath. The kitchen and bathroom both have newer windows, and the covered front porch was lifted about two years ago, so you have a real spot to sit out front. Upstairs, three bedrooms each have walk-in closets, plus a landing big enough to claim as a reading nook or small office. The mechanicals and exterior have seen recent attention: roof and gutters are about 5 years old, leaf gutter g
Key facts
- Pocket doors
- 9 foot ceilings
- French doors
Tags
Property features AI
Exterior
- Parking: Attached 2-car garage; Two covered parking spaces
- Utilities: Public water; Public sewer
- Home design: Two-story single-family residence (residential); Property not new
- Construction: House built in 1910; Block foundation
- Exterior features: Front porch
Interior
- Kitchen: Kitchen on main floor with wood flooring, 9'+ ceiling, ceiling fan, and exterior door
- Bedrooms: Primary bedroom on 2nd floor with wood flooring, ceiling fan, and walk-in closet; Bedroom 2 on main floor with wall-to-wall carpeting; Bedroom 3 on 2nd floor with wall-to-wall carpeting, ceiling fan, and walk-in closet; Bedroom 4 on 2nd floor with wall-to-wall carpeting, ceiling fan, and walk-in closet; Office on main floor with wood flooring, 9'+ ceiling, ceiling fan, and exterior door
- Flooring: Wood flooring in kitchen, dining room, office, and primary bedroom; Wall-to-wall carpeting in living room and several bedrooms
- Bathrooms: One full bathroom (main level)
- Heating & cooling: Propane heating with forced air
- Interior features: Unfinished basement; Concrete floor in laundry; No fireplaces
- Laundry & utility: Laundry area with concrete floor
Neighborhood map
What this means for you Summary
Snapshot
- This is a 5-bed/1.0-bath single-family listed at $70k.
Deal economics
- At list price, monthly cash flow is $562 ($7k/yr) — positive.
- The deal already cash-flows at list — no discount required.
- Meets the 1% rule at list price ($1k rent vs $70k).
Location & tenants
- Location reads 68/100 on livability (#258 in NE) — a middle-class / working-renter tenant base. Strengths: cost of living A+, housing A+, schools B+; Watch: health & safety C-, amenities F, commute F.
- Bruning-Davenport Unified System (rural): math 70% / reading 50% proficiency, ranked #65 of 245 in NE (top 26%) — acceptable for families but not a draw, mixed tenant base, ~2y average lease.
- Market conditions: 6 active listings in the ZIP; 3 units permitted in Thayer County in 2024 (0 in 5+ unit buildings).
Forward outlook
- In year one you build about $570 of equity ($484 loan paydown + $86 appreciation (0.1% local appreciation)).
- Thayer County population projected at +6% by 2050 — modest demand growth; plan on rents tracking national, not racing it.
- At projected returns (0.1% appreciation + 3.0% rent growth), your $20k cash investment doubles in ~3 years — after that, you're playing with house money.
Negotiation context
- Only 2 days on market — expect competitive offers; lowballing is unlikely to land.
- 3 sale attempts since 4y ago with the ask held roughly flat each time — persistent listings suggest the price (not the market) is what's stuck; bring a comps-based counter.
- Current owner paid $20k; list at $70k implies a 244% gain — meaningful room to come down on a strong offer.
Risks & watch-outs
- Watch-outs: built in 1910 — expect roof / HVAC / electrical / plumbing capex.
Questions for the listing agent
- Built in 1910 — when were the roof, HVAC, electrical panel, plumbing, and water heater last replaced?
- Is there a deadline driving the sale (1031 exchange, divorce, estate, relocation)? That informs how much negotiation room exists.
- Schools are B-rated — typically a magnet for longer-tenancy family renters. What's the average tenant stay here, and is there a school-zone premium baked into asking?
- What's the average days-on-market for RENTAL listings here right now (not sales)? A rising rental-DOM trend means longer vacancies and softer asking-rent achievability than the comps imply.
- What's the recent tenant-quality profile in this submarket — average credit score on applications, eviction rate, late-payment / NSF rate, and stable-employment percentage? A property-management company in the area should have these aggregated.
- How much new for-sale + rental construction is in the pipeline within 1–3 miles? Heavy new supply typically softens prices + rents 12–24 months out; constrained supply supports both.
Investment metrics
- 1% rule
- 1.81% ✓
- Cap rate
- 15.93%
- Cash-on-cash
- 34.41%
- DSCR
- 2.53
- GRM
- 4.6
CMA / ARV
No comps found within radius.
Projected returns pro-forma
0.12% appreciation · 3.0% rent growth · sell at horizon
- IRR
- 35.4%
- Equity multiple
- 2.74×
- Total profit
- $34,145
- Equity at exit
- $20,759
- IRR
- 38.5%
- Equity multiple
- 5.36×
- Total profit
- $85,432
- Equity at exit
- $25,301
Cash invested: $19,600 (down + closing). Projections, not guarantees.
Landlord ↔ Tenant lean methodology
- Overall (STATE)
- 83 Strongly Landlord-Friendly
- State Nebraska
- 83 Strongly Landlord-Friendly · R+13
- County
- — inherits STATE
- City
- — inherits STATE
ZIP-level market 68322
- Home prices YoY
- 0.1%
- Active inventory
- 6
- Price-to-rent
- 4.6×
Monthly cashflow live
- Estimated rent
- $1,265 medium interval (Pro) →
- Mortgage (P&I)
- −$367
- Tax from tax record
- −$41 /mo · $490/yr
- Insurance
- −$29
- HOA
- −$0
- Vacancy / Maint / Mgmt
- −$266
- Net cashflow
- $562
Break-even live
UW: 25.0% down · 7.5% · 30yr · 1.5% tax · 5.0% vac · 8.0% maint · 8.0% mgmt
Financing live
Cash to close
- Down payment
- $17,500
- Closing costs
- $2,100
- Reserves months
- —
- Total cash needed
- —
Loan-product check · same deal, 3 products live
Conventional
25% down · 7.5% · 30yr
- Down + closing
- —
- Monthly P&I
- —
- Monthly cashflow
- —
- DSCR
- —
- Eligible?
- —
Personal DTI + credit; lowest rate.
DSCR
20% down · 8.5% · 30yr
- Down + closing
- —
- Monthly P&I
- —
- Monthly cashflow
- —
- DSCR
- —
- Eligible?
- —
No personal income docs; deal must DSCR.
Hard money
10% down · 12.0% · 12mo
- Down + closing
- —
- Monthly P&I
- —
- Monthly cashflow
- —
- DSCR
- —
- Eligible?
- —
Short-term bridge; refi at stabilization.
Listing history 3 events
-
2026-06-12statusdays on market $70,000 Pending 2 DOM
-
2026-06-09remarks 699-char remark
-
2026-06-09$70,000 New 1 DOM
ⓘ Source: listings_history table (triggers on properties + properties_extension) + one-shot
backfill from property_details.listing_events for pre-trigger history.
Tax reassessment forecast NE · Resets to sale price
- Current annual tax
- $490 · $41/mo
- Projected year-2 tax
- $1,211 · $101/mo
- Expected delta
- +$721/yr (+$60/mo · 147.4%)
ⓘ Screening estimate from a state-policy table — verify with the county assessor before closing.
Climate risk First Street
- Flood 1/10 Low FEMA zone X (unshaded) · 0% chance over 30 yrs
- Wildfire 1/10 Low
- Heat 3/10 Moderate 7 d/yr ≥104°F today · 16 d/yr by 30 yrs out
- Wind 2/10 Low
- Air quality 1/10 Low 0 unhealthy d/yr today · 0 by 30 yrs out
Nearby sold comps map
Loading sold comps map…
Walkable amenities ~0.75 mi
Loading nearby amenities…
Taxation est. · year 1
- Rental income
- $15,176
- − Mortgage interest
- −$3,921
- − Property taxes
- −$490
- − Insurance
- −$350
- − Repairs & maintenance
- −$1,214
- − Management
- −$1,214
- − Depreciation
- −$2,036
- Taxable income
- $5,951
- Est. tax owed @ 24.0%
- −$1,428
- After-tax cash flow
- $5,316/yr
For passive investors: Depreciation is non-cash, so a rental often shows a tax loss while cash-flowing — sheltering income. Rental losses are passive: they offset passive income freely, and up to $25,000/yr can offset ordinary (W-2) income if you actively participate and your MAGI is under $100k (phasing out to $0 by $150k); unused losses carry forward. On sale, claimed depreciation is recaptured at up to 25%, and gains may owe capital-gains tax (a 1031 exchange can defer both). Figures are a year-1 estimate at your 24.0% rate — not tax advice; consult a CPA.
Schools (NCES district)
- District
- Bruning-Davenport Unified System
- NCES district ID
- 3100124
- Math proficiency
- 70% ▲ 10.00%
- Reading proficiency
- 50% ▬ 0.00%
- Median HH income
- $46,647
- Composite
- 52.41/100
- National rank
- #3418
- State rank
- #65 of 245 in NE
Livability — Bruning
- Score
- 68/100
- State rank
- #258
- US rank
- #9269
Category grades
Schools grade is shown separately in the Schools card above.
Census & demographics
- Census place
- Bruning, NE
- Population (ZIP)
- 520
Population outlook (Thayer County) Hauer SSP2
- Today (2025)
- 4,947 people
- By 2030
- 4,983 · +0.7%
- By 2040
- 5,052 · +2.1%
- By 2050
- 5,224 · +5.6%
- By 2075
- 6,247 · +26.3%
- By 2100
- 6,520 · +31.8%
Race, ethnicity, and origin ACS 2023
- Neighborhood character
- Predominantly White (89%)
- Race & ethnicity
- White 89% Two or more races 7% Hispanic / Latino 5% Native American 1%
- Common ancestry
- Slovak 2% Italian 1% Iranian 1%
- Foreign-born
- 1% · Canada
- Languages at home
- 98% English-only · Spanish 1% German/W. Germanic 1%
Political lean MEDSL · Thayer
- 2024 margin
- Solid R (+60.8) · D 19.1% · R 79.9% · Other 1.1%
- 2008→2024 swing
- -27.4pp toward R · 2008: -33.4pp · 2024: -60.8pp
- All cycles
- 2024: R+60.8 2020: R+56.3 2016: R+57.5 2012: R+43.0 2008: R+33.4
Not yet ingested
- Civics
- —
Market trends
- HPI YoY
- ▲ 0.12%
- Current HPI
- 220.4337
- Rent YoY
- —
- Metro
- —
- State GDP YoY
- ▲ 0.68%
- F500 in state
- 2
Industry mix (Fortune 500 HQ in NE)
| Industry | F500 HQs | Revenue |
|---|---|---|
| Conglomerate | 1 | $371B |
|
||
Price history
+244.4% since first listed10 events — show timeline
- 2026-05-04 Listed $70,000 GPRMLS
- 2022-10-01 Listing Removed — GPRMLS
- 2022-08-02 Price Changed $75,000 GPRMLS
- 2022-08-01 Relisted — GPRMLS
- 2022-07-27 Pending — GPRMLS
- 2022-06-21 Price Changed $92,500 GPRMLS
- 2022-04-20 Price Changed $95,000 GPRMLS
- 2022-03-15 Price Changed $99,500 GPRMLS
- 2022-02-23 Listed $105,000 GPRMLS
- 2002-04-01 Sold (Public Records) $20,323 Public Records
Property tax history
+2.6%/yrLatest (2025): $490 · +15.3% YoY. Source: county tax records.
Cash-flow waterfall
monthlySold comps — $/sqft
last 12 mo · ≤1 miLoading sold comps…