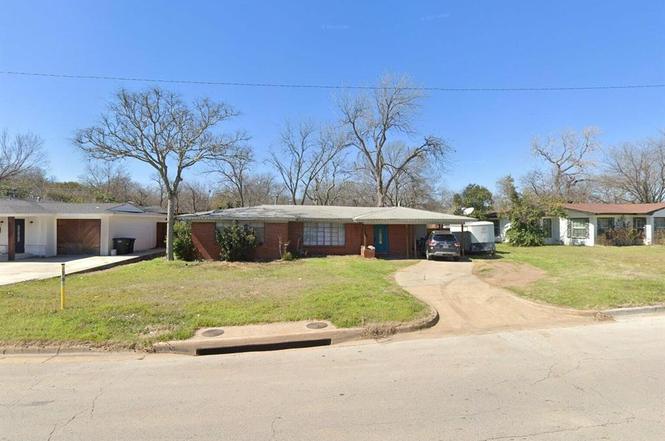
4728 Trail Lake Dr · Fort Worth, TX
Flood risk 7/10 · Major
- FEMA flood zone
- X (unshaded)
- Chance of flooding over 30 yrs
- 0.95%
- Est. flood insurance / yr
- $507 – $1,088
Fire risk 1/10 · Minimal
- Est. fire insurance / yr
- $1,222 – $2,270
Heat risk 7/10 · Major
- Hot days now (above 109°F)
- 7 days/yr
- Hot days in 30 yrs
- 23 days/yr
Wind risk 4/10 · Minor
- Chance of severe wind over 30 yrs
- 25.0%
Air-quality risk 3/10 · Minor
- Unhealthy air days now
- 2 days/yr
- Unhealthy air days in 30 yrs
- 3 days/yr
Risk factors via First Street. Map © Google.
Why this score? — see what drove the B grade
The composite is a weighted blend of 9 inputs, each scored 0–100. Each bar is that input's sub-score; the figure is the points it added to the 100-point composite (weight × sub-score).
- Cash flow +26.9/30.0
- ARV discount +15.0/15.0
- DSCR +9.3/10.0
- 1% rule +9.1/10.0
- Livability +4.0/5.0
- Rent growth +2.5/5.0
- Condition / age +2.5/5.0
- Schools +2.0/10.0
- Appreciation +0.0/10.0
$148,999
🖨 Deal sheet 📄 Offer letter ✓ Due diligence
Listing remarks
Calling all investors! Unlock the potential at 4728 Trail Lake Dr in Fort Worth! This property is the perfect opportunity for investors, flippers, or buyers looking to build sweat equity. The home offers a functional layout with plenty of space and the potential to be converted into a 3 bedroom, 2 bathroom home with the right vision. While the property does need TLC and updates, the bones are there for a great transformation. With some renovation and creativity, this home could be turned into a fantastic primary residence, rental property, or resale project. Located in an established neighborhood with convenient access to shopping, dining, schools, and major highways, this is a chance to cr
Key facts
- Convenient access
- Functional layout
- 0.26 acre lot
Tags
Neighborhood map
What this means for you Summary
Snapshot
- This is a 3-bed/2.0-bath single-family listed at $149k.
Deal economics
- At list price, monthly cash flow is $344 ($4k/yr) — positive.
- The deal already cash-flows at list — no discount required.
- Meets the 1% rule at list price ($2k rent vs $149k).
- Recommended offer: $145k (3.0% below list) — sets the bar for market timing.
- Cap rate 9.6% vs local median 3.9% in Fort Worth — top-decile yield for the area; either an underpriced asset or a hidden risk that comps aren't pricing in. Stress-test before assuming the spread holds.
Location & tenants
- Location reads 80/100 on livability (#49 in TX, #1,954 nationally) — a professional / high-income tenant draw. Strengths: amenities A+, cost of living A+, housing A+; Watch: crime F.
- Fort Worth ISD (urban): math 18% / reading 28% proficiency, ranked #742 of 826 in TX (top 90%) — low school quality limits family demand, transient renter base, plan for 1-2y turnover; 73% free/reduced lunch — lower-income household profile, screen leases tightly.
- Zoned schools: South Hills El (math 18% / reading 22%, grade F, #3,536 of 4,322 statewide, top 83%, 690 students, 90% FRL) — zoned schools average 90% FRL vs 73% district-wide (17 pts higher); higher-poverty schools than district average — tighter screening recommended.
- Market conditions: Rents soft (-0.2%/yr); 205 active listings in the ZIP; 40 comparable units currently listed for rent nearby; rentals at typical pace (median 24d on market — plan ~3-4 weeks tenant-placement turnaround); solid renter incomes; 18,938 units permitted in Tarrant County in 2024 (8,336 in 5+ unit buildings).
- This rent runs 33% of the median local income ($76k/yr) — at the standard rent-burdened threshold; future hikes will face affordability resistance.
Forward outlook
- Local home prices are declining (-3.0%/yr); year-one equity from $1k of loan paydown is wiped out by about $4k of value loss. Plan a longer hold.
- Tarrant County population projected at +41% by 2050 — long-run rental-demand tailwind backs the buy-and-hold thesis.
Negotiation context
- It's been on market 40 days — a 3% lower offer ($145k) is reasonable based on typical stale-listing flexibility.
Risks & watch-outs
- Watch-outs: property tax is 3.3% of price; flood insurance adds $66/mo; built in 1951 — expect roof / HVAC / electrical / plumbing capex.
- Climate carrying-cost: major flood risk; extreme-heat days projected 7→23/yr by 2055 (HVAC capex compounding) — expect insurance premiums to compound above CPI over the hold.
Questions for the listing agent
- It's been on market 40 days. Have you received any prior offers? Is the seller open to a 3% concession, seller financing, or rate buy-down credit?
- Built in 1951 — when were the roof, HVAC, electrical panel, plumbing, and water heater last replaced?
- Property tax is high relative to price — has the assessment been appealed recently, and will the sale trigger a re-assessment?
- What's the actual annual flood-insurance premium (NFIP or private), and is the property in a SFHA with mandatory coverage?
- Is there a deadline driving the sale (1031 exchange, divorce, estate, relocation)? That informs how much negotiation room exists.
- Schools are D-rated, which usually means shorter tenancies and higher turnover. Who's the typical renter profile here, and what's been the actual vacancy rate?
- Crime grade is F in this area — have there been break-ins, vandalism, or insurance claims at this property in the last 3 years? What carrier currently insures it and at what premium?
- What's the average days-on-market for RENTAL listings here right now (not sales)? A rising rental-DOM trend means longer vacancies and softer asking-rent achievability than the comps imply.
- What's the recent tenant-quality profile in this submarket — average credit score on applications, eviction rate, late-payment / NSF rate, and stable-employment percentage? A property-management company in the area should have these aggregated.
- How much new for-sale + rental construction is in the pipeline within 1–3 miles? Heavy new supply typically softens prices + rents 12–24 months out; constrained supply supports both.
Investment metrics
- 1% rule
- 1.41% ✓
- Cap rate
- 9.60%
- Cash-on-cash
- 11.82%
- DSCR
- 1.53
- GRM
- 5.9
CMA / ARV
- ARV (on-the-fly)
- $285,825
- Comps found
- 12
Show comp detail 12 sales within ~0.75 mi
| Address | Dist | Beds/Ba | Sqft | Sold | Price | $/sf | Match |
|---|---|---|---|---|---|---|---|
| 4804 Overton Ave | 0.11mi | 3/2.0 | 1,533 (-1%) | 2mo | $294,990 | $192 | 92 |
| 4728 Trail Lake Dr | 0.00mi | 2/1.0 (-1) | 1,545 (0%) | 1mo | $148,999 | $96 | 90 |
| 4805 Trail Lake Dr | 0.15mi | 3/2.0 | 1,534 (-1%) | 3mo | $199,000 | $130 | 90 |
| 4517 Selkirk Dr | 0.28mi | 3/2.0 | 1,378 (-11%) | 3mo | $362,900 | $263 | 67 |
| 3401 Cromart Ave | 0.50mi | 3/2.0 | 1,438 (-7%) | 2mo | $275,000 | $191 | 64 |
| 3200 Medina Ave | 0.62mi | 4/2.0 (+1) | 1,588 (+3%) | 1mo | $284,000 | $179 | 60 |
| 3104 Binyon St | 0.67mi | 4/2.0 (+1) | 1,603 (+4%) | 3mo | $307,000 | $192 | 55 |
| 3213 Leith Ave | 0.70mi | 3/2.0 | 1,648 (+7%) | 2mo | $264,900 | $161 | 55 |
| 4121 Bilglade Rd | 0.57mi | 3/2.0 | 1,710 (+11%) | 2mo | $480,000 | $281 | 54 |
| 4952 Stadium Dr | 0.68mi | 4/2.0 (+1) | 1,632 (+6%) | 1mo | $239,900 | $147 | 54 |
| 3504 Westfield Ave | 0.59mi | 3/2.0 | 1,730 (+12%) | 3mo | $215,000 | $124 | 50 |
| 4937 Rutland Ave | 0.69mi | 2/2.0 (-1) | 1,348 (-13%) | 2mo | $250,000 | $185 | 40 |
Match score weights: distance 35% · size 25% · config 20% · recency 20%. Top-matched comps best support the ARV.
Projected returns pro-forma
-3.0% appreciation · 0.0% rent growth · sell at horizon
- IRR
- -5.5%
- Equity multiple
- 0.80×
- Total profit
- $-8,158
- Equity at exit
- $22,216
- IRR
- -0.8%
- Equity multiple
- 0.96×
- Total profit
- $-1,814
- Equity at exit
- $12,883
Cash invested: $41,720 (down + closing). Projections, not guarantees.
Landlord ↔ Tenant lean methodology
- Overall (STATE)
- 87 Strongly Landlord-Friendly
- State Texas
- 87 Strongly Landlord-Friendly · R+5
- County
- — inherits STATE
- City
- — inherits STATE
ZIP-level market 76133
- Rents YoY
- -0.2%
- Active inventory
- 205
- Price-to-rent
- 5.9×
Monthly cashflow live
- Estimated rent
- $2,101 high interval (Pro) →
- Mortgage (P&I)
- −$781
- Tax from tax record
- −$406 /mo · $4,869/yr
- Insurance
- −$62
- Flood insurance flood zone
- −$66 /mo · $798/yr
- HOA
- −$0
- Vacancy / Maint / Mgmt
- −$441
- Net cashflow
- $344
Break-even live
UW: 25.0% down · 7.5% · 30yr · 1.5% tax · 5.0% vac · 8.0% maint · 8.0% mgmt
Financing live
Cash to close
- Down payment
- $37,250
- Closing costs
- $4,470
- Reserves months
- —
- Total cash needed
- —
Loan-product check · same deal, 3 products live
Conventional
25% down · 7.5% · 30yr
- Down + closing
- —
- Monthly P&I
- —
- Monthly cashflow
- —
- DSCR
- —
- Eligible?
- —
Personal DTI + credit; lowest rate.
DSCR
20% down · 8.5% · 30yr
- Down + closing
- —
- Monthly P&I
- —
- Monthly cashflow
- —
- DSCR
- —
- Eligible?
- —
No personal income docs; deal must DSCR.
Hard money
10% down · 12.0% · 12mo
- Down + closing
- —
- Monthly P&I
- —
- Monthly cashflow
- —
- DSCR
- —
- Eligible?
- —
Short-term bridge; refi at stabilization.
Rent comps 40 comps
| Address | Beds | Baths | Sqft | Rent | $/sqft | DOM | Units | Dist |
|---|---|---|---|---|---|---|---|---|
| 4709 Trail Lake Dr Fort Worth, TX | 4.0 | 2.0 | 1654 | $2,020 | $1.22 | 24d | 1 | 0.05mi |
| 4804 Trail Lake Dr Fort Worth, TX | 3.0 | 2.0 | 1903 | $2,050 | $1.08 | 44d | 1 | 0.17mi |
| 4900 Vega Ct W Fort Worth, TX | 3.0 | 2.0 | 1555 | $2,350 | $1.51 | 43d | 1 | 0.23mi |
| 3745 Willomet Ave Fort Worth, TX | 3.0 | 2.0 | 1302 | $1,795 | $1.38 | 6d | 1 | 0.31mi |
| 3412 Martin Lydon Ave Fort Worth, TX | 3.0 | 2.0 | 1773 | $2,400 | $1.35 | 21d | 1 | 0.35mi |
| 3816 Cornish Ave Fort Worth, TX | 3.0 | 2.0 | 1595 | $1,320 | $0.83 | 1d | 1 | 0.38mi |
| 3827 Cornish Ave Fort Worth, TX | 3.0 | 2.0 | 1428 | $1,299 | $0.91 | 4d | 1 | 0.42mi |
| 3961 W Spurgeon St Fort Worth, TX | 4.0 | 2.0 | 1820 | $2,185 | $1.20 | 13d | 1 | 0.45mi |
| 3263 Bilglade Rd Fort Worth, TX | 3.0 | 2.5 | 1687 | $1,995 | $1.18 | 24d | 1 | 0.49mi |
| 3259 Binyon Ave Fort Worth, TX | 3.0 | 1.0 | 1260 | $2,200 | $1.75 | 13d | 1 | 0.50mi |
| 4317 Clay Ave Fort Worth, TX | 3.0 | 1.0 | 1240 | $1,995 | $1.61 | 24d | 1 | 0.52mi |
| 4109 Bilglade Rd Fort Worth, TX | 3.0 | 2.0 | 1561 | $2,900 | $1.86 | 43d | 1 | 0.55mi |
| 4904 Odessa Ave Fort Worth, TX | 3.0 | 2.0 | 1360 | $2,050 | $1.51 | 24d | 1 | 0.56mi |
| 4256 Standish Rd Fort Worth, TX | 3.0 | 2.0 | 1392 | $1,650 | $1.19 | 24d | 1 | 0.56mi |
| 5357 Wonder Dr Fort Worth, TX | 3.0 | 2.0 | 1864 | $1,550 | $0.83 | 16d | 1 | 0.58mi |
| 3401 Leith Ave Fort Worth, TX | 3.0 | 2.0 | 1425 | $1,800 | $1.26 | 4d | 1 | 0.59mi |
| 5338 Wonder Dr Fort Worth, TX | 3.0 | 2.0 | 1610 | $1,695 | $1.05 | 43d | 1 | 0.61mi |
| 5352 Wonder Dr Fort Worth, TX | 2.0 | 2.0 | 1244 | $1,495 | $1.20 | 43d | 1 | 0.62mi |
| 3104 Medina Ave Fort Worth, TX | 3.0 | 2.0 | 1355 | $1,850 | $1.37 | 21d | 1 | 0.63mi |
| 3524 South Dr Fort Worth, TX | 4.0 | 2.0 | 1641 | $2,795 | $1.70 | 5d | 1 | 0.65mi |
| 4152 Anita Ave Fort Worth, TX | 2.0 | 1.0 | 1112 | $1,995 | $1.79 | 18d | 1 | 0.66mi |
| 4228 Winfield Ave Fort Worth, TX | 4.0 | 2.0 | 1486 | $3,500 | $2.36 | 18d | 1 | 0.72mi |
| 3120 Covert Ave Fort Worth, TX | 3.0 | 2.0 | 1701 | $2,075 | $1.22 | 43d | 1 | 0.72mi |
| 5303 Wooten Dr Fort Worth, TX | 3.0 | 2.0 | 1524 | $1,750 | $1.15 | 43d | 1 | 0.73mi |
| 5301 Wooten Dr Fort Worth, TX | 3.0 | 2.0 | 1524 | $1,750 | $1.15 | 24d | 1 | 0.73mi |
| 4151 SW Loop 820 Fort Worth, TX | 1.0–3.0 | 1.0–2.5 | 1068 | $1,564 | $1.46 | 1d | 40 | 0.73mi |
| 2908 Binyon Ave Fort Worth, TX | 3.0 | 1.0 | 1249 | $1,775 | $1.42 | 24d | 1 | 0.74mi |
| 4129 Winfield Ave Fort Worth, TX | 3.0 | 2.0 | 1465 | $2,580 | $1.76 | 2d | 1 | 0.77mi |
| 2800 W Fuller Ave Fort Worth, TX | 3.0 | 1.5 | 1161 | $1,650 | $1.42 | 43d | 1 | 0.84mi |
| 4908 Inverness Ave Fort Worth, TX | 3.0 | 2.0 | 1770 | $1,750 | $0.99 | 24d | 1 | 0.85mi |
| 4009 Anita Ave Fort Worth, TX | 4.0 | 2.0 | 1771 | $3,800 | $2.15 | 18d | 1 | 0.88mi |
| 3513 Wosley Dr Fort Worth, TX | 3.0 | 2.0 | 1688 | $1,975 | $1.17 | 43d | 1 | 0.88mi |
| 2800 Sadler Ave Fort Worth, TX | 3.0 | 2.0 | 1811 | $2,300 | $1.27 | 43d | 1 | 0.90mi |
| 3511 Corto Ave Fort Worth, TX | 3.0 | 2.0 | 2036 | $3,800 | $1.87 | 3d | 1 | 0.91mi |
| 5505 Wonder Dr Fort Worth, TX | 3.0 | 2.0 | 2018 | $2,155 | $1.07 | 2d | 1 | 0.92mi |
| 4012 Boyd Ave Fort Worth, TX | 3.0 | 2.0 | 1565 | $2,695 | $1.72 | 4d | 1 | 0.93mi |
| 4806 South Dr Fort Worth, TX | 3.0 | 2.0 | 1436 | $1,900 | $1.32 | 43d | 1 | 0.94mi |
| 4310 Gorman Dr Fort Worth, TX | 2.0 | 2.0 | 1350 | $1,675 | $1.24 | 43d | 1 | 0.98mi |
| 4305 Gorman Dr #1 Fort Worth, TX | 2.0 | 2.0 | 1097 | $1,399 | $1.28 | 43d | 1 | 1.01mi |
| 4302 Segura Ct N Fort Worth, TX | 3.0 | 2.0 | 1406 | $1,700 | $1.21 | 18d | 1 | 1.07mi |
Listing history 9 events
-
2026-04-29soldstatus
-
2026-04-14status Pending
-
2026-04-07price $148,999
-
2026-03-31price $149,900
-
2026-03-19price $155,000
-
2026-03-14price $165,000
-
2026-03-05$175,000 Active
-
2009-02-09soldstatus
-
2008-06-09soldstatus
ⓘ Source: listings_history table (triggers on properties + properties_extension) + one-shot
backfill from property_details.listing_events for pre-trigger history.
Tax reassessment forecast TX · Resets to sale price
- Current annual tax
- $4,869 · $406/mo
- Projected year-2 tax
- $4,869 · $406/mo
- Expected delta
- $0/yr ($0/mo · 0.0%)
ⓘ Screening estimate from a state-policy table — verify with the county assessor before closing.
Climate risk First Street
- Flood 7/10 Severe FEMA zone X (unshaded) · 95% chance over 30 yrs
- Wildfire 1/10 Low
- Heat 7/10 Severe 7 d/yr ≥109°F today · 23 d/yr by 30 yrs out
- Wind 4/10 Moderate 25% chance of damaging wind over 30 yrs
- Air quality 3/10 Moderate 2 unhealthy d/yr today · 3 by 30 yrs out
Nearby sold comps map
Loading sold comps map…
Walkable amenities ~0.75 mi
Loading nearby amenities…
Taxation est. · year 1
- Rental income
- $25,216
- − Mortgage interest
- −$8,346
- − Property taxes
- −$4,869
- − Insurance
- −$1,542
- − Repairs & maintenance
- −$2,017
- − Management
- −$2,017
- − Depreciation
- −$4,335
- Taxable income
- $2,090
- Est. tax owed @ 24.0%
- −$501
- After-tax cash flow
- $3,632/yr
For passive investors: Depreciation is non-cash, so a rental often shows a tax loss while cash-flowing — sheltering income. Rental losses are passive: they offset passive income freely, and up to $25,000/yr can offset ordinary (W-2) income if you actively participate and your MAGI is under $100k (phasing out to $0 by $150k); unused losses carry forward. On sale, claimed depreciation is recaptured at up to 25%, and gains may owe capital-gains tax (a 1031 exchange can defer both). Figures are a year-1 estimate at your 24.0% rate — not tax advice; consult a CPA.
Schools (NCES district)
- District
- Fort Worth ISD
- NCES district ID
- 4819700
- Math proficiency
- 18% ▼ -16.00%
- Reading proficiency
- 28% ▼ -6.00%
- Median HH income
- $42,109
- Composite
- 19.61/100
- National rank
- #8753
- State rank
- #742 of 826 in TX
Livability — Fort Worth
- Score
- 80/100
- State rank
- #49
- US rank
- #1954
Category grades
Schools grade is shown separately in the Schools card above.
Census & demographics
- Census place
- Fort Worth, TX
- County
- Tarrant County · 2,033,669 people
- City population
- 911,619
- Metro
- Dallas-Fort Worth-Arlington, TX
- Population (ZIP)
- 53,958
- Household income
- $75,523
- Rent vs Own
- Severe rent burden
- 2000.0
Population outlook (Tarrant County) Hauer SSP2
- Today (2025)
- 2,380,417 people
- By 2030
- 2,578,900 · +8.3%
- By 2040
- 2,974,995 · +25.0%
- By 2050
- 3,350,489 · +40.8%
- By 2075
- 4,216,909 · +77.2%
- By 2100
- 4,741,527 · +99.2%
Race, ethnicity, and origin ACS 2023
- Neighborhood character
- Diverse neighborhood (Simpson 0.69)
- Race & ethnicity
- Hispanic / Latino 39% White 34% Black 21% Two or more races 19% Asian 3% Native American 1%
- Hispanic origin (detail)
- Mexican 34%
- Common ancestry
- Italian 3% Slovak 2% Lithuanian 1%
- Foreign-born
- 15% · Canada, China, Philippines
- Languages at home
- 70% English-only · Spanish 25% Other Asian/Pacific 1% French/Haitian/Cajun 1%
Political lean MEDSL · Tarrant
- 2024 margin
- Lean R (+5.1) · D 46.7% · R 51.9% · Other 1.4%
- 2008→2024 swing
- +6.6pp toward D · 2008: -11.7pp · 2024: -5.1pp
- All cycles
- 2024: R+5.1 2020: D+0.2 2016: R+8.7 2012: R+15.7 2008: R+11.7
Not yet ingested
- Civics
- —
Market trends
- HPI YoY
- ▼ -196.95%
- Current HPI
- 293.8679
- Rent YoY
- ▼ -0.20%
- Metro
- Dallas-Fort Worth-Arlington, TX
- State GDP YoY
- ▲ 3.95%
- F500 in state
- 110
Industry mix (Fortune 500 HQ in TX)
| Industry | F500 HQs | Revenue |
|---|---|---|
| Energy | 16 | $1,198B |
|
||
| Technology | 5 | $198B |
|
||
| Engineering / Construction | 4 | $72B |
|
||
| Energy Services | 3 | $60B |
|
||
| Utilities | 3 | $41B |
|
||
| Healthcare | 2 | $330B |
|
||
Price history
-14.9% since first listed9 events — show timeline
- 2026-04-29 Sold (Public Records) — Public Records
- 2026-04-14 Pending — NTREIS
- 2026-04-07 Price Changed $148,999 NTREIS
- 2026-03-31 Price Changed $149,900 NTREIS
- 2026-03-19 Price Changed $155,000 NTREIS
- 2026-03-14 Price Changed $165,000 NTREIS
- 2026-03-05 Listed $175,000 NTREIS
- 2009-02-09 Sold (Public Records) — Public Records
- 2008-06-09 Sold (Public Records) — Public Records
Property tax history
+4.1%/yrLatest (2025): $4,869 · -2.4% YoY. Source: county tax records.
Cash-flow waterfall
monthlySold comps — $/sqft
last 12 mo · ≤1 miLoading sold comps…