114 Pacific Mill Pl #5 · Lyman, SC
Flood risk 1/10 · Minimal
- FEMA flood zone
- X (unshaded)
- Chance of flooding over 30 yrs
- 0.0%
- Est. flood insurance / yr
- $507 – $1,088
Fire risk 3/10 · Minor
- Est. fire insurance / yr
- $783 – $1,453
Heat risk 6/10 · Moderate
- Hot days now (above 104°F)
- 7 days/yr
- Hot days in 30 yrs
- 17 days/yr
Wind risk 2/10 · Minimal
- Chance of severe wind over 30 yrs
- 1.0%
Air-quality risk 4/10 · Minor
- Unhealthy air days now
- 4 days/yr
- Unhealthy air days in 30 yrs
- 5 days/yr
Risk factors via First Street. Map © Google.
Why this score? — see what drove the D- grade
The composite is a weighted blend of 9 inputs, each scored 0–100. Each bar is that input's sub-score; the figure is the points it added to the 100-point composite (weight × sub-score).
- Cash flow +11.9/30.0
- ARV discount +5.1/15.0
- Schools +4.1/10.0
- Condition / age +4.0/5.0
- DSCR +3.5/10.0
- 1% rule +3.4/10.0
- Livability +3.4/5.0
- Rent growth +2.5/5.0
- Appreciation +0.0/10.0
$204,990
🖨 Deal sheet 📄 Offer letter ✓ Due diligence
Listing remarks
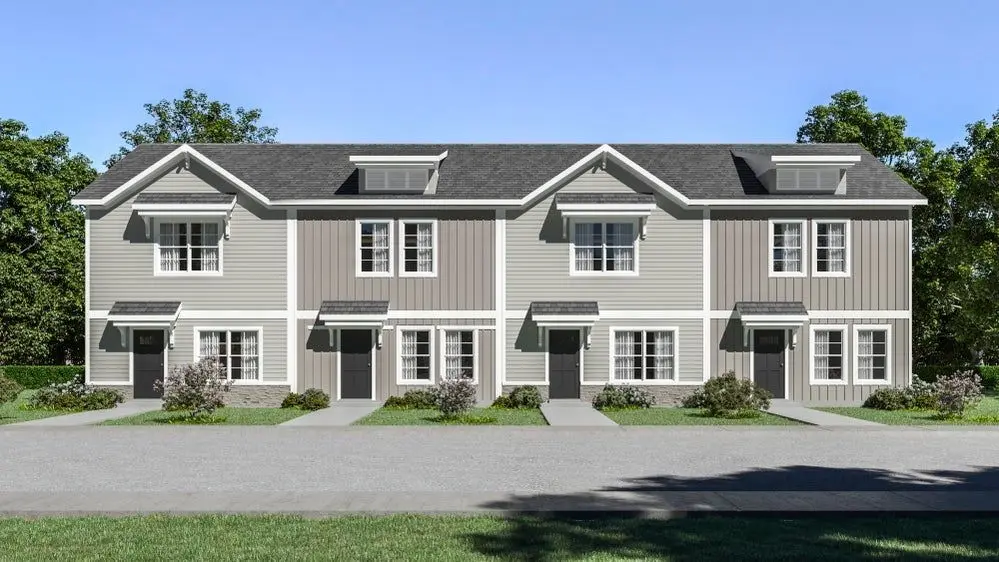
Exterior Home! The Aspen offers a beautifully designed living space that maximizes space while keeping everyday living comfortable. From the front entry, the foyer opens into an open kitchen, dining area, and great room, creating a main living space that feels open but connected. The kitchen includes an island and pantry storage, with clear sightlines into the dining and living areas. A rear patio extends the living space outdoors, while a conveniently placed powder room and storage closet completes the main level. This floor plan features 1,305 square feet, 3 bedrooms, and 2.5 bathrooms, with all bedrooms located on the second floor for added separation from the main living areas. Upstairs
Key facts
- Dining area
- Storage closet
- Powder room
Tags
Property features AI
Finance
- Financial info: List price $204,990
Exterior
- Home design: Condominium/townhome unit (unit #5); Active listing
- Construction: Built as part of the Aspen plan (new construction inventory type: Spec)
- Exterior features: Located at 114 Pacific Mill Pl #5, Lyman, SC 29365
Interior
- Bedrooms: 3 bedrooms
- Bathrooms: 2 full bathrooms and 1 half bathroom (2.5 total)
- Interior features: Spec home, Aspen plan; Living area approximately 1,305
Neighborhood map
What this means for you Summary
Snapshot
- This is a 3-bed/2.5-bath townhouse listed at $205k. Condition is rated good.
Deal economics
- At list price, monthly cash flow is $-53 ($-640/yr) — negative.
- To cash-flow at today's rent, offer at most $197k (3.8% below list).
- To meet the 1% rule (rent ≥ 1% of price), the offer needs to be $173k (15.8% below list).
- Recommended offer: $173k (15.8% below list) — sets the bar for 1% rule.
- Cap rate 6.0% vs local median 3.6% in Lyman — top-decile yield for the area; either an underpriced asset or a hidden risk that comps aren't pricing in. Stress-test before assuming the spread holds.
Location & tenants
- Location reads 68/100 on livability (#83 in SC) — a middle-class / working-renter tenant base. Strengths: cost of living A+, housing A+, crime A-; Watch: schools D+, amenities F, commute F.
- Spartanburg 05 (suburban): math 45% / reading 51% proficiency, ranked #13 of 80 in SC (top 16%) — families likely to look elsewhere, expect single-tenant / working-renter base with shorter leases.
- Market conditions: 220 active listings in the ZIP; 10 comparable units currently listed for rent nearby; rentals at typical pace (median 21d on market — plan ~3-4 weeks tenant-placement turnaround); solid renter incomes; 3,129 units permitted in Spartanburg County in 2024 (40 in 5+ unit buildings).
Forward outlook
- Local home prices are declining (-3.0%/yr); year-one equity from $1k of loan paydown is wiped out by about $6k of value loss. Plan a longer hold.
- Spartanburg County population projected at +18% by 2050 — long-run rental-demand tailwind backs the buy-and-hold thesis.
Negotiation context
- Only 2 days on market — expect competitive offers; lowballing is unlikely to land.
Risks & watch-outs
- Climate carrying-cost: extreme-heat days projected 7→17/yr by 2055 (HVAC capex compounding) — expect insurance premiums to compound above CPI over the hold.
Questions for the listing agent
- What do current leases actually rent for vs. the listed asking? Can we see a recent rent roll and the last 12 months of T-12 income?
- Is there a deadline driving the sale (1031 exchange, divorce, estate, relocation)? That informs how much negotiation room exists.
- Schools are D-rated, which usually means shorter tenancies and higher turnover. Who's the typical renter profile here, and what's been the actual vacancy rate?
- The area grade is low — what's the realistic commute time and amenity access for the typical tenant pool here? Any planned neighborhood developments (good or bad) we should know about?
- What's the average days-on-market for RENTAL listings here right now (not sales)? A rising rental-DOM trend means longer vacancies and softer asking-rent achievability than the comps imply.
- What's the recent tenant-quality profile in this submarket — average credit score on applications, eviction rate, late-payment / NSF rate, and stable-employment percentage? A property-management company in the area should have these aggregated.
- How much new for-sale + rental construction is in the pipeline within 1–3 miles? Heavy new supply typically softens prices + rents 12–24 months out; constrained supply supports both.
Investment metrics
- 1% rule
- 0.84% ✗
- Cap rate
- 5.98%
- Cash-on-cash
- -1.12%
- DSCR
- 0.95
- GRM
- 9.9
CMA / ARV
- ARV (on-the-fly)
- $194,445
- Comps found
- 12
Show comp detail 12 sales within ~0.75 mi
| Address | Dist | Beds/Ba | Sqft | Sold | Price | $/sf | Match |
|---|---|---|---|---|---|---|---|
| 817 Ernest Ln | 0.51mi | 3/2.5 | 1,276 (-2%) | 2mo | $189,900 | $149 | 71 |
| 845 Ernest Ln | 0.53mi | 3/2.5 | 1,276 (-2%) | 2mo | $189,900 | $149 | 70 |
| 857 Ernest Ln | 0.55mi | 3/2.5 | 1,276 (-2%) | 2mo | $187,900 | $147 | 69 |
| 865 Ernest Ln | 0.56mi | 3/2.5 | 1,276 (-2%) | 2mo | $199,900 | $157 | 68 |
| 819 Ernest Ln | 0.51mi | 3/2.5 | 1,480 (+13%) | 2mo | $199,900 | $135 | 52 |
| 855 Ernest Ln | 0.54mi | 3/2.5 | 1,480 (+13%) | 2mo | $214,900 | $145 | 51 |
| 847 Ernest Ln | 0.53mi | 3/2.5 | 1,480 (+13%) | 2mo | $224,900 | $152 | 51 |
| 827 Ernest Ln | 0.52mi | 3/2.5 | 1,480 (+13%) | 4mo | $227,900 | $154 | 51 |
| 867 Ernest Ln | 0.56mi | 3/2.5 | 1,480 (+13%) | 1mo | $214,900 | $145 | 50 |
| 863 Ernest Ln | 0.55mi | 3/2.5 | 1,480 (+13%) | 2mo | $224,900 | $152 | 50 |
| 851 Ernest Ln | 0.54mi | 3/2.5 | 1,480 (+13%) | 3mo | $203,500 | $138 | 50 |
| 859 Ernest Ln | 0.55mi | 3/2.5 | 1,480 (+13%) | 2mo | $222,400 | $150 | 50 |
Match score weights: distance 35% · size 25% · config 20% · recency 20%. Top-matched comps best support the ARV.
Projected returns pro-forma
-3.0% appreciation · 3.0% rent growth · sell at horizon
- IRR
- -18.1%
- Equity multiple
- 0.36×
- Total profit
- $-36,590
- Equity at exit
- $30,565
- IRR
- -10.3%
- Equity multiple
- 0.37×
- Total profit
- $-36,133
- Equity at exit
- $17,724
Cash invested: $57,397 (down + closing). Projections, not guarantees.
Landlord ↔ Tenant lean methodology
- Overall (STATE)
- 90 Strongly Landlord-Friendly
- State South Carolina
- 90 Strongly Landlord-Friendly · R+6
- County
- — inherits STATE
- City
- — inherits STATE
ZIP-level market 29365
- Home prices YoY
- -18.1%
- Active inventory
- 220
- Price-to-rent
- 9.9×
Monthly cashflow live
- Estimated rent
- $1,726 high interval (Pro) →
- Mortgage (P&I)
- −$1,075
- Tax est. 1.5%
- −$256 /mo · $3,075/yr
- Insurance
- −$85
- HOA
- −$0
- Vacancy / Maint / Mgmt
- −$362
- Net cashflow
- $-53
Break-even live
UW: 25.0% down · 7.5% · 30yr · 1.5% tax · 5.0% vac · 8.0% maint · 8.0% mgmt
Financing live
Cash to close
- Down payment
- $51,248
- Closing costs
- $6,150
- Reserves months
- —
- Total cash needed
- —
Loan-product check · same deal, 3 products live
Conventional
25% down · 7.5% · 30yr
- Down + closing
- —
- Monthly P&I
- —
- Monthly cashflow
- —
- DSCR
- —
- Eligible?
- —
Personal DTI + credit; lowest rate.
DSCR
20% down · 8.5% · 30yr
- Down + closing
- —
- Monthly P&I
- —
- Monthly cashflow
- —
- DSCR
- —
- Eligible?
- —
No personal income docs; deal must DSCR.
Hard money
10% down · 12.0% · 12mo
- Down + closing
- —
- Monthly P&I
- —
- Monthly cashflow
- —
- DSCR
- —
- Eligible?
- —
Short-term bridge; refi at stabilization.
Rent comps 10 comps
| Address | Beds | Baths | Sqft | Rent | $/sqft | DOM | Units | Dist |
|---|---|---|---|---|---|---|---|---|
| 855 Ernest Ln Lyman, SC | 3.0 | 2.5 | 1480 | $1,750 | $1.18 | 21d | 1 | 0.51mi |
| 867 Ernest Ln Lyman, SC | 3.0 | 2.5 | 1480 | $1,750 | $1.18 | 13d | 1 | 0.52mi |
| 867 Ernest Ln Lyman, SC | 3.0 | 2.5 | 1480 | $1,750 | $1.18 | 21d | 1 | 0.53mi |
| 610 Universal Dr Lyman, SC | 1.0–3.0 | 1.0–2.5 | 1060 | $1,799 | $1.70 | 13d | 11 | 1.02mi |
| 527 Nova Ln Duncan, SC | 3.0 | 2.5 | 1404 | $1,645 | $1.17 | 21d | 1 | 1.04mi |
| Paradise Pl Wellford, SC | 2.0–3.0 | 2.5 | 1135 | $1,595 | $1.41 | 21d | 2 | 1.32mi |
| Angelic Pl Wellford, SC | 3.0 | 2.5 | 1280 | $1,520 | $1.19 | 21d | 2 | 1.34mi |
| Halo Dr Wellford, SC | 2.0 | 1.5 | 995 | $1,295 | $1.30 | 13d | 1 | 1.35mi |
| 244 Halo Dr Wellford, SC | 2.0–3.0 | 2.5 | 1137 | $1,595 | $1.40 | 21d | 4 | 1.35mi |
| 266 Christopher Street Ext Duncan, SC | 3.0 | 2.5 | 1606 | $1,825 | $1.14 | 21d | 1 | 1.37mi |
Listing history 3 events
-
2026-06-18days on market $204,990 Active 2 DOM
-
2026-06-16remarks 699-char remark
-
2026-06-16$204,990 Active 1 DOM
ⓘ Source: listings_history table (triggers on properties + properties_extension) + one-shot
backfill from property_details.listing_events for pre-trigger history.
Climate risk First Street
- Flood 1/10 Low FEMA zone X (unshaded) · 0% chance over 30 yrs
- Wildfire 3/10 Moderate
- Heat 6/10 Major 7 d/yr ≥104°F today · 17 d/yr by 30 yrs out
- Wind 2/10 Low 100% chance of damaging wind over 30 yrs
- Air quality 4/10 Moderate 4 unhealthy d/yr today · 5 by 30 yrs out
Nearby sold comps map
Loading sold comps map…
Walkable amenities ~0.75 mi
Loading nearby amenities…
Taxation est. · year 1
- Rental income
- $20,708
- − Mortgage interest
- −$11,483
- − Property taxes
- −$3,075
- − Insurance
- −$1,025
- − Repairs & maintenance
- −$1,657
- − Management
- −$1,657
- − Depreciation
- −$5,963
- Taxable loss
- −$4,151
- Est. tax savings @ 24.0%
- +$996
- After-tax cash flow
- $356/yr
For passive investors: Depreciation is non-cash, so a rental often shows a tax loss while cash-flowing — sheltering income. Rental losses are passive: they offset passive income freely, and up to $25,000/yr can offset ordinary (W-2) income if you actively participate and your MAGI is under $100k (phasing out to $0 by $150k); unused losses carry forward. On sale, claimed depreciation is recaptured at up to 25%, and gains may owe capital-gains tax (a 1031 exchange can defer both). Figures are a year-1 estimate at your 24.0% rate — not tax advice; consult a CPA.
Condition & rehab AI · 12 photos
This townhouse is in excellent condition with a good condition score of 80. It is move-in ready with minimal updates needed to maximize its resale and rental value.
Value-add opportunities
- Both Painting exterior and interior walls — Fresh paint enhances curb appeal and interior aesthetics
- Both Landscaping improvements — Enhances curb appeal and adds value
- Both New flooring in bathrooms — Modernizes bathrooms and improves aesthetics
- Both New kitchen appliances — Modernizes kitchen and improves functionality
Renovation cost estimate screening
Value-add ROI direction
- Both Painting exterior and interior walls — Fresh paint enhances curb appeal and interior aesthetics ↑
- Both Landscaping improvements — Enhances curb appeal and adds value ↑
- Both New flooring in bathrooms — Modernizes bathrooms and improves aesthetics ↑
- Both New kitchen appliances — Modernizes kitchen and improves functionality ↑
ⓘ Cost ranges are severity-bucket heuristics (US national rule-of-thumb). Get contractor quotes + a written scope before underwriting a rehab budget.
Schools (NCES district)
- District
- Spartanburg 05
- NCES district ID
- 4503600
- Math proficiency
- 45% ▼ -11.00%
- Reading proficiency
- 51% ▬ 0.00%
- Median HH income
- $52,127
- Composite
- 41.31/100
- National rank
- #3512
- State rank
- #13 of 80 in SC
Livability — Lyman
- Score
- 68/100
- State rank
- #83
- US rank
- #9705
Category grades
Schools grade is shown separately in the Schools card above.
Census & demographics
- Census place
- Lyman, SC
- County
- Spartanburg County · 258,607 people
- City population
- 14,068
- Metro
- Spartanburg, SC
- Population (ZIP)
- 14,068
- Household income
- $76,966
- Rent vs Own
- Severe rent burden
- 234.0
Population outlook (Spartanburg County) Hauer SSP2
- Today (2025)
- 325,495 people
- By 2030
- 338,800 · +4.1%
- By 2040
- 363,471 · +11.7%
- By 2050
- 384,156 · +18.0%
- By 2075
- 430,137 · +32.1%
- By 2100
- 442,733 · +36.0%
Race, ethnicity, and origin ACS 2023
- Neighborhood character
- Predominantly White (74%)
- Race & ethnicity
- White 74% Black 11% Two or more races 10% Hispanic / Latino 9% Asian 2%
- Hispanic origin (detail)
- Mexican 6% Puerto Rican 2%
- Common ancestry
- Scotch-Irish 5% Serbian 4% Slovak 2%
- Foreign-born
- 9% · Canada, Philippines, Jamaica
- Languages at home
- 83% English-only · Russian/Polish/Slavic 8% Spanish 7% Other Asian/Pacific 1%
Political lean MEDSL · Spartanburg
- 2024 margin
- Solid R (+33.6) · D 32.6% · R 66.2% · Other 1.2%
- 2008→2024 swing
- -12.0pp toward R · 2008: -21.6pp · 2024: -33.6pp
- All cycles
- 2024: R+33.6 2020: R+27.3 2016: R+30.0 2012: R+23.1 2008: R+21.6
Not yet ingested
- Civics
- —
Market trends
- HPI YoY
- ▼ -56.35%
- Current HPI
- 254.6167
- Rent YoY
- —
- Metro
- Spartanburg, SC
- State GDP YoY
- ▲ 4.51%
- F500 in state
- 2
Industry mix (Fortune 500 HQ in SC)
| Industry | F500 HQs | Revenue |
|---|---|---|
| Packaging | 1 | $7B |
|
||
Cash-flow waterfall
monthlySold comps — $/sqft
last 12 mo · ≤1 miLoading sold comps…