 Multi-family
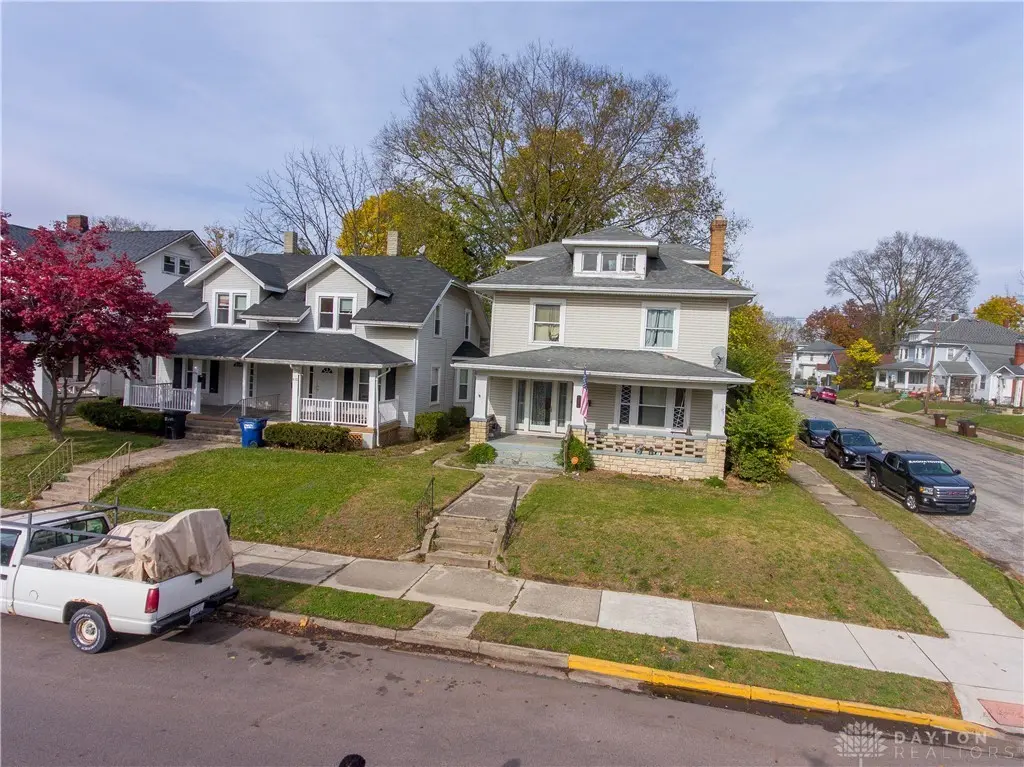
412 E Madison Ave · Springfield, OH
Flood risk 1/10 · Minimal
- FEMA flood zone
- X (unshaded)
- Chance of flooding over 30 yrs
- 0.0%
- Est. flood insurance / yr
- $473 – $860
Fire risk 1/10 · Minimal
- Est. fire insurance / yr
- $713 – $1,323
Heat risk 3/10 · Minor
- Hot days now (above 100°F)
- 7 days/yr
- Hot days in 30 yrs
- 18 days/yr
Wind risk 2/10 · Minimal
- Chance of severe wind over 30 yrs
- —
Air-quality risk 3/10 · Minor
- Unhealthy air days now
- 2 days/yr
- Unhealthy air days in 30 yrs
- 3 days/yr
Risk factors via First Street. Map © Google.
Why this score? — see what drove the D+ grade
The composite is a weighted blend of 9 inputs, each scored 0–100. Each bar is that input's sub-score; the figure is the points it added to the 100-point composite (weight × sub-score).
- Cash flow +25.1/30.0
- DSCR +8.2/10.0
- 1% rule +6.4/10.0
- Livability +2.8/5.0
- Rent growth +2.5/5.0
- Condition / age +2.5/5.0
- Schools +1.9/10.0
- ARV discount +0.0/15.0
- Appreciation +0.0/10.0
$155,000
🖨 Deal sheet 📄 Offer letter ✓ Due diligence
Multi-family units
County records classify this as Multi-Family (2-4 Unit). Listing-text estimate: 1 unit. estimate disagrees with records
Listing remarks MLS
Come home to this spacious single family home as you walk through to a grand entry way that opens to the family room and kitchen. This home has 2 full baths, 4 spacious bedrooms also a 29 x 25 unfinished basement newer Kitchen, new flooring, and many other updates, completely fenced in yard, newly stained deck Gas fireplace sellers never used it - is not warranted 2026 roof
Key facts
- Newer kitchen
- Newly stained deck
- New flooring
Tags
Neighborhood map
What this means for you Summary
Snapshot
- This is a 4-bed/2.0-bath multifamily listed at $155k.
Deal economics
- At list price, monthly cash flow is $342 ($4k/yr) — positive.
- The deal already cash-flows at list — no discount required.
- Meets the 1% rule at list price ($2k rent vs $155k).
- Recommended offer: $136k (12.0% below list) — sets the bar for market timing.
- Cap rate 8.9% vs local median 4.8% in Springfield — top-decile yield for the area; either an underpriced asset or a hidden risk that comps aren't pricing in. Stress-test before assuming the spread holds.
Location & tenants
- Location reads 56/100 on livability (#1,108 in OH) — a working-class tenant base; expect higher turnover. Strengths: cost of living A+, housing A+; Watch: crime F, amenities F, commute F.
- Springfield City School District (urban): math 20% / reading 27% proficiency, ranked #616 of 656 in OH (top 94%) — low school quality limits family demand, transient renter base, plan for 1-2y turnover; 75% free/reduced lunch — lower-income household profile, screen leases tightly.
- Market conditions: 142 active listings in the ZIP; 7 comparable units currently listed for rent nearby; rentals leasing fast (median 11d on market — plan ~1-2 weeks tenant-placement turnaround); 232 units permitted in Clark County in 2024 (116 in 5+ unit buildings).
- This rent runs 39% of the median local income ($55k/yr) — at the standard rent-burdened threshold; future hikes will face affordability resistance.
Forward outlook
- Local home prices are declining (-3.0%/yr); year-one equity from $1k of loan paydown is wiped out by about $5k of value loss. Plan a longer hold.
- Clark County population projected at -16% by 2050 — secular population decline; favor cash flow + early exit over multi-decade hold.
Negotiation context
- It's been on market 220 days — a 12% lower offer ($136k) is reasonable based on typical stale-listing flexibility.
- 2 sale attempts since 13y ago; this cycle's ask has dropped $20k (11%) from the opening price — seller is motivated, your offer sets the floor, not the list.
- Current owner paid $85k; list at $155k implies a 82% gain — meaningful room to come down on a strong offer.
Risks & watch-outs
- Watch-outs: built in 1912 — expect roof / HVAC / electrical / plumbing capex.
Questions for the listing agent
- It's been on market 220 days. Have you received any prior offers? Is the seller open to a 12% concession, seller financing, or rate buy-down credit?
- Built in 1912 — when were the roof, HVAC, electrical panel, plumbing, and water heater last replaced?
- Why hasn't it sold? Are there any deal-killer items the seller is aware of (foundation, flood, title, zoning, code violations)?
- Is there a deadline driving the sale (1031 exchange, divorce, estate, relocation)? That informs how much negotiation room exists.
- Crime grade is F in this area — have there been break-ins, vandalism, or insurance claims at this property in the last 3 years? What carrier currently insures it and at what premium?
- The area grade is low — what's the realistic commute time and amenity access for the typical tenant pool here? Any planned neighborhood developments (good or bad) we should know about?
- What's the average days-on-market for RENTAL listings here right now (not sales)? A rising rental-DOM trend means longer vacancies and softer asking-rent achievability than the comps imply.
- What's the recent tenant-quality profile in this submarket — average credit score on applications, eviction rate, late-payment / NSF rate, and stable-employment percentage? A property-management company in the area should have these aggregated.
- How much new apartment / multifamily construction is in the pipeline within 1–3 miles? Heavy new supply (>2% of stock underway) typically softens rents 12–24 months out; light construction supports rent growth.
Investment metrics
- 1% rule
- 1.14% ✓
- Cap rate
- 8.94%
- Cash-on-cash
- 9.45%
- DSCR
- 1.42
- GRM
- 7.3
CMA / ARV
- ARV (median comp)
- $130,484
- List price
- $155,000
- Delta
- 18.79%
- Verdict
- OVERPRICED
- Comps
- 20 within 1.0 mi
Show comp detail 7 sales within ~0.75 mi
| Address | Dist | Beds/Ba | Sqft | Sold | Price | $/sf | Match |
|---|---|---|---|---|---|---|---|
| 913-915 Mitchell Blvd | 0.56mi | 4/2.0 | 1,728 (-4%) | 0mo | $172,000 | $100 | 67 |
| 876 E Mccreight Ave | 0.53mi | 4/2.0 | 1,728 (-4%) | 2mo | $130,000 | $75 | 67 |
| 1309-1311 W Cedarview Dr | 0.58mi | 4/2.0 | 1,728 (-4%) | 14mo | $166,000 | $96 | 54 |
| 1330-1332 E Cedarview Dr | 0.65mi | 4/2.0 | 1,728 (-4%) | 21mo | $152,000 | $88 | 46 |
| 1340-1342 E Cedarview Dr | 0.66mi | 4/2.0 | 1,728 (-4%) | 21mo | $162,000 | $94 | 45 |
| 1223 Cedarview Dr | 0.55mi | 4/— | 1,944 (+8%) | 23mo | $156,000 | $80 | 42 |
| 1674 Brentwood Dr | 0.74mi | 4/2.0 | 1,552 (-14%) | 22mo | $155,000 | $100 | 24 |
Match score weights: distance 35% · size 25% · config 20% · recency 20%. Top-matched comps best support the ARV.
Projected returns pro-forma
-3.0% appreciation · 3.0% rent growth · sell at horizon
- IRR
- -2.0%
- Equity multiple
- 0.92×
- Total profit
- $-3,318
- Equity at exit
- $23,111
- IRR
- 7.7%
- Equity multiple
- 1.58×
- Total profit
- $25,233
- Equity at exit
- $13,402
Cash invested: $43,400 (down + closing). Projections, not guarantees.
Landlord ↔ Tenant lean methodology
- Overall (STATE)
- 73 Landlord-Friendly
- State Ohio
- 73 Landlord-Friendly · R+6
- County
- — inherits STATE
- City
- — inherits STATE
ZIP-level market 45503
- Active inventory
- 142
- Price-to-rent
- 7.3×
Monthly cashflow live
- Estimated rent
- $1,774 high interval (Pro) →
- Mortgage (P&I)
- −$813
- Tax from tax record
- −$182 /mo · $2,183/yr
- Insurance
- −$65
- HOA
- −$0
- Vacancy / Maint / Mgmt
- −$372
- Net cashflow
- $342
Break-even live
UW: 25.0% down · 7.5% · 30yr · 1.5% tax · 5.0% vac · 8.0% maint · 8.0% mgmt
Financing live
Cash to close
- Down payment
- $38,750
- Closing costs
- $4,650
- Reserves months
- —
- Total cash needed
- —
Loan-product check · same deal, 3 products live
Conventional
25% down · 7.5% · 30yr
- Down + closing
- —
- Monthly P&I
- —
- Monthly cashflow
- —
- DSCR
- —
- Eligible?
- —
Personal DTI + credit; lowest rate.
DSCR
20% down · 8.5% · 30yr
- Down + closing
- —
- Monthly P&I
- —
- Monthly cashflow
- —
- DSCR
- —
- Eligible?
- —
No personal income docs; deal must DSCR.
Hard money
10% down · 12.0% · 12mo
- Down + closing
- —
- Monthly P&I
- —
- Monthly cashflow
- —
- DSCR
- —
- Eligible?
- —
Short-term bridge; refi at stabilization.
Rent comps 7 comps
| Address | Beds | Baths | Sqft | Rent | $/sqft | DOM | Units | Dist |
|---|---|---|---|---|---|---|---|---|
| 401 Section St Springfield, OH | 4.0 | 2.0 | 1612 | $1,850 | $1.15 | 11d | 1 | 0.72mi |
| 306 S Plum St Springfield, OH | 4.0 | 2.0 | 1352 | $1,700 | $1.26 | 44d | 1 | 1.22mi |
| 220 S Yellow Springs St Springfield, OH | 4.0 | 2.0 | 1456 | $1,645 | $1.13 | 23d | 1 | 1.25mi |
| 302 S Yellow Springs St Springfield, OH | 4.0 | 2.0 | 1456 | $1,845 | $1.27 | 11d | 1 | 1.29mi |
| 356 S Yellow Springs St Springfield, OH | 4.0 | 2.0 | 1606 | $1,825 | $1.14 | 11d | 1 | 1.35mi |
| 523 W Mulberry St Springfield, OH | 4.0 | 2.0 | 1456 | $1,825 | $1.25 | 11d | 1 | 1.38mi |
| 524 W Pleasant St Springfield, OH | 4.0 | 2.0 | 1456 | $1,645 | $1.13 | 11d | 1 | 1.40mi |
Listing history 24 events
-
2026-06-19statusdays on market $155,000 Active 220 DOM
-
2026-06-18days on market $155,000 ActiveUnderContract 219 DOM
-
2026-06-17days on market $155,000 ActiveUnderContract 218 DOM
-
2026-06-16days on market $155,000 ActiveUnderContract 217 DOM
-
2026-06-16status $155,000 ActiveUnderContract 216 DOM
-
2026-06-15days on market $155,000 Active 216 DOM
-
2026-06-14days on market $155,000 Active 214 DOM
-
2026-06-12days on market $155,000 Active 213 DOM
-
2026-06-09pricedays on market $155,000 Active 210 DOM
-
2026-06-08days on market $163,000 Active 209 DOM
-
2026-06-07days on market $163,000 Active 208 DOM
-
2026-06-05days on market $163,000 Active 205 DOM
-
2026-06-02days on market $163,000 Active 203 DOM
-
2026-06-01days on market $163,000 Active 202 DOM
-
2026-05-31days on market $163,000 Active 201 DOM
-
2026-05-30days on market $163,000 Active 200 DOM
-
2026-05-13price $163,000 379-char remark
Show marketing remark (379 chars)
Come home to this spacious single family home as you walk through to a grand entry way that opens to the family room and kitchen. This home has 2 full baths, 4 spacious bedrooms also a 29 x 25 unfinished basement newer Kitchen, new flooring, and many other updates, completely fenced in yard, newly stained deck Gas fireplace sellers never used it - is not warranted 2026 roof
-
2026-03-02price $168,000 379-char remark
Show marketing remark (379 chars)
Come home to this spacious single family home as you walk through to a grand entry way that opens to the family room and kitchen. This home has 2 full baths, 4 spacious bedrooms also a 29 x 25 unfinished basement newer Kitchen, new flooring, and many other updates, completely fenced in yard, newly stained deck Gas fireplace sellers never used it - is not warranted 2026 roof
-
2026-01-15price $173,000 379-char remark
Show marketing remark (379 chars)
Come home to this spacious single family home as you walk through to a grand entry way that opens to the family room and kitchen. This home has 2 full baths, 4 spacious bedrooms also a 29 x 25 unfinished basement newer Kitchen, new flooring, and many other updates, completely fenced in yard, newly stained deck Gas fireplace sellers never used it - is not warranted 2026 roof
-
2025-11-11$175,000 Active 379-char remark
Show marketing remark (379 chars)
Come home to this spacious single family home as you walk through to a grand entry way that opens to the family room and kitchen. This home has 2 full baths, 4 spacious bedrooms also a 29 x 25 unfinished basement newer Kitchen, new flooring, and many other updates, completely fenced in yard, newly stained deck Gas fireplace sellers never used it - is not warranted 2026 roof
-
2016-03-01soldstatus $85,000
-
2013-09-27soldstatus $28,000 539-char remark
Show marketing remark (539 chars)
Could be 5 bedrooms. Asset#1048148. Freddie Mac First Look Initiative and ONLY Owner Occupant or NSP offers accepted through 07 - 29 - 2013; then open to all offers. Buyer needs APPROVAL LETTER OR PROOF OF FUNDS WITH OFFER. Agent, see Broker Remarks for necessary forms to submit with offer. Seller's Title Company or Link-Hellmuth to hold earnest money in a certified or cashier check; NO CASH or money order. OCCUPANCY AND KEYS AFTER FUNDING (after seller signs all documents and notifies listing agent). Addenda signed after acceptance.
-
2013-07-11$29,900 539-char remark
Show marketing remark (539 chars)
Could be 5 bedrooms. Asset#1048148. Freddie Mac First Look Initiative and ONLY Owner Occupant or NSP offers accepted through 07 - 29 - 2013; then open to all offers. Buyer needs APPROVAL LETTER OR PROOF OF FUNDS WITH OFFER. Agent, see Broker Remarks for necessary forms to submit with offer. Seller's Title Company or Link-Hellmuth to hold earnest money in a certified or cashier check; NO CASH or money order. OCCUPANCY AND KEYS AFTER FUNDING (after seller signs all documents and notifies listing agent). Addenda signed after acceptance.
-
1997-03-19soldstatus $62,500
ⓘ Source: listings_history table (triggers on properties + properties_extension) + one-shot
backfill from property_details.listing_events for pre-trigger history.
Tax reassessment forecast OH · Partial reset (capped growth)
- Current annual tax
- $2,183 · $182/mo
- Projected year-2 tax
- $2,301 · $192/mo
- Expected delta
- +$117/yr (+$10/mo · 5.4%)
ⓘ Screening estimate from a state-policy table — verify with the county assessor before closing.
Climate risk First Street
- Flood 1/10 Low FEMA zone X (unshaded) · 0% chance over 30 yrs
- Wildfire 1/10 Low
- Heat 3/10 Moderate 7 d/yr ≥100°F today · 18 d/yr by 30 yrs out
- Wind 2/10 Low
- Air quality 3/10 Moderate 2 unhealthy d/yr today · 3 by 30 yrs out
Nearby sold comps map
Loading sold comps map…
Walkable amenities ~0.75 mi
Loading nearby amenities…
Taxation est. · year 1
- Rental income
- $21,285
- − Mortgage interest
- −$8,682
- − Property taxes
- −$2,183
- − Insurance
- −$775
- − Repairs & maintenance
- −$1,703
- − Management
- −$1,703
- − Depreciation
- −$4,509
- Taxable income
- $1,730
- Est. tax owed @ 24.0%
- −$415
- After-tax cash flow
- $3,688/yr
For passive investors: Depreciation is non-cash, so a rental often shows a tax loss while cash-flowing — sheltering income. Rental losses are passive: they offset passive income freely, and up to $25,000/yr can offset ordinary (W-2) income if you actively participate and your MAGI is under $100k (phasing out to $0 by $150k); unused losses carry forward. On sale, claimed depreciation is recaptured at up to 25%, and gains may owe capital-gains tax (a 1031 exchange can defer both). Figures are a year-1 estimate at your 24.0% rate — not tax advice; consult a CPA.
Schools (NCES district)
- District
- Springfield City School District
- NCES district ID
- 3904481
- Math proficiency
- 20% ▼ -16.00%
- Reading proficiency
- 27% ▼ -12.00%
- Median HH income
- $32,541
- Composite
- 19.12/100
- National rank
- #8834
- State rank
- #616 of 656 in OH
Livability — Springfield
- Score
- 56/100
- State rank
- #1108
- US rank
- #22551
Category grades
Schools grade is shown separately in the Schools card above.
Census & demographics
- Census place
- Springfield, OH
- County
- Clark · 134,280 people
- City population
- 33,261
- Metro
- Springfield, OH
- Population (ZIP)
- 32,673
- Household income
- $54,561
- Rent vs Own
- Severe rent burden
- 4.7
Population outlook (Clark County) Hauer SSP2
- Today (2025)
- 130,703 people
- By 2030
- 126,952 · -2.9%
- By 2040
- 118,344 · -9.5%
- By 2050
- 109,590 · -16.2%
- By 2075
- 89,464 · -31.6%
- By 2100
- 68,810 · -47.4%
Race, ethnicity, and origin ACS 2023
- Neighborhood character
- Predominantly White (84%)
- Race & ethnicity
- White 84% Black 9% Two or more races 5% Hispanic / Latino 2%
- Common ancestry
- Italian 2% Lithuanian 1% Slovak 1%
- Foreign-born
- 2% · Canada
- Languages at home
- 98% English-only · French/Haitian/Cajun 1% Spanish 1%
Political lean MEDSL · Clark
- 2024 margin
- Strong R (+29.5) · D 34.8% · R 64.3%
- 2008→2024 swing
- -27.0pp toward R · 2008: -2.5pp · 2024: -29.5pp
- All cycles
- 2024: R+29.5 2020: R+23.3 2016: R+19.5 2012: R+1.8 2008: R+2.5
Not yet ingested
- Civics
- —
Market trends
- HPI YoY
- ▼ -211.92%
- Current HPI
- 257.5694
- Rent YoY
- —
- Metro
- —
- State GDP YoY
- ▲ 1.98%
- F500 in state
- 48
Industry mix (Fortune 500 HQ in OH)
| Industry | F500 HQs | Revenue |
|---|---|---|
| Insurance | 3 | $145B |
|
||
| Industrial Machinery | 3 | $49B |
|
||
| Financial Services | 3 | $24B |
|
||
| Consumer Goods | 2 | $93B |
|
||
| Aerospace / Defense | 2 | $47B |
|
||
| Utilities | 2 | $33B |
|
||
Price history
+160.8% since first listed8 events — show timeline
- 2026-05-13 Price Changed $163,000 Dayton MLS
- 2026-03-02 Price Changed $168,000 Dayton MLS
- 2026-01-15 Price Changed $173,000 Dayton MLS
- 2025-11-11 Listed $175,000 Dayton MLS
- 2016-03-01 Sold (Public Records) $85,000 Public Records
- 2013-09-27 Sold (MLS) $28,000 WRIST
- 2013-07-11 Listed $29,900 WRIST
- 1997-03-19 Sold (Public Records) $62,500 Public Records
Property tax history
+4.3%/yrLatest (2025): $2,183 · +14.7% YoY. Source: county tax records.
Cash-flow waterfall
monthlySold comps — $/sqft
last 12 mo · ≤1 miLoading sold comps…