79 Sunset Loop · Cascade, ID
Flood risk 1/10 · Minimal
- FEMA flood zone
- X (unshaded)
- Chance of flooding over 30 yrs
- 0.0%
- Est. flood insurance / yr
- $507 – $1,088
Fire risk 9/10 · Severe
- Est. fire insurance / yr
- $584 – $1,086
Heat risk 2/10 · Minimal
- Hot days now (above 89°F)
- 8 days/yr
- Hot days in 30 yrs
- 19 days/yr
Wind risk 1/10 · Minimal
- Chance of severe wind over 30 yrs
- —
Air-quality risk 7/10 · Major
- Unhealthy air days now
- 10 days/yr
- Unhealthy air days in 30 yrs
- 17 days/yr
Risk factors via First Street. Map © Google.
Why this score? — see what drove the F grade
The composite is a weighted blend of 9 inputs, each scored 0–100. Each bar is that input's sub-score; the figure is the points it added to the 100-point composite (weight × sub-score).
- Cash flow +8.0/30.0
- ARV discount +7.5/15.0
- Schools +3.7/10.0
- Livability +3.3/5.0
- Rent growth +2.5/5.0
- Condition / age +2.5/5.0
- 1% rule +2.4/10.0
- DSCR +2.0/10.0
- Appreciation +0.0/10.0
$525,000
🖨 Deal sheet 📄 Offer letter ✓ Due diligence
Listing remarks
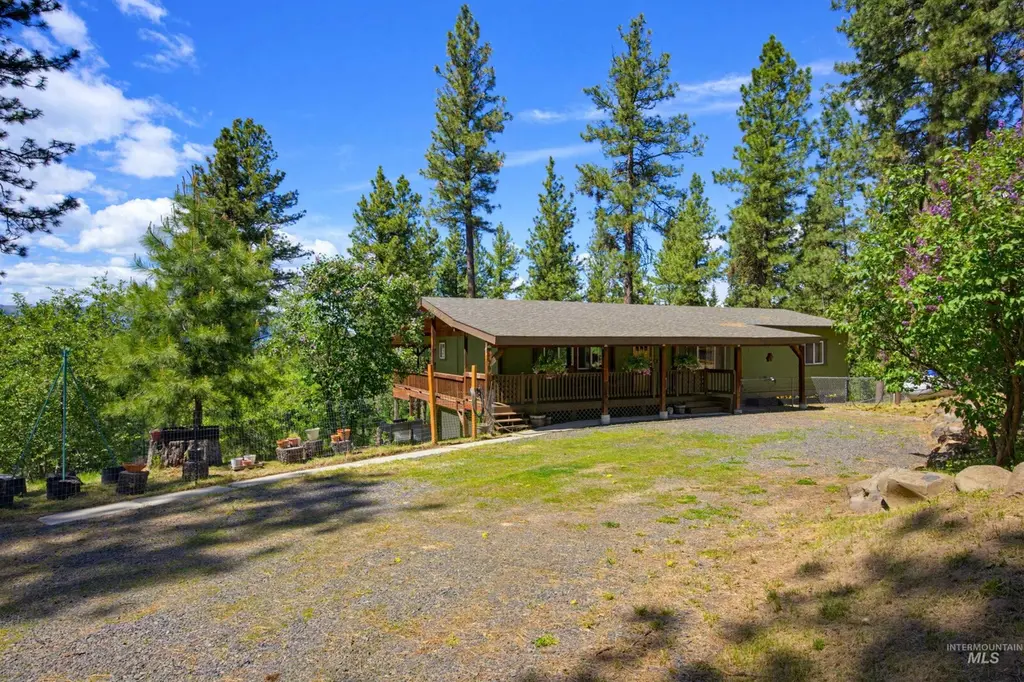
Welcome to your cozy cabin in the woods! 79 Sunset Loop is nestled in the trees with just a short walk down to the lake. This fully remodeled home offers an abundance of space and boasts four bedrooms and three full baths, creating a welcoming ambiance. With a walk-out daylight basement, this gorgeous place is adorned with exquisite wood, stone, and tile finishes, complemented by new appliances and refined lighting. A series of wrap-around covered decks embrace the residence and make the perfect spot for enjoying your morning coffee and while taking in the beautiful mountain views. The road is maintained and plowed by the county for year round access. Brand new central air has been installe
Key facts
- Outdoor recreation
- New exterior paint
- Central air
Tags
Property features AI
Finance
- Other: Property currently used as single family and recreational; Public road frontage
- HOA & community: Located in the Crown Point subdivision
Exterior
- Parking: Attached 2-car garage; RV access/parking; Two covered parking spaces
- Utilities: Private well water; Septic tank sewer
- Home design: Single-family home with acreage; Separate living quarters on the property; Built in 1978
- Construction: Concrete and frame construction with wood siding; Metal roof; Separate living quarters structure
- Exterior features: Partial metal fencing; Covered patio/deck; Views; Dog run; Garden; Suitable for horses; Chickens; Rolling and steep slopes; Wooded areas; Winter access
Interior
- Kitchen: Granite and marble counters; Pantry; Breakfast bar; Dishwasher; Disposal; Microwave; Freestanding oven/range; Refrigerator; Gas range
- Bedrooms: Four bedrooms total — three on the main level, one on the lower level
- Flooring: Laminate flooring
- Bathrooms: Three bathrooms total
- Heating & cooling: Forced air heating; Propane and wood heating options; Central air conditioning; Other heating sources
- Interior features: Primary bedroom with en-suite bath; Guest room; Den/office; Family room; Great room; Recreation/bonus room; Double vanity; Walk-in closet(s); Breakfast bar; Pantry; Granite counters; Marble counters; Two fireplaces (pellet stove and wood burning stove)
- Laundry & utility: Electric water heater; Utility room located on the lower level
Neighborhood map
What this means for you Summary
Snapshot
- This is a 4-bed/3.0-bath manufactured listed at $525k.
Deal economics
- At list price, monthly cash flow is $-545 ($-7k/yr) — negative.
- To cash-flow at today's rent, offer at most $446k (15.0% below list).
- To meet the 1% rule (rent ≥ 1% of price), the offer needs to be $390k (25.7% below list).
- Recommended offer: $390k (25.7% below list) — sets the bar for 1% rule.
- Cap rate 5.0% vs local median 3.6% in Cascade — top-decile yield for the area; either an underpriced asset or a hidden risk that comps aren't pricing in. Stress-test before assuming the spread holds.
Location & tenants
- Location reads 66/100 on livability (#116 in ID) — a middle-class / working-renter tenant base. Strengths: housing A+, cost of living A, crime A-; Watch: employment C-, amenities F, commute F.
- Cascade District (rural): math 35% / reading 45% proficiency, ranked #94 of 133 in ID (top 71%) — families likely to look elsewhere, expect single-tenant / working-renter base with shorter leases.
- Zoned schools: Cascade Elementary School (math 54% / reading 44%, grade D, #148 of 357 statewide, top 47%, 119 students, 33% FRL); Cascade Jr/Sr High School (math 54% / reading 74%, grade B-, #10 of 169 statewide, top 7%, 87 students, 15% FRL).
- Zoned-school proficiency averages 57% at this address vs 40% district-wide (+17 pts) — the actual schools serving this property are materially stronger than the Cascade District average implies; a family-tenant draw the district grade alone would hide.
- Market conditions: 406 active listings in the ZIP; 250 units permitted in Valley County in 2024 (0 in 5+ unit buildings).
Forward outlook
- Local home prices are declining (-3.0%/yr); year-one equity from $4k of loan paydown is wiped out by about $16k of value loss. Plan a longer hold.
- Valley County population projected at +7% by 2050 — modest demand growth; plan on rents tracking national, not racing it.
Negotiation context
- Only 7 days on market — expect competitive offers; lowballing is unlikely to land.
- 12 sale attempts since 8y ago with the ask held roughly flat each time — persistent listings suggest the price (not the market) is what's stuck; bring a comps-based counter.
Risks & watch-outs
- Climate carrying-cost: severe wildfire risk — expect insurance premiums to compound above CPI over the hold.
Questions for the listing agent
- What do current leases actually rent for vs. the listed asking? Can we see a recent rent roll and the last 12 months of T-12 income?
- Built in 1978 — when were the roof, HVAC, electrical panel, plumbing, and water heater last replaced?
- Is there a deadline driving the sale (1031 exchange, divorce, estate, relocation)? That informs how much negotiation room exists.
- Schools are D-rated, which usually means shorter tenancies and higher turnover. Who's the typical renter profile here, and what's been the actual vacancy rate?
- The area grade is low — what's the realistic commute time and amenity access for the typical tenant pool here? Any planned neighborhood developments (good or bad) we should know about?
- What's the average days-on-market for RENTAL listings here right now (not sales)? A rising rental-DOM trend means longer vacancies and softer asking-rent achievability than the comps imply.
- What's the recent tenant-quality profile in this submarket — average credit score on applications, eviction rate, late-payment / NSF rate, and stable-employment percentage? A property-management company in the area should have these aggregated.
- How much new for-sale + rental construction is in the pipeline within 1–3 miles? Heavy new supply typically softens prices + rents 12–24 months out; constrained supply supports both.
Investment metrics
- 1% rule
- 0.74% ✗
- Cap rate
- 5.05%
- Cash-on-cash
- -4.45%
- DSCR
- 0.80
- GRM
- 11.2
CMA / ARV
No comps found within radius.
Projected returns pro-forma
-3.0% appreciation · 3.0% rent growth · sell at horizon
- IRR
- -23.8%
- Equity multiple
- 0.19×
- Total profit
- $-119,731
- Equity at exit
- $78,279
- IRR
- -18.8%
- Equity multiple
- -0.01×
- Total profit
- $-148,724
- Equity at exit
- $45,392
Cash invested: $147,000 (down + closing). Projections, not guarantees.
Landlord ↔ Tenant lean methodology
- Overall (STATE)
- 91 Strongly Landlord-Friendly
- State Idaho
- 91 Strongly Landlord-Friendly · R+18
- County
- — inherits STATE
- City
- — inherits STATE
ZIP-level market 83611
- Home prices YoY
- -27.9%
- Active inventory
- 406
- Price-to-rent
- 11.2×
Monthly cashflow live
- Estimated rent
- $3,903 medium interval (Pro) →
- Mortgage (P&I)
- −$2,753
- Tax est. 1.5%
- −$656 /mo · $7,875/yr
- Insurance
- −$219
- HOA
- −$0
- Vacancy / Maint / Mgmt
- −$820
- Net cashflow
- $-545
Break-even live
UW: 25.0% down · 7.5% · 30yr · 1.5% tax · 5.0% vac · 8.0% maint · 8.0% mgmt
Financing live
Cash to close
- Down payment
- $131,250
- Closing costs
- $15,750
- Reserves months
- —
- Total cash needed
- —
Loan-product check · same deal, 3 products live
Conventional
25% down · 7.5% · 30yr
- Down + closing
- —
- Monthly P&I
- —
- Monthly cashflow
- —
- DSCR
- —
- Eligible?
- —
Personal DTI + credit; lowest rate.
DSCR
20% down · 8.5% · 30yr
- Down + closing
- —
- Monthly P&I
- —
- Monthly cashflow
- —
- DSCR
- —
- Eligible?
- —
No personal income docs; deal must DSCR.
Hard money
10% down · 12.0% · 12mo
- Down + closing
- —
- Monthly P&I
- —
- Monthly cashflow
- —
- DSCR
- —
- Eligible?
- —
Short-term bridge; refi at stabilization.
Listing history 6 events
-
2026-06-09status $525,000 Pending 7 DOM
-
2026-06-08days on market $525,000 Active 7 DOM
-
2026-06-07days on market $525,000 Active 6 DOM
-
2026-06-04days on market $525,000 Active 2 DOM
-
2026-06-01remarks 699-char remark
-
2026-06-01$525,000 Active 1 DOM
ⓘ Source: listings_history table (triggers on properties + properties_extension) + one-shot
backfill from property_details.listing_events for pre-trigger history.
Climate risk First Street
- Flood 1/10 Low FEMA zone X (unshaded) · 0% chance over 30 yrs
- Wildfire 9/10 Extreme
- Heat 2/10 Low 8 d/yr ≥89°F today · 19 d/yr by 30 yrs out
- Wind 1/10 Low
- Air quality 7/10 Severe 10 unhealthy d/yr today · 17 by 30 yrs out
Nearby sold comps map
Loading sold comps map…
Walkable amenities ~0.75 mi
Loading nearby amenities…
Taxation est. · year 1
- Rental income
- $46,831
- − Mortgage interest
- −$29,408
- − Property taxes
- −$7,875
- − Insurance
- −$2,625
- − Repairs & maintenance
- −$3,747
- − Management
- −$3,747
- − Depreciation
- −$15,273
- Taxable loss
- −$15,842
- Est. tax savings @ 24.0%
- +$3,802
- After-tax cash flow
- $-2,739/yr
For passive investors: Depreciation is non-cash, so a rental often shows a tax loss while cash-flowing — sheltering income. Rental losses are passive: they offset passive income freely, and up to $25,000/yr can offset ordinary (W-2) income if you actively participate and your MAGI is under $100k (phasing out to $0 by $150k); unused losses carry forward. On sale, claimed depreciation is recaptured at up to 25%, and gains may owe capital-gains tax (a 1031 exchange can defer both). Figures are a year-1 estimate at your 24.0% rate — not tax advice; consult a CPA.
Schools (NCES district)
- District
- Cascade District
- NCES district ID
- 1600630
- Math proficiency
- 35% ▲ 5.00%
- Reading proficiency
- 45% ▬ 0.00%
- Median HH income
- $49,227
- Composite
- 36.83/100
- National rank
- #9162
- State rank
- #94 of 133 in ID
Livability — Cascade
- Score
- 66/100
- State rank
- #116
- US rank
- #12378
Category grades
Schools grade is shown separately in the Schools card above.
Census & demographics
- Population (ZIP)
- 2,997
Population outlook (Valley County) Hauer SSP2
- Today (2025)
- 10,964 people
- By 2030
- 11,279 · +2.9%
- By 2040
- 11,584 · +5.7%
- By 2050
- 11,754 · +7.2%
- By 2075
- 12,246 · +11.7%
- By 2100
- 11,948 · +9.0%
Race, ethnicity, and origin ACS 2023
- Neighborhood character
- Predominantly White (91%)
- Race & ethnicity
- White 91% Hispanic / Latino 7% Two or more races 6%
- Hispanic origin (detail)
- Mexican 2%
- Common ancestry
- Slovak 7% Dutch 6% Portuguese 5%
- Foreign-born
- 3% · Canada
- Languages at home
- 95% English-only · Spanish 4%
Political lean MEDSL · Valley
- 2024 margin
- R (+18.6) · D 39.6% · R 58.2% · Other 2.2%
- 2008→2024 swing
- -11.6pp toward R · 2008: -6.9pp · 2024: -18.6pp
- All cycles
- 2024: R+18.6 2020: R+13.7 2016: R+18.6 2012: R+11.6 2008: R+6.9
Not yet ingested
- Civics
- —
Market trends
- HPI YoY
- ▼ -118.61%
- Current HPI
- 307.0117
- Rent YoY
- —
- Metro
- —
- State GDP YoY
- ▲ 4.51%
- F500 in state
- 6
Industry mix (Fortune 500 HQ in ID)
| Industry | F500 HQs | Revenue |
|---|---|---|
| Retail | 1 | $79B |
|
||
| Technology | 1 | $25B |
|
||
| Food / Agriculture | 1 | $6B |
|
||
Price history
+133.3% since first listed29 events — show timeline
- 2026-06-01 Listed $525,000 IMLS
- 2025-08-27 Listing Removed — IMLS
- 2025-07-02 Relisted — IMLS
- 2025-06-18 Pending — IMLS
- 2025-05-16 Listed $499,900 IMLS
- 2024-09-05 Listing Removed — IMLS
- 2024-08-15 Listed $525,000 IMLS
- 2024-07-30 Listing Removed — IMLS
- 2024-06-28 Price Changed $550,000 IMLS
- 2024-05-16 Listed $575,000 IMLS
- 2023-10-30 Listing Removed — IMLS
- 2023-08-16 Listed $575,000 MCAOR
- 2023-08-10 Listed $575,000 IMLS
- 2023-08-04 Listing Removed — IMLS
- 2023-08-02 Delisted — MCAOR
- 2023-07-09 Price Changed $599,000 IMLS
- 2023-07-08 Price Changed $599,000 MCAOR
- 2023-06-18 Listed $625,000 MCAOR
- 2023-06-17 Listed $625,000 IMLS
- 2021-07-29 Sold (Public Records) — Public Records
- 2021-07-29 Sold (MLS) — MCAOR
- 2021-07-29 Sold (MLS) — IMLS
- 2021-07-01 Pending — IMLS
- 2021-06-19 Contingent — IMLS
- 2021-05-19 Listed $384,900 IMLS
- 2021-04-07 Listed $384,900 MCAOR
- 2019-04-04 Sold (Public Records) — Public Records
- 2019-04-04 Sold (MLS) — MCAOR
- 2018-08-15 Listed $225,000 MCAOR
Property tax history
+5.7%/yrLatest (2025): $852 · +0.0% YoY. Source: county tax records.
Cash-flow waterfall
monthlySold comps — $/sqft
last 12 mo · ≤1 miLoading sold comps…