168 Wisdom Quest Rd · Bonners Ferry, ID
Flood risk 2/10 · Minimal
- FEMA flood zone
- X
- Chance of flooding over 30 yrs
- 0.03%
- Est. flood insurance / yr
- $507 – $1,088
Fire risk 6/10 · Moderate
- Est. fire insurance / yr
- $584 – $1,086
Heat risk 3/10 · Minor
- Hot days now (above 91°F)
- 8 days/yr
- Hot days in 30 yrs
- 18 days/yr
Wind risk 1/10 · Minimal
- Chance of severe wind over 30 yrs
- —
Air-quality risk 9/10 · Severe
- Unhealthy air days now
- 16 days/yr
- Unhealthy air days in 30 yrs
- 20 days/yr
Risk factors via First Street. Map © Google.
Why this score? — see what drove the B grade
The composite is a weighted blend of 9 inputs, each scored 0–100. Each bar is that input's sub-score; the figure is the points it added to the 100-point composite (weight × sub-score).
- Cash flow +25.7/30.0
- Appreciation +10.0/10.0
- DSCR +8.6/10.0
- ARV discount +7.5/15.0
- 1% rule +6.8/10.0
- Schools +4.1/10.0
- Condition / age +3.8/5.0
- Livability +3.2/5.0
- Rent growth +2.5/5.0
$74,900
🖨 Deal sheet 📄 Offer letter ✓ Due diligence
Listing remarks
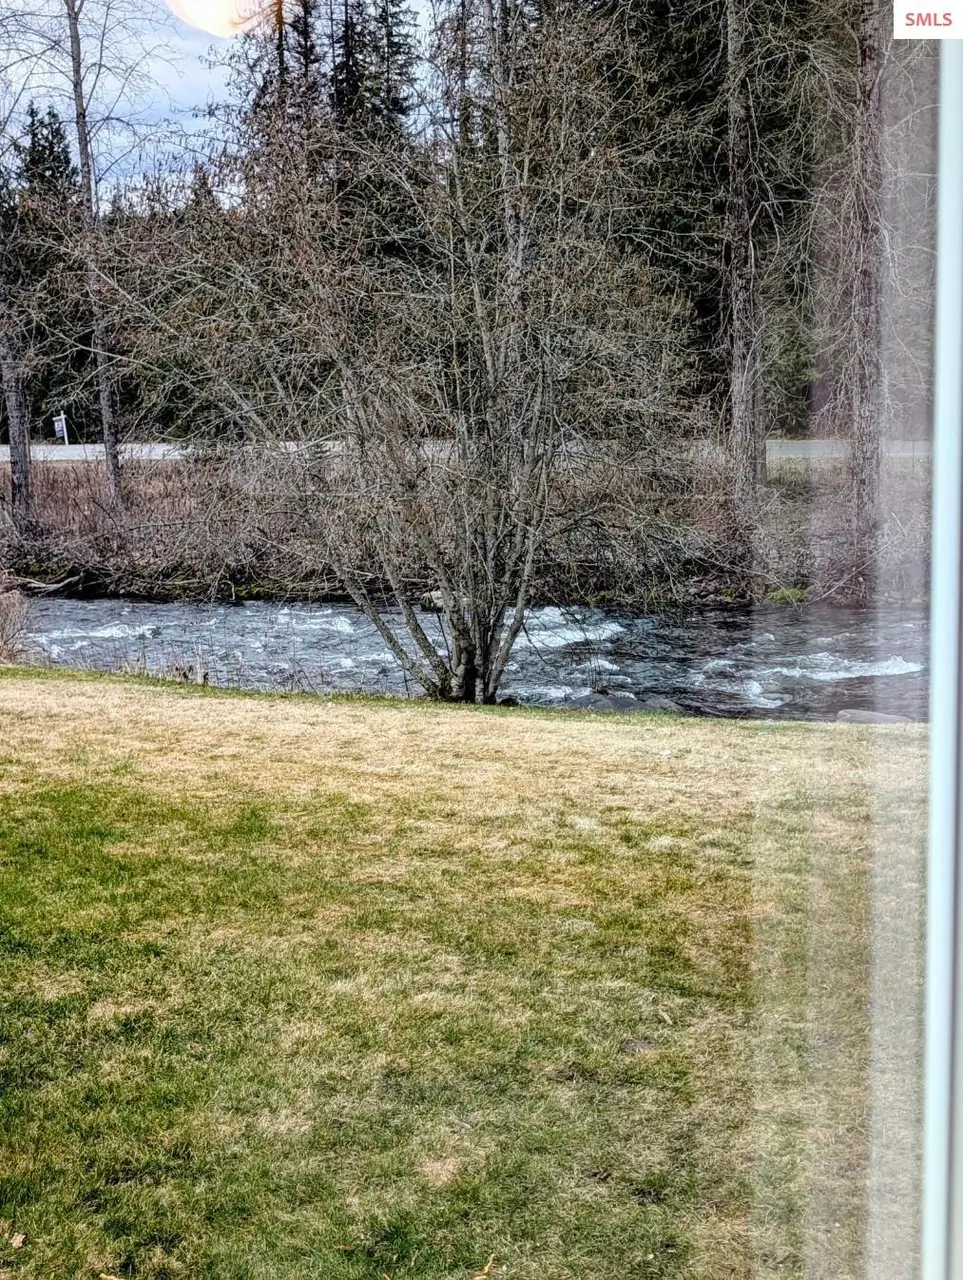
* * Price reduced * * !!) SNOWBIRDS, INVESTORS and 1ST Time buyers take note! (SELLER Paying a portion of the lot rent through the END of 2027!!) This is the PERFECT Creekside home ready to enjoy living in year round, to purchase it and have it as a rental investment property or button it up when the temp drops below 50 for 7 days straight and head South! Want fresh fish? Step 20 feet out the back and drop a line in Deep Creek which flows year round! 90 Degrees out in the summer? Walk out back and have a seat in the creek and cool off! Located in a very nicely run establishment, the combination of multiple uses, location and the creek on this one are hard to come by. For this price you c
Key facts
- Creekside home
- Built 1968
- Listed 91 days
Tags
Property features AI
Exterior
- Parking: Off-street parking
- Utilities: Electricity connected
- Home design: Manufactured house (single wide); Residential property / Manufactured Home
- Construction: Block foundation
- Exterior features: Level lot; Waterfront access; View
Interior
- Kitchen: Oven; Range; Refrigerator
- Bedrooms: 2 bedrooms on the main level
- Flooring: Laminate flooring
- Bathrooms: 1 bathroom on the main level
- Heating & cooling: Electric forced-air heating
- Interior features: High speed internet; Insulated, double-pane windows
Neighborhood map
What this means for you Summary
Snapshot
- This is a 2-bed/1.0-bath manufactured listed at $75k. Condition is rated good.
Deal economics
- At list price, monthly cash flow is $179 ($2k/yr) — positive.
- The deal already cash-flows at list — no discount required.
- Meets the 1% rule at list price ($882 rent vs $75k).
- Recommended offer: $68k (9.0% below list) — sets the bar for market timing.
- Cap rate 9.2% vs local median 0.8% in Bonners Ferry — top-decile yield for the area; either an underpriced asset or a hidden risk that comps aren't pricing in. Stress-test before assuming the spread holds.
Location & tenants
- Location reads 63/100 on livability (#154 in ID) — a middle-class / working-renter tenant base. Strengths: cost of living A+, crime A-, housing B+; Watch: amenities F, commute F, employment F.
- Boundary County District (town): math 40% / reading 58% proficiency, ranked #42 of 92 in ID (top 46%) — families likely to look elsewhere, expect single-tenant / working-renter base with shorter leases.
- Zoned schools: Naples Elementary School (math 34% / reading 44%, grade F, #234 of 357 statewide, top 69%, 96 students, 73% FRL); Bonners Ferry High School (math 22% / reading 62%, grade F, #72 of 169 statewide, top 47%, 436 students, 27% FRL).
- Market conditions: 34 active listings in the ZIP; 69 units permitted in Boundary County in 2024 (0 in 5+ unit buildings).
Forward outlook
- In year one you build about $8k of equity ($518 loan paydown + $7k appreciation (10.0% local appreciation)).
- At projected returns (10.0% appreciation + 3.0% rent growth), your $21k cash investment doubles in ~2 years — after that, you're playing with house money.
- By year 5, paydown + projected appreciation supports a ~$37k cash-out refi (75% LTV) — recoverable capital for the next deal without selling this one.
Negotiation context
- It's been on market 92 days — a 9% lower offer ($68k) is reasonable based on typical stale-listing flexibility.
Risks & watch-outs
- Climate carrying-cost: major wildfire risk — expect insurance premiums to compound above CPI over the hold.
Questions for the listing agent
- It's been on market 92 days. Have you received any prior offers? Is the seller open to a 9% concession, seller financing, or rate buy-down credit?
- Built in 1968 — when were the roof, HVAC, electrical panel, plumbing, and water heater last replaced?
- Why hasn't it sold? Are there any deal-killer items the seller is aware of (foundation, flood, title, zoning, code violations)?
- Is there a deadline driving the sale (1031 exchange, divorce, estate, relocation)? That informs how much negotiation room exists.
- Schools are D-rated, which usually means shorter tenancies and higher turnover. Who's the typical renter profile here, and what's been the actual vacancy rate?
- What's the average days-on-market for RENTAL listings here right now (not sales)? A rising rental-DOM trend means longer vacancies and softer asking-rent achievability than the comps imply.
- What's the recent tenant-quality profile in this submarket — average credit score on applications, eviction rate, late-payment / NSF rate, and stable-employment percentage? A property-management company in the area should have these aggregated.
- How much new for-sale + rental construction is in the pipeline within 1–3 miles? Heavy new supply typically softens prices + rents 12–24 months out; constrained supply supports both.
Investment metrics
- 1% rule
- 1.18% ✓
- Cap rate
- 9.16%
- Cash-on-cash
- 10.25%
- DSCR
- 1.46
- GRM
- 7.1
CMA / ARV
No comps found within radius.
Projected returns pro-forma
10.0% appreciation · 3.0% rent growth · sell at horizon
- IRR
- 31.8%
- Equity multiple
- 3.49×
- Total profit
- $52,218
- Equity at exit
- $67,476
- IRR
- 27.5%
- Equity multiple
- 7.91×
- Total profit
- $144,826
- Equity at exit
- $145,514
Cash invested: $20,972 (down + closing). Projections, not guarantees.
Landlord ↔ Tenant lean methodology
- Overall (STATE)
- 91 Strongly Landlord-Friendly
- State Idaho
- 91 Strongly Landlord-Friendly · R+18
- County
- — inherits STATE
- City
- — inherits STATE
ZIP-level market 83847
- Home prices YoY
- 10.9%
- Active inventory
- 34
- Price-to-rent
- 7.1×
Monthly cashflow live
- Estimated rent
- $882 medium interval (Pro) →
- Mortgage (P&I)
- −$393
- Tax est. 1.5%
- −$94 /mo · $1,124/yr
- Insurance
- −$31
- HOA
- −$0
- Vacancy / Maint / Mgmt
- −$185
- Net cashflow
- $179
Break-even live
UW: 25.0% down · 7.5% · 30yr · 1.5% tax · 5.0% vac · 8.0% maint · 8.0% mgmt
Financing live
Cash to close
- Down payment
- $18,725
- Closing costs
- $2,247
- Reserves months
- —
- Total cash needed
- —
Loan-product check · same deal, 3 products live
Conventional
25% down · 7.5% · 30yr
- Down + closing
- —
- Monthly P&I
- —
- Monthly cashflow
- —
- DSCR
- —
- Eligible?
- —
Personal DTI + credit; lowest rate.
DSCR
20% down · 8.5% · 30yr
- Down + closing
- —
- Monthly P&I
- —
- Monthly cashflow
- —
- DSCR
- —
- Eligible?
- —
No personal income docs; deal must DSCR.
Hard money
10% down · 12.0% · 12mo
- Down + closing
- —
- Monthly P&I
- —
- Monthly cashflow
- —
- DSCR
- —
- Eligible?
- —
Short-term bridge; refi at stabilization.
Listing history 20 events
-
2026-06-19days on market $74,900 Active 92 DOM
-
2026-06-18days on market $74,900 Active 91 DOM
-
2026-06-17days on market $74,900 Active 90 DOM
-
2026-06-16days on market $74,900 Active 89 DOM
-
2026-06-15days on market $74,900 Active 88 DOM
-
2026-06-14days on market $74,900 Active 86 DOM
-
2026-06-12days on market $74,900 Active 85 DOM
-
2026-06-09days on market $74,900 Active 82 DOM
-
2026-06-08days on market $74,900 Active 81 DOM
-
2026-06-07days on market $74,900 Active 80 DOM
-
2026-06-07pricedays on market $74,900 Active 79 DOM
-
2026-06-04days on market $79,500 Active 76 DOM
-
2026-06-02days on market $79,500 Active 75 DOM
-
2026-06-01days on market $79,500 Active 74 DOM
-
2026-05-31days on market $79,500 Active 73 DOM
-
2026-05-31days on market $79,500 Active 72 DOM
-
2026-05-14price $79,500
-
2026-04-30price $82,500
-
2026-04-13price $84,500
-
2026-03-19$89,000 Active
ⓘ Source: listings_history table (triggers on properties + properties_extension) + one-shot
backfill from property_details.listing_events for pre-trigger history.
Climate risk First Street
- Flood 2/10 Low FEMA zone X · 3% chance over 30 yrs
- Wildfire 6/10 Major
- Heat 3/10 Moderate 8 d/yr ≥91°F today · 18 d/yr by 30 yrs out
- Wind 1/10 Low
- Air quality 9/10 Extreme 16 unhealthy d/yr today · 20 by 30 yrs out
Nearby sold comps map
Loading sold comps map…
Walkable amenities ~0.75 mi
Loading nearby amenities…
Taxation est. · year 1
- Rental income
- $10,584
- − Mortgage interest
- −$4,196
- − Property taxes
- −$1,124
- − Insurance
- −$374
- − Repairs & maintenance
- −$847
- − Management
- −$847
- − Depreciation
- −$2,179
- Taxable income
- $1,018
- Est. tax owed @ 24.0%
- −$244
- After-tax cash flow
- $1,906/yr
For passive investors: Depreciation is non-cash, so a rental often shows a tax loss while cash-flowing — sheltering income. Rental losses are passive: they offset passive income freely, and up to $25,000/yr can offset ordinary (W-2) income if you actively participate and your MAGI is under $100k (phasing out to $0 by $150k); unused losses carry forward. On sale, claimed depreciation is recaptured at up to 25%, and gains may owe capital-gains tax (a 1031 exchange can defer both). Figures are a year-1 estimate at your 24.0% rate — not tax advice; consult a CPA.
Condition & rehab AI · 12 photos
This creekside manufactured home is in good condition with a good exterior and interior. Simple updates like painting the exterior and cleaning gutters can significantly enhance its curb appeal and value.
Value-add opportunities
- Both Paint exterior siding — Enhances curb appeal and value
- Both Clean gutters — Improves drainage and overall appearance
Renovation cost estimate screening
Value-add ROI direction
- Both Paint exterior siding — Enhances curb appeal and value ↑
- Both Clean gutters — Improves drainage and overall appearance ↑
ⓘ Cost ranges are severity-bucket heuristics (US national rule-of-thumb). Get contractor quotes + a written scope before underwriting a rehab budget.
Schools (NCES district)
- District
- Boundary County District
- NCES district ID
- 1600420
- Math proficiency
- 40% ▼ -2.00%
- Reading proficiency
- 58% ▲ 1.00%
- Median HH income
- $38,598
- Composite
- 40.8/100
- National rank
- #3638
- State rank
- #42 of 92 in ID
Livability — Bonners Ferry
- Score
- 63/100
- State rank
- #154
- US rank
- #14914
Category grades
Schools grade is shown separately in the Schools card above.
Census & demographics
- Population (ZIP)
- 1,475
Population outlook (Boundary County) Hauer SSP2
- Today (2025)
- 11,888 people
- By 2030
- 12,068 · +1.5%
- By 2040
- 12,132 · +2.1%
- By 2050
- 11,952 · +0.5%
- By 2075
- 11,265 · -5.2%
- By 2100
- 9,878 · -16.9%
Race, ethnicity, and origin ACS 2023
- Neighborhood character
- Predominantly White (72%)
- Race & ethnicity
- White 72% Two or more races 11% Asian 8% Native American 6% Hispanic / Latino 5%
- Hispanic origin (detail)
- Mexican 4%
- Common ancestry
- Romanian 2% Subsaharan African 2% Lithuanian 1%
- Foreign-born
- 6% · China, South Korea, Canada
- Languages at home
- 93% English-only · Korean 3% Chinese 3% Spanish 1%
Political lean MEDSL · Boundary
- 2024 margin
- Solid R (+65.4) · D 16.1% · R 81.5% · Other 2.4%
- 2008→2024 swing
- -31.7pp toward R · 2008: -33.7pp · 2024: -65.4pp
- All cycles
- 2024: R+65.4 2020: R+58.9 2016: R+55.5 2012: R+42.1 2008: R+33.7
Not yet ingested
- Civics
- —
Market trends
- HPI YoY
- ▲ 25.36%
- Current HPI
- 257.02
- Rent YoY
- —
- Metro
- —
- State GDP YoY
- ▲ 4.51%
- F500 in state
- 6
Industry mix (Fortune 500 HQ in ID)
| Industry | F500 HQs | Revenue |
|---|---|---|
| Retail | 1 | $79B |
|
||
| Technology | 1 | $25B |
|
||
| Food / Agriculture | 1 | $6B |
|
||
Price history
-10.7% since first listed4 events — show timeline
- 2026-05-14 Price Changed $79,500 SELMLS
- 2026-04-30 Price Changed $82,500 SELMLS
- 2026-04-13 Price Changed $84,500 SELMLS
- 2026-03-19 Listed $89,000 SELMLS
Cash-flow waterfall
monthlySold comps — $/sqft
last 12 mo · ≤1 miLoading sold comps…