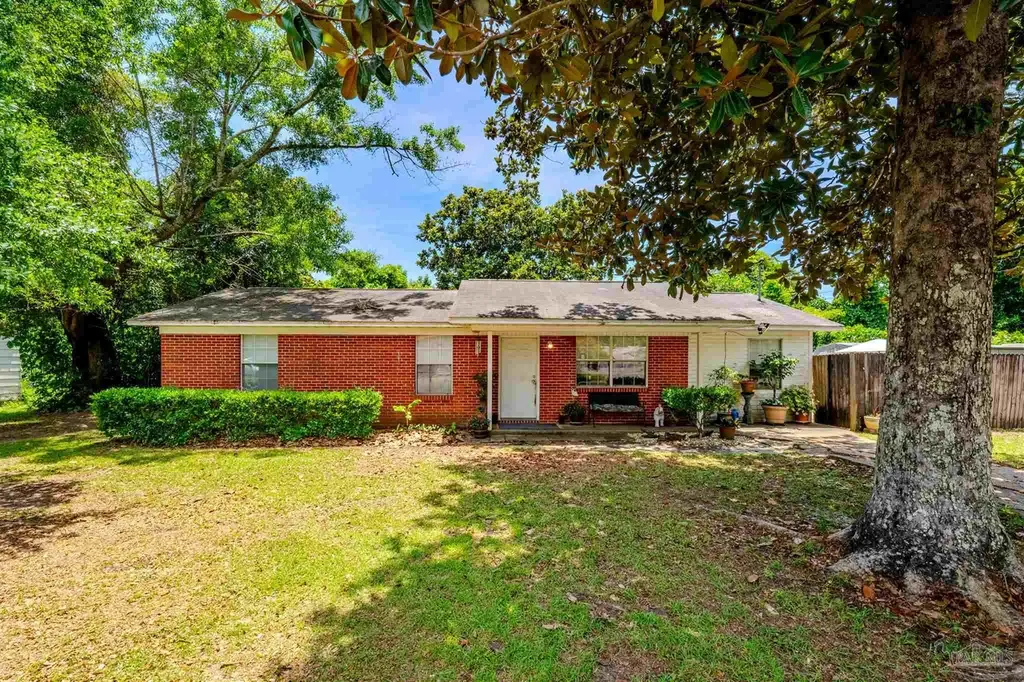
3609 Empire St · Pace, FL
Flood risk 1/10 · Minimal
- FEMA flood zone
- X (unshaded)
- Chance of flooding over 30 yrs
- 0.0%
- Est. flood insurance / yr
- $507 – $1,088
Fire risk 3/10 · Minor
- Est. fire insurance / yr
- $947 – $1,759
Heat risk 10/10 · Severe
- Hot days now (above 105°F)
- 7 days/yr
- Hot days in 30 yrs
- 23 days/yr
Wind risk 9/10 · Severe
- Chance of severe wind over 30 yrs
- 99.0%
Air-quality risk 1/10 · Minimal
- Unhealthy air days now
- 0 days/yr
- Unhealthy air days in 30 yrs
- 0 days/yr
Risk factors via First Street. Map © Google.
Why this score? — see what drove the C+ grade
The composite is a weighted blend of 9 inputs, each scored 0–100. Each bar is that input's sub-score; the figure is the points it added to the 100-point composite (weight × sub-score).
- Cash flow +22.3/30.0
- ARV discount +15.0/15.0
- DSCR +7.1/10.0
- Schools +5.3/10.0
- 1% rule +5.2/10.0
- Livability +3.5/5.0
- Rent growth +3.2/5.0
- Condition / age +2.5/5.0
- Appreciation +0.0/10.0
$185,000
🖨 Deal sheet 📄 Offer letter ✓ Due diligence
Listing remarks
Welcome to 3609 Empire St, a solid brick home tucked away in the heart of Pace with no HOA and a spacious lot shaded by mature trees. This 3-bedroom, 2-bath residence offers a functional floor plan with over 1,200 square feet of living space and an open-concept layout that seamlessly connects the living room, dining area, and kitchen. Inside, you'll find a generously sized living area with abundant natural light and plenty of room for entertaining or relaxing. The kitchen features ample cabinet and countertop space, a breakfast bar, and an adjoining dining area with French doors leading to the backyard. The primary suite includes a private bath, while two additional bedrooms provide flexibi
Key facts
- Spacious lot
- Solid brick home
- Mature trees
Tags
Property features AI
Finance
- Other: Property condition: Resale; Lot size approximately 0.309 acres
- Financial info: Not specified
- HOA & community: No association
Exterior
- Parking: 2 spaces per unit
- Security: Not specified
- Utilities: Public water; Public sewer; Electric with circuit breakers and copper wiring; County-maintained road access
- Home design: One-story frame home; Resale property; Not attached to other properties
- Construction: Frame construction; Slab foundation; Composition roof; Built as a single-level (one) building
- Exterior features: Interior lot
Interior
- Kitchen: Electric water heater
- Bedrooms: Master bedroom on the first floor (approx. 10 x 10 ft); Second bedroom on the first floor (approx. 8 x 10 ft); Third bedroom on the first floor (approx. 8 x 10 ft)
- Flooring: Carpet; Laminate
- Bathrooms: Two full bathrooms
- Heating & cooling: Central heating; Central air; Ceiling fan(s)
- Interior features: Carpet and laminate flooring; Kitchen/dining combo
- Laundry & utility: Not specified
Neighborhood map
What this means for you Summary
Snapshot
- This is a 3-bed/2.0-bath single-family listed at $185k.
Deal economics
- At list price, monthly cash flow is $304 ($4k/yr) — positive.
- The deal already cash-flows at list — no discount required.
- Meets the 1% rule at list price ($2k rent vs $185k).
- Cap rate 8.3% vs local median 4.5% in Pace — top-decile yield for the area; either an underpriced asset or a hidden risk that comps aren't pricing in. Stress-test before assuming the spread holds.
Location & tenants
- Location reads 69/100 on livability (#475 in FL) — a middle-class / working-renter tenant base. Strengths: cost of living A+, housing A+, schools B+; Watch: amenities F, commute F, health & safety F.
- Santa Rosa (suburban): math 63% / reading 60% proficiency, ranked #8 of 73 in FL (top 11%) — acceptable for families but not a draw, mixed tenant base, ~2y average lease.
- Market conditions: Rents rising (+2.7%/yr); 665 active listings in the ZIP; 3 comparable units currently listed for rent nearby; rentals at typical pace (median 14d on market — plan ~3-4 weeks tenant-placement turnaround); solid renter incomes; 1,983 units permitted in Santa Rosa County in 2024 (128 in 5+ unit buildings).
Forward outlook
- Local home prices are declining (-3.0%/yr); year-one equity from $1k of loan paydown is wiped out by about $6k of value loss. Plan a longer hold.
- Santa Rosa County population projected at +31% by 2050 — long-run rental-demand tailwind backs the buy-and-hold thesis.
Negotiation context
- Only 9 days on market — expect competitive offers; lowballing is unlikely to land.
- Current owner paid $22k; list at $185k implies a 749% gain — meaningful room to come down on a strong offer.
Risks & watch-outs
- Climate carrying-cost: severe wind risk, 99% chance of damaging wind over 30y; extreme-heat days projected 7→23/yr by 2055 (HVAC capex compounding) — expect insurance premiums to compound above CPI over the hold.
Questions for the listing agent
- Built in 1961 — when were the roof, HVAC, electrical panel, plumbing, and water heater last replaced?
- Is there a deadline driving the sale (1031 exchange, divorce, estate, relocation)? That informs how much negotiation room exists.
- Schools are B-rated — typically a magnet for longer-tenancy family renters. What's the average tenant stay here, and is there a school-zone premium baked into asking?
- What's the average days-on-market for RENTAL listings here right now (not sales)? A rising rental-DOM trend means longer vacancies and softer asking-rent achievability than the comps imply.
- What's the recent tenant-quality profile in this submarket — average credit score on applications, eviction rate, late-payment / NSF rate, and stable-employment percentage? A property-management company in the area should have these aggregated.
- How much new for-sale + rental construction is in the pipeline within 1–3 miles? Heavy new supply typically softens prices + rents 12–24 months out; constrained supply supports both.
Investment metrics
- 1% rule
- 1.02% ✓
- Cap rate
- 8.27%
- Cash-on-cash
- 7.05%
- DSCR
- 1.31
- GRM
- 8.1
CMA / ARV
- ARV (on-the-fly)
- $241,680
- Comps found
- 8
Show comp detail 8 sales within ~0.75 mi
| Address | Dist | Beds/Ba | Sqft | Sold | Price | $/sf | Match |
|---|---|---|---|---|---|---|---|
| 4308 Floridatown Rd | 0.68mi | 3/2.0 | 1,264 (-1%) | 1mo | $205,000 | $162 | 66 |
| 4187 Sixth Ave | 0.35mi | 3/2.0 | 1,200 (-6%) | 14mo | $205,000 | $171 | 63 |
| 3725 Martin St | 0.27mi | 3/2.0 | 1,428 (+12%) | 9mo | $295,000 | $207 | 59 |
| 3830 University St | 0.56mi | 3/2.0 | 1,382 (+9%) | 11mo | $285,000 | $206 | 50 |
| 4221 Willow St | 0.75mi | 3/2.0 | 1,262 (-1%) | 16mo | $240,000 | $190 | 50 |
| 4316 Floridatown Rd | 0.70mi | 2/1.5 (-1) | 1,316 (+4%) | 8mo | $215,000 | $163 | 48 |
| 4329 Floridatown Rd | 0.65mi | 4/2.0 (+1) | 1,374 (+8%) | 7mo | $235,000 | $171 | 45 |
| 4412 Bayou Ridge Dr | 0.52mi | 3/2.0 | 1,452 (+14%) | 9mo | $340,000 | $234 | 44 |
Match score weights: distance 35% · size 25% · config 20% · recency 20%. Top-matched comps best support the ARV.
Projected returns pro-forma
-3.0% appreciation · 2.72% rent growth · sell at horizon
- IRR
- -5.8%
- Equity multiple
- 0.78×
- Total profit
- $-11,150
- Equity at exit
- $27,584
- IRR
- 3.5%
- Equity multiple
- 1.25×
- Total profit
- $12,981
- Equity at exit
- $15,995
Cash invested: $51,800 (down + closing). Projections, not guarantees.
Landlord ↔ Tenant lean methodology
- Overall (STATE)
- 87 Strongly Landlord-Friendly
- State Florida
- 87 Strongly Landlord-Friendly · R+3
- County
- — inherits STATE
- City
- — inherits STATE
ZIP-level market 32571
- Home prices YoY
- -17.7%
- Rents YoY
- 2.7%
- Active inventory
- 665
- Price-to-rent
- 8.1×
Monthly cashflow live
- Estimated rent
- $1,894 medium interval (Pro) →
- Mortgage (P&I)
- −$970
- Tax from tax record
- −$145 /mo · $1,739/yr
- Insurance
- −$77
- HOA
- −$0
- Vacancy / Maint / Mgmt
- −$398
- Net cashflow
- $304
Break-even live
UW: 25.0% down · 7.5% · 30yr · 1.5% tax · 5.0% vac · 8.0% maint · 8.0% mgmt
Financing live
Cash to close
- Down payment
- $46,250
- Closing costs
- $5,550
- Reserves months
- —
- Total cash needed
- —
Loan-product check · same deal, 3 products live
Conventional
25% down · 7.5% · 30yr
- Down + closing
- —
- Monthly P&I
- —
- Monthly cashflow
- —
- DSCR
- —
- Eligible?
- —
Personal DTI + credit; lowest rate.
DSCR
20% down · 8.5% · 30yr
- Down + closing
- —
- Monthly P&I
- —
- Monthly cashflow
- —
- DSCR
- —
- Eligible?
- —
No personal income docs; deal must DSCR.
Hard money
10% down · 12.0% · 12mo
- Down + closing
- —
- Monthly P&I
- —
- Monthly cashflow
- —
- DSCR
- —
- Eligible?
- —
Short-term bridge; refi at stabilization.
Rent comps 3 comps
| Address | Beds | Baths | Sqft | Rent | $/sqft | DOM | Units | Dist |
|---|---|---|---|---|---|---|---|---|
| 4606 Southern Pl Milton, FL | 3.0 | 1.5 | 1431 | $1,500 | $1.05 | 14d | 1 | 0.77mi |
| 3982 Edgefield St Milton, FL | 3.0 | 2.0 | 1135 | $1,750 | $1.54 | 14d | 1 | 1.06mi |
| 3492 Quail Dr Milton, FL | 3.0 | 2.0 | 1637 | $1,900 | $1.16 | 23d | 1 | 1.26mi |
Listing history 8 events
-
2026-06-18days on market $185,000 Active 9 DOM
-
2026-06-17days on market $185,000 Active 8 DOM
-
2026-06-16days on market $185,000 Active 7 DOM
-
2026-06-15days on market $185,000 Active 6 DOM
-
2026-06-14days on market $185,000 Active 4 DOM
-
2026-06-13days on market $185,000 Active 3 DOM
-
2026-06-10remarks 699-char remark
-
2026-06-10$185,000 Active 1 DOM
ⓘ Source: listings_history table (triggers on properties + properties_extension) + one-shot
backfill from property_details.listing_events for pre-trigger history.
Tax reassessment forecast FL · Resets to sale price
- Current annual tax
- $1,739 · $145/mo
- Projected year-2 tax
- $1,739 · $145/mo
- Expected delta
- $0/yr ($0/mo · -0.0%)
ⓘ Screening estimate from a state-policy table — verify with the county assessor before closing.
Climate risk First Street
- Flood 1/10 Low FEMA zone X (unshaded) · 0% chance over 30 yrs
- Wildfire 3/10 Moderate
- Heat 10/10 Extreme 7 d/yr ≥105°F today · 23 d/yr by 30 yrs out
- Wind 9/10 Extreme 99% chance of damaging wind over 30 yrs
- Air quality 1/10 Low 0 unhealthy d/yr today · 0 by 30 yrs out
Nearby sold comps map
Loading sold comps map…
Walkable amenities ~0.75 mi
Loading nearby amenities…
Taxation est. · year 1
- Rental income
- $22,731
- − Mortgage interest
- −$10,363
- − Property taxes
- −$1,739
- − Insurance
- −$925
- − Repairs & maintenance
- −$1,819
- − Management
- −$1,819
- − Depreciation
- −$5,382
- Taxable income
- $686
- Est. tax owed @ 24.0%
- −$165
- After-tax cash flow
- $3,488/yr
For passive investors: Depreciation is non-cash, so a rental often shows a tax loss while cash-flowing — sheltering income. Rental losses are passive: they offset passive income freely, and up to $25,000/yr can offset ordinary (W-2) income if you actively participate and your MAGI is under $100k (phasing out to $0 by $150k); unused losses carry forward. On sale, claimed depreciation is recaptured at up to 25%, and gains may owe capital-gains tax (a 1031 exchange can defer both). Figures are a year-1 estimate at your 24.0% rate — not tax advice; consult a CPA.
Schools (NCES district)
- District
- Santa Rosa
- NCES district ID
- 1201650
- Math proficiency
- 63% ▼ -6.00%
- Reading proficiency
- 60% ▼ -5.00%
- Median HH income
- $58,161
- Composite
- 53.12/100
- National rank
- #1511
- State rank
- #8 of 73 in FL
Livability — Pace
- Score
- 69/100
- State rank
- #475
- US rank
- #8593
Category grades
Schools grade is shown separately in the Schools card above.
Census & demographics
- Census place
- Pace, FL
- County
- Santa Rosa County · 194,764 people
- City population
- 42,171
- Metro
- Pensacola-Ferry Pass-Brent, FL
- Population (ZIP)
- 42,171
- Household income
- $87,617
- Rent vs Own
- Severe rent burden
- 301.0
Population outlook (Santa Rosa County) Hauer SSP2
- Today (2025)
- 195,978 people
- By 2030
- 209,782 · +7.0%
- By 2040
- 235,293 · +20.1%
- By 2050
- 256,408 · +30.8%
- By 2075
- 298,074 · +52.1%
- By 2100
- 303,216 · +54.7%
Race, ethnicity, and origin ACS 2023
- Neighborhood character
- Predominantly White (80%)
- Race & ethnicity
- White 80% Two or more races 9% Hispanic / Latino 6% Black 4% Asian 2%
- Hispanic origin (detail)
- Mexican 3%
- Common ancestry
- Lithuanian 4% Italian 3% Slovak 2%
- Foreign-born
- 6% · Canada, South Korea
- Languages at home
- 93% English-only · Spanish 2% Other Indo-European 1% Russian/Polish/Slavic 1%
Political lean MEDSL · Santa Rosa
- 2024 margin
- Solid R (+51.0) · D 24.1% · R 75.0%
- 2008→2024 swing
- -3.0pp toward R · 2008: -47.9pp · 2024: -51.0pp
- All cycles
- 2024: R+51.0 2020: R+46.5 2016: R+53.5 2012: R+52.6 2008: R+47.9
Not yet ingested
- Civics
- —
Market trends
- HPI YoY
- ▼ -62.39%
- Current HPI
- 290.2953
- Rent YoY
- ▲ 2.72%
- Metro
- Pensacola-Ferry Pass-Brent, FL
- State GDP YoY
- ▲ 3.28%
- F500 in state
- 36
Industry mix (Fortune 500 HQ in FL)
| Industry | F500 HQs | Revenue |
|---|---|---|
| Industrial Technology | 2 | $29B |
|
||
| Insurance | 2 | $17B |
|
||
| Retail | 1 | $60B |
|
||
| Technology Distribution | 1 | $58B |
|
||
| Homebuilding | 1 | $35B |
|
||
| Technology Manufacturing | 1 | $35B |
|
||
Price history
+436.2% since first listed3 events — show timeline
- 2026-06-09 Listed $185,000 PARMLS
- 1993-09-08 Sold (Public Records) $21,800 Public Records
- 1982-04-01 Sold (Public Records) $34,500 Public Records
Property tax history
+5.4%/yrLatest (2025): $1,739 · +5.3% YoY. Source: county tax records.
Cash-flow waterfall
monthlySold comps — $/sqft
last 12 mo · ≤1 miLoading sold comps…