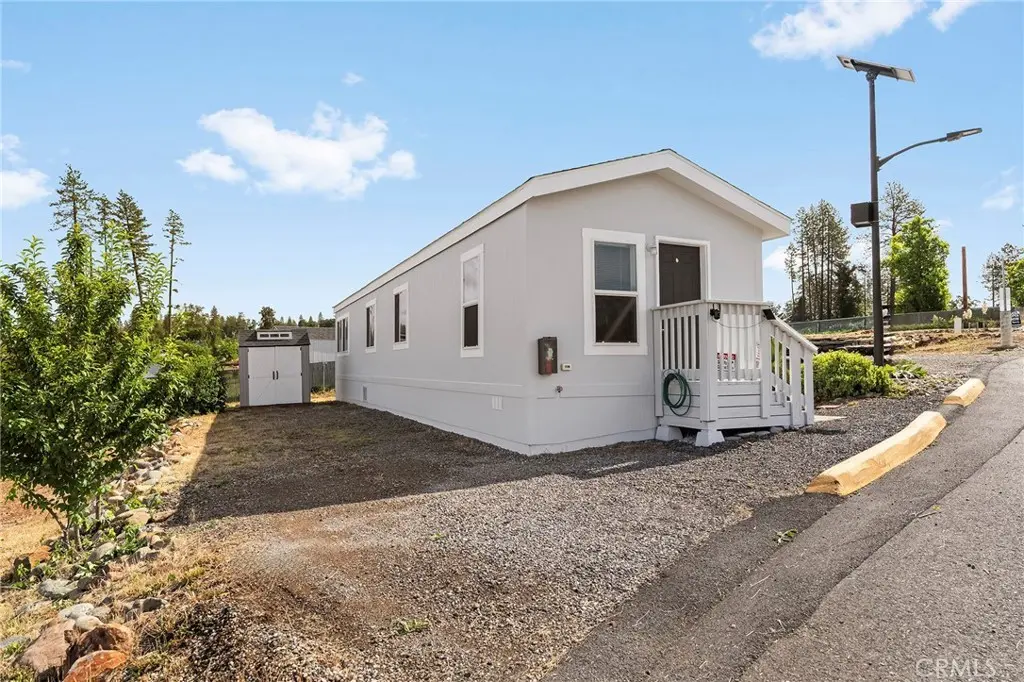
1080 Pearson #3 · Paradise, CA
Flood risk No data
- FEMA flood zone
- —
- Chance of flooding over 30 yrs
- —
- Est. flood insurance / yr
- —
Fire risk No data
- Est. fire insurance / yr
- —
Heat risk No data
- Hot days now (above threshold)
- —
- Hot days in 30 yrs
- —
Wind risk No data
- Chance of severe wind over 30 yrs
- —
Air-quality risk No data
- Unhealthy air days now
- —
- Unhealthy air days in 30 yrs
- —
Risk factors via First Street. Map © Google.
Why this score? — see what drove the B+ grade
The composite is a weighted blend of 9 inputs, each scored 0–100. Each bar is that input's sub-score; the figure is the points it added to the 100-point composite (weight × sub-score).
- Cash flow +30.0/30.0
- ARV discount +15.0/15.0
- 1% rule +10.0/10.0
- DSCR +10.0/10.0
- Schools +5.0/10.0
- Rent growth +4.1/5.0
- Livability +3.1/5.0
- Condition / age +2.5/5.0
- Appreciation +0.0/10.0
$70,000
🖨 Deal sheet 📄 Offer letter ✓ Due diligence
Listing remarks
Affordable Paradise Homeownership Is Still Possible! Clean, updated, newer, and priced at $70,000 — this 2021 mobile home in a well-located Paradise park offers a practical way to get into a home without stretching into a traditional house payment. This 2 bedroom, 1 bathroom home offers approximately 722 square feet with an open living area, functional kitchen, indoor laundry, and all appliances included — including the washer and dryer. Recently refreshed with meaningful updates, the home features fresh interior and exterior paint, new caulking, new LVP flooring throughout, updated baseboards, a new interior ceiling fan, a new exterior light fixture, and partial replacement of
Key facts
- Parking
- Built 2021
- Listed 21 days
Property features AI
Finance
- Other: Manager approval required
- Financial info: Monthly land lease of $650 (seller reported)
- HOA & community: Senior community; Community amenities include biking, hiking, and a lake; Located in MHP Paradise LLC (land lease)
Exterior
- Parking: Driveway parking and additional parking space; Uncovered parking for 1 vehicle
- Utilities: Public water (district); Community septic; Natural gas available; Electricity available
- Home design: Single-wide mobile home; One story; Front entry
- Construction: Built by builder (year built source: builder)
- Exterior features: Composition roof; Rectangular lot shape; No pool; One shed on the property; Mobile home remains on site (13' x 56', Skyline model)
Interior
- Kitchen: Gas range; Gas oven; Gas water heater
- Bedrooms: All bedrooms located on the main floor
- Flooring: Laminate flooring
- Bathrooms: 1 full bathroom
- Heating & cooling: Central heating (furnace); Central cooling
- Interior features: One-level home with front entry; All bedrooms on the main floor; Kitchen open to family room; Kitchen island
- Laundry & utility: Laundry inside (see remarks)
Neighborhood map
What this means for you Summary
Snapshot
- This is a 2-bed/1.0-bath manufactured listed at $70k.
Deal economics
- At list price, monthly cash flow is $558 ($7k/yr) — positive.
- The deal already cash-flows at list — no discount required.
- Meets the 1% rule at list price ($1k rent vs $70k).
- Recommended offer: $69k (1.5% below list) — sets the bar for market timing.
- Cap rate 15.9% vs local median 2.6% in Paradise — top-decile yield for the area; either an underpriced asset or a hidden risk that comps aren't pricing in. Stress-test before assuming the spread holds.
Location & tenants
- Location reads 61/100 on livability (#541 in CA) — a middle-class / working-renter tenant base. Strengths: schools A-, housing B+, crime B; Watch: employment C-, amenities F, commute F.
- Market conditions: Rents rising fast (+6.4%/yr); 481 active listings in the ZIP; 3 comparable units currently listed for rent nearby; rentals lingering (median 44d on market — plan ~5-8 weeks vacancy on turnover, expect pricing pressure); 67% of comp listings sitting > 30 days — soft ceiling on asking rent; 946 units permitted in Butte County in 2024 (254 in 5+ unit buildings).
Forward outlook
- Local home prices are declining (-3.0%/yr); year-one equity from $484 of loan paydown is wiped out by about $2k of value loss. Plan a longer hold.
- Butte County population projected at +10% by 2050 — modest demand growth; plan on rents tracking national, not racing it.
- At projected returns (-3.0% appreciation + 6.4% rent growth), your $20k cash investment doubles in ~4 years — after that, you're playing with house money.
Negotiation context
- It's been on market 22 days — a 2% lower offer ($69k) is reasonable based on typical stale-listing flexibility.
- 2 sale attempts with the ask held roughly flat each time — persistent listings suggest the price (not the market) is what's stuck; bring a comps-based counter.
Questions for the listing agent
- Is there a deadline driving the sale (1031 exchange, divorce, estate, relocation)? That informs how much negotiation room exists.
- Schools are A-rated — typically a magnet for longer-tenancy family renters. What's the average tenant stay here, and is there a school-zone premium baked into asking?
- What's the average days-on-market for RENTAL listings here right now (not sales)? A rising rental-DOM trend means longer vacancies and softer asking-rent achievability than the comps imply.
- What's the recent tenant-quality profile in this submarket — average credit score on applications, eviction rate, late-payment / NSF rate, and stable-employment percentage? A property-management company in the area should have these aggregated.
- How much new for-sale + rental construction is in the pipeline within 1–3 miles? Heavy new supply typically softens prices + rents 12–24 months out; constrained supply supports both.
Investment metrics
- 1% rule
- 1.88% ✓
- Cap rate
- 15.86%
- Cash-on-cash
- 34.17%
- DSCR
- 2.52
- GRM
- 4.4
CMA / ARV
- ARV (on-the-fly)
- $90,720
- Comps found
- 4
Show comp detail 4 sales within ~0.75 mi
| Address | Dist | Beds/Ba | Sqft | Sold | Price | $/sf | Match |
|---|---|---|---|---|---|---|---|
| 1354 Elliott Rd #23 | 0.68mi | 2/1.0 | 728 (+1%) | 1mo | $85,000 | $117 | 66 |
| 1525 Millwood Ln | 0.43mi | 2/1.0 | 756 (+5%) | 12mo | $185,000 | $245 | 61 |
| 1348 Elliott #2 | 0.69mi | 2/1.0 | 780 (+8%) | 2mo | $97,990 | $126 | 53 |
| 1280 Wagstaff #1 | 0.48mi | 2/1.0 | 640 (-11%) | 20mo | $47,000 | $73 | 43 |
Match score weights: distance 35% · size 25% · config 20% · recency 20%. Top-matched comps best support the ARV.
Projected returns pro-forma
-3.0% appreciation · 6.37% rent growth · sell at horizon
- IRR
- 33.3%
- Equity multiple
- 2.47×
- Total profit
- $28,847
- Equity at exit
- $10,437
- IRR
- 42.1%
- Equity multiple
- 5.66×
- Total profit
- $91,305
- Equity at exit
- $6,052
Cash invested: $19,600 (down + closing). Projections, not guarantees.
Landlord ↔ Tenant lean methodology
- Overall (STATE)
- 18 Strongly Tenant-Friendly
- State California
- 18 Strongly Tenant-Friendly · D+13
- County
- — inherits STATE
- City
- — inherits STATE
ZIP-level market 95969
- Rents YoY
- 6.4%
- Active inventory
- 481
- Price-to-rent
- 4.4×
Monthly cashflow live
- Estimated rent
- $1,319 medium interval (Pro) →
- Mortgage (P&I)
- −$367
- Tax est. 1.5%
- −$88 /mo · $1,050/yr
- Insurance
- −$29
- HOA
- −$0
- Vacancy / Maint / Mgmt
- −$277
- Net cashflow
- $558
Break-even live
UW: 25.0% down · 7.5% · 30yr · 1.5% tax · 5.0% vac · 8.0% maint · 8.0% mgmt
Financing live
Cash to close
- Down payment
- $17,500
- Closing costs
- $2,100
- Reserves months
- —
- Total cash needed
- —
Loan-product check · same deal, 3 products live
Conventional
25% down · 7.5% · 30yr
- Down + closing
- —
- Monthly P&I
- —
- Monthly cashflow
- —
- DSCR
- —
- Eligible?
- —
Personal DTI + credit; lowest rate.
DSCR
20% down · 8.5% · 30yr
- Down + closing
- —
- Monthly P&I
- —
- Monthly cashflow
- —
- DSCR
- —
- Eligible?
- —
No personal income docs; deal must DSCR.
Hard money
10% down · 12.0% · 12mo
- Down + closing
- —
- Monthly P&I
- —
- Monthly cashflow
- —
- DSCR
- —
- Eligible?
- —
Short-term bridge; refi at stabilization.
Rent comps 3 comps
| Address | Beds | Baths | Sqft | Rent | $/sqft | DOM | Units | Dist |
|---|---|---|---|---|---|---|---|---|
| 1090 Shadowbrook Way Paradise, CA | 1.0 | 1.0 | 640 | $1,150 | $1.80 | 13d | 2 | 0.94mi |
| 443 Nunneley Rd Apt D Paradise, CA | 1.0 | 1.0 | 560 | $1,250 | $2.23 | 43d | 1 | 1.28mi |
| 5848 Black Olive Dr Unit 758 Willow A Paradise, CA | 1.0 | 1.0 | 711 | $1,325 | $1.86 | 43d | 1 | 1.50mi |
Listing history 21 events
-
2026-06-19days on market $70,000 Active 22 DOM
-
2026-06-18days on market $70,000 Active 21 DOM
-
2026-06-17days on market $70,000 Active 20 DOM
-
2026-06-16days on market $70,000 Active 19 DOM
-
2026-06-15days on market $70,000 Active 18 DOM
-
2026-06-14days on market $70,000 Active 16 DOM
-
2026-06-13days on market $70,000 Active 15 DOM
-
2026-06-10days on market $70,000 Active 13 DOM
-
2026-06-09days on market $70,000 Active 12 DOM
-
2026-06-08days on market $70,000 Active 11 DOM
-
2026-06-07days on market $70,000 Active 10 DOM
-
2026-06-05days on market $70,000 Active 7 DOM
-
2026-06-03days on market $70,000 Active 6 DOM
-
2026-06-02days on market $70,000 Active 5 DOM
-
2026-06-01days on market $70,000 Active 4 DOM
-
2026-05-31days on market $70,000 Active 3 DOM
-
2026-05-30days on market $70,000 Active 2 DOM
-
2026-05-29status Active
-
2026-05-28$70,000 Active
-
2026-05-28historical
-
2026-05-25historical $70,000
ⓘ Source: listings_history table (triggers on properties + properties_extension) + one-shot
backfill from property_details.listing_events for pre-trigger history.
Nearby sold comps map
Loading sold comps map…
Walkable amenities ~0.75 mi
Loading nearby amenities…
Taxation est. · year 1
- Rental income
- $15,826
- − Mortgage interest
- −$3,921
- − Property taxes
- −$1,050
- − Insurance
- −$350
- − Repairs & maintenance
- −$1,266
- − Management
- −$1,266
- − Depreciation
- −$2,036
- Taxable income
- $5,936
- Est. tax owed @ 24.0%
- −$1,425
- After-tax cash flow
- $5,273/yr
For passive investors: Depreciation is non-cash, so a rental often shows a tax loss while cash-flowing — sheltering income. Rental losses are passive: they offset passive income freely, and up to $25,000/yr can offset ordinary (W-2) income if you actively participate and your MAGI is under $100k (phasing out to $0 by $150k); unused losses carry forward. On sale, claimed depreciation is recaptured at up to 25%, and gains may owe capital-gains tax (a 1031 exchange can defer both). Figures are a year-1 estimate at your 24.0% rate — not tax advice; consult a CPA.
Schools (NCES district)
No district data.
Livability — Paradise
- Score
- 61/100
- State rank
- #541
- US rank
- #18039
Category grades
Schools grade is shown separately in the Schools card above.
Census & demographics
- Census place
- Paradise, CA
- County
- Butte County · 175,030 people
- City population
- 8,339
- Metro
- Chico, CA
- Population (ZIP)
- 8,339
- Household income
- $69,067
- Rent vs Own
- Severe rent burden
- 218.0
Population outlook (Butte County) Hauer SSP2
- Today (2025)
- 237,527 people
- By 2030
- 243,804 · +2.6%
- By 2040
- 253,899 · +6.9%
- By 2050
- 262,561 · +10.5%
- By 2075
- 283,709 · +19.4%
- By 2100
- 282,689 · +19.0%
Race, ethnicity, and origin ACS 2023
- Neighborhood character
- Predominantly White (82%)
- Race & ethnicity
- White 82% Two or more races 11% Hispanic / Latino 8% Asian 2% Native American 1%
- Hispanic origin (detail)
- Mexican 7%
- Common ancestry
- Iranian 7% Lithuanian 4% Italian 2%
- Foreign-born
- 3% · Canada, China
- Languages at home
- 94% English-only · Spanish 4% Chinese 1%
Political lean MEDSL · Butte
- 2024 margin
- Toss-up / Even · D 46.8% · R 49.9% · Other 3.3%
- 2008→2024 swing
- -5.5pp toward R · 2008: 2.4pp · 2024: -3.1pp
- All cycles
- 2024: R+3.1 2020: D+1.7 2016: R+4.0 2012: R+3.9 2008: D+2.4
Not yet ingested
- Civics
- —
Market trends
- HPI YoY
- ▼ -410.40%
- Current HPI
- 102.8367
- Rent YoY
- ▲ 6.37%
- Metro
- Chico, CA
- State GDP YoY
- ▲ 3.21%
- F500 in state
- 116
Industry mix (Fortune 500 HQ in CA)
| Industry | F500 HQs | Revenue |
|---|---|---|
| Technology | 27 | $1,492B |
|
||
| Financial Services | 3 | $174B |
|
||
| Retail | 3 | $44B |
|
||
| Insurance | 3 | $26B |
|
||
| Media / Entertainment | 2 | $115B |
|
||
| Pharmaceuticals / Biotech | 2 | $62B |
|
||
Price history
+0.0% since first listed4 events — show timeline
- 2026-05-29 Relisted — CRMLS
- 2026-05-28 Listed $70,000 CRMLS
- 2026-05-28 Listing Removed — CRMLS
- 2026-05-25 Coming Soon $70,000 CRMLS
Property tax history
-1.2%/yrLatest (2018): $52 · -9.6% YoY. Source: county tax records.
Cash-flow waterfall
monthlySold comps — $/sqft
last 12 mo · ≤1 miLoading sold comps…