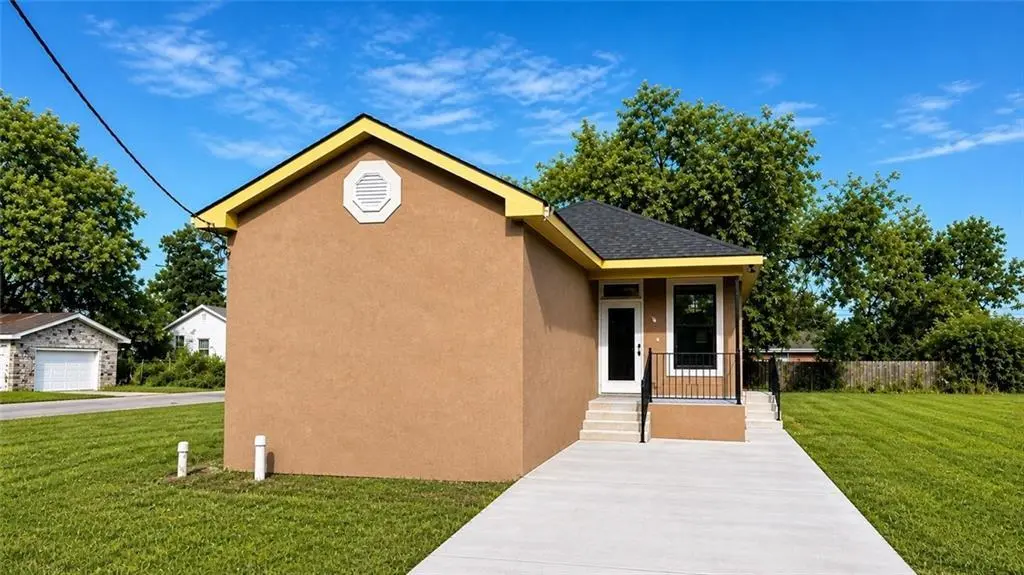
1337 Charbonnet St · New Orleans, LA
Flood risk 8/10 · Major
- FEMA flood zone
- X (shaded)
- Chance of flooding over 30 yrs
- 0.6%
- Est. flood insurance / yr
- $507 – $1,088
Fire risk 1/10 · Minimal
- Est. fire insurance / yr
- $1,269 – $2,357
Heat risk 10/10 · Severe
- Hot days now (above 108°F)
- 7 days/yr
- Hot days in 30 yrs
- 21 days/yr
Wind risk 10/10 · Severe
- Chance of severe wind over 30 yrs
- 99.0%
Air-quality risk 3/10 · Minor
- Unhealthy air days now
- 3 days/yr
- Unhealthy air days in 30 yrs
- 3 days/yr
Risk factors via First Street. Map © Google.
Why this score? — see what drove the F grade
The composite is a weighted blend of 9 inputs, each scored 0–100. Each bar is that input's sub-score; the figure is the points it added to the 100-point composite (weight × sub-score).
- Cash flow +9.5/30.0
- Livability +4.0/5.0
- ARV discount +3.9/15.0
- Rent growth +3.1/5.0
- 1% rule +2.9/10.0
- DSCR +2.7/10.0
- Condition / age +2.5/5.0
- Schools +1.6/10.0
- Appreciation +0.0/10.0
$217,000
🖨 Deal sheet 📄 Offer letter ✓ Due diligence
Listing remarks MLS
Price Improvement! Seller willing to contribute toward buyer closing costs with acceptable offer. Located in the Lower Ninth Ward of New Orleans, this well-built home features durable concrete exterior walls designed for energy efficiency and added storm resilience helping keep utility costs low while offering peace of mind. Elevated entry, off-street parking, and modern curb appeal complete the package. Per current FEMA maps, the property is in Flood Zone X (shaded) outside of the Special Flood Hazard Area; though buyers should verify with their lender and insurer. Schedule your showing today!
Key facts
- Elevated entry
- Storm resilience
- Energy efficiency
Tags
Property features AI
Finance
- HOA & community: Has home warranty
Exterior
- Parking: Off-street parking; One assigned space; Two spaces available
- Utilities: Public water; Public sewer
- Home design: Single-story; New construction; Raised foundation; Shingle roof; Concrete construction
- Construction: Built new (new construction); Concrete construction; Raised foundation; Shingle roof
- Exterior features: Porch; Rectangular lot; Located outside city limits
Interior
- Kitchen: Cooktop; Dishwasher; Microwave; Oven; Range
- Bedrooms: 3 rooms total (bedroom count not specified separately)
- Bathrooms: 2 full bathrooms
- Heating & cooling: Central heating; Central air
- Interior features: Ceiling fan(s)
- Laundry & utility: Washer hookup; Dryer hookup
Neighborhood map
What this means for you Summary
Snapshot
- This is a 3-bed/2.0-bath land listed at $217k.
Deal economics
- At list price, monthly cash flow is $-217 ($-3k/yr) — negative.
- To cash-flow at today's rent, offer at most $186k (14.4% below list).
- To meet the 1% rule (rent ≥ 1% of price), the offer needs to be $171k (21.3% below list).
- Recommended offer: $171k (21.3% below list) — sets the bar for 1% rule.
- Cap rate 5.5% vs local median 4.4% in New Orleans — meaningfully above typical; check what's discounted (condition, days-on-market, listing class) to confirm the premium yield is real.
Location & tenants
- Location reads 81/100 on livability (#3 in LA, #1,383 nationally) — a professional / high-income tenant draw. Strengths: amenities A+, commute A+, health & safety A+; Watch: crime C-, employment D.
- Orleans Parish (urban): math 11% / reading 27% proficiency, ranked #69 of 98 in LA (top 70%) — low school quality limits family demand, transient renter base, plan for 1-2y turnover; 68% free/reduced lunch — lower-income household profile, screen leases tightly.
- Market conditions: Rents rising (+2.5%/yr); 581 active listings in the ZIP; 40 comparable units currently listed for rent nearby; rentals at typical pace (median 21d on market — plan ~3-4 weeks tenant-placement turnaround); 710 units permitted in Orleans Parish in 2024 (244 in 5+ unit buildings).
- This rent runs 45% of the median local income ($46k/yr) — at the standard rent-burdened threshold; future hikes will face affordability resistance.
Forward outlook
- Local home prices are declining (-3.0%/yr); year-one equity from $2k of loan paydown is wiped out by about $7k of value loss. Plan a longer hold.
- Orleans County population projected at +61% by 2050 — long-run rental-demand tailwind backs the buy-and-hold thesis.
Negotiation context
- It's been on market 50 days — a 3% lower offer ($210k) is reasonable based on typical stale-listing flexibility.
- 2 sale attempts with the ask held roughly flat each time — persistent listings suggest the price (not the market) is what's stuck; bring a comps-based counter.
Risks & watch-outs
- Watch-outs: flood insurance adds $66/mo.
- Climate carrying-cost: severe flood risk; severe wind risk, 99% chance of damaging wind over 30y; extreme-heat days projected 7→21/yr by 2055 (HVAC capex compounding) — expect insurance premiums to compound above CPI over the hold.
Questions for the listing agent
- What do current leases actually rent for vs. the listed asking? Can we see a recent rent roll and the last 12 months of T-12 income?
- It's been on market 50 days. Have you received any prior offers? Is the seller open to a 21% concession, seller financing, or rate buy-down credit?
- What's the actual annual flood-insurance premium (NFIP or private), and is the property in a SFHA with mandatory coverage?
- Is there a deadline driving the sale (1031 exchange, divorce, estate, relocation)? That informs how much negotiation room exists.
- The area grade is low — what's the realistic commute time and amenity access for the typical tenant pool here? Any planned neighborhood developments (good or bad) we should know about?
- What's the average days-on-market for RENTAL listings here right now (not sales)? A rising rental-DOM trend means longer vacancies and softer asking-rent achievability than the comps imply.
- What's the recent tenant-quality profile in this submarket — average credit score on applications, eviction rate, late-payment / NSF rate, and stable-employment percentage? A property-management company in the area should have these aggregated.
- How much new for-sale + rental construction is in the pipeline within 1–3 miles? Heavy new supply typically softens prices + rents 12–24 months out; constrained supply supports both.
Investment metrics
- 1% rule
- 0.79% ✗
- Cap rate
- 5.46%
- Cash-on-cash
- -2.96%
- DSCR
- 0.87
- GRM
- 10.6
CMA / ARV
- ARV (median comp)
- $200,954
- List price
- $217,000
- Delta
- 7.98%
- Verdict
- FAIR
- Comps
- 20 within 1.0 mi
Projected returns pro-forma
-3.0% appreciation · 2.49% rent growth · sell at horizon
- IRR
- -24.1%
- Equity multiple
- 0.18×
- Total profit
- $-49,761
- Equity at exit
- $32,355
- IRR
- -20.7%
- Equity multiple
- -0.06×
- Total profit
- $-64,363
- Equity at exit
- $18,762
Cash invested: $60,760 (down + closing). Projections, not guarantees.
Landlord ↔ Tenant lean methodology
- Overall (STATE)
- 90 Strongly Landlord-Friendly
- State Louisiana
- 90 Strongly Landlord-Friendly · R+12
- County
- — inherits STATE
- City
- — inherits STATE
ZIP-level market 70117
- Rents YoY
- 2.5%
- Active inventory
- 581
- Price-to-rent
- 10.6×
Monthly cashflow live
- Estimated rent
- $1,708 high interval (Pro) →
- Mortgage (P&I)
- −$1,138
- Tax est. 1.5%
- −$271 /mo · $3,255/yr
- Insurance
- −$90
- Flood insurance flood zone
- −$66 /mo · $798/yr
- HOA
- −$0
- Vacancy / Maint / Mgmt
- −$359
- Net cashflow
- $-217
Break-even live
UW: 25.0% down · 7.5% · 30yr · 1.5% tax · 5.0% vac · 8.0% maint · 8.0% mgmt
Financing live
Cash to close
- Down payment
- $54,250
- Closing costs
- $6,510
- Reserves months
- —
- Total cash needed
- —
Loan-product check · same deal, 3 products live
Conventional
25% down · 7.5% · 30yr
- Down + closing
- —
- Monthly P&I
- —
- Monthly cashflow
- —
- DSCR
- —
- Eligible?
- —
Personal DTI + credit; lowest rate.
DSCR
20% down · 8.5% · 30yr
- Down + closing
- —
- Monthly P&I
- —
- Monthly cashflow
- —
- DSCR
- —
- Eligible?
- —
No personal income docs; deal must DSCR.
Hard money
10% down · 12.0% · 12mo
- Down + closing
- —
- Monthly P&I
- —
- Monthly cashflow
- —
- DSCR
- —
- Eligible?
- —
Short-term bridge; refi at stabilization.
Rent comps 40 comps
| Address | Beds | Baths | Sqft | Rent | $/sqft | DOM | Units | Dist |
|---|---|---|---|---|---|---|---|---|
| 1314 Lamanche St New Orleans, LA | 4.0 | 1.0 | 1300 | $2,100 | $1.62 | 16d | 1 | 0.08mi |
| 1301 Lamanche St New Orleans, LA | 3.0 | 2.0 | 1090 | $1,600 | $1.47 | 3d | 1 | 0.09mi |
| 1301 Lamanche St New Orleans, LA | 3.0 | 2.0 | 1090 | $1,600 | $1.47 | 3d | 1 | 0.09mi |
| 1301 Lamanche St New Orleans, LA | 3.0 | 2.0 | 1178 | $1,600 | $1.36 | 23d | 1 | 0.09mi |
| 1327 Fats Domino Ave Unit A New Orleans, LA | 3.0 | 2.0 | 1200 | $1,900 | $1.58 | 3d | 1 | 0.10mi |
| 1327 Fats Domino Ave Unit B New Orleans, LA | 4.0 | 2.0 | 1200 | $2,200 | $1.83 | 16d | 1 | 0.10mi |
| 1313 Flood St Unit A New Orleans, LA | 3.0 | 1.0 | — | $1,300 | — | 23d | 1 | 0.16mi |
| 5805 Saint Claude Ave New Orleans, LA | 2.0 | 1.0 | 800 | $1,200 | $1.50 | 23d | 1 | 0.21mi |
| 1201 Gordon St New Orleans, LA | 3.0 | 2.5 | 1367 | $1,900 | $1.39 | 17d | 1 | 0.21mi |
| 5900 N Derbigny St Unit 1 New Orleans, LA | 3.0 | 2.0 | 1000 | $1,950 | $1.95 | 3d | 1 | 0.21mi |
| 1449 Andry St New Orleans, LA | 2.0 | 1.0 | 833 | $1,300 | $1.56 | 23d | 1 | 0.26mi |
| 6002 Saint Claude Ave New Orleans, LA | 2.0 | 2.0 | 965 | $1,275 | $1.32 | 21d | 1 | 0.28mi |
| 1030 Gordon St New Orleans, LA | 2.0 | 1.0 | 675 | $1,200 | $1.78 | 3d | 1 | 0.28mi |
| 1030 Gordon St New Orleans, LA | 2.0 | 1.0 | 675 | $12,000 | $17.78 | 43d | 1 | 0.28mi |
| 1030 Gordon St New Orleans, LA | 2.0 | 1.0 | 675 | $1,200 | $1.78 | 3d | 1 | 0.28mi |
| 5461 Saint Claude Ave New Orleans, LA | 4.0 | 2.0 | 1250 | $2,350 | $1.88 | 23d | 1 | 0.28mi |
| 1422 Andry St New Orleans, LA | 3.0 | 2.0 | 1100 | $1,400 | $1.27 | 3d | 1 | 0.29mi |
| 5459 Saint Claude Ave Unit 5461 New Orleans, LA | 4.0 | 2.0 | 1454 | $2,350 | $1.62 | 23d | 1 | 0.29mi |
| 1810 Fats Domino Ave New Orleans, LA | 2.0 | 2.0 | 975 | $916 | $0.94 | 23d | 1 | 0.33mi |
| 1334 Tricou St New Orleans, LA | 2.0 | 1.0 | 1117 | $1,500 | $1.34 | 21d | 1 | 0.33mi |
| 18 Saint Claude Ct New Orleans, LA | 3.0 | 1.0 | 864 | $1,200 | $1.39 | 11d | 1 | 0.36mi |
| 1925 Alabo St Unit A New Orleans, LA | 3.0 | 2.0 | 1199 | $1,500 | $1.25 | 21d | 1 | 0.37mi |
| 6038 N Rampart St New Orleans, LA | 3.0 | 2.0 | 1080 | $1,795 | $1.66 | 23d | 1 | 0.38mi |
| 925 Flood St Unit 925 New Orleans, LA | 3.0 | 1.0 | — | $1,200 | — | 23d | 1 | 0.38mi |
| 1420 Delery St New Orleans, LA | 2.0 | 1.0 | 900 | $1,250 | $1.39 | 11d | 1 | 0.39mi |
| 1903 Flood St New Orleans, LA | 3.0 | 2.0 | — | $1,880 | — | 3d | 1 | 0.39mi |
| 1714 Tricou St New Orleans, LA | 3.0 | 2.0 | 1271 | $1,900 | $1.49 | 23d | 1 | 0.40mi |
| 1835 Andry St New Orleans, LA | 3.0 | 2.0 | 918 | $1,800 | $1.96 | 23d | 1 | 0.42mi |
| 906 Flood St New Orleans, LA | 3.0 | 3.0 | 1174 | $1,700 | $1.45 | 2d | 1 | 0.42mi |
| 1901 Tupelo St New Orleans, LA | 3.0 | 2.5 | 1568 | $2,300 | $1.47 | 3d | 1 | 0.43mi |
| 1824 Saint Maurice Ave New Orleans, LA | 4.0 | 2.0 | 1500 | $1,500 | $1.00 | 23d | 1 | 0.43mi |
| 5450 Burgundy St New Orleans, LA | 2.0 | 1.0 | 1474 | $1,250 | $0.85 | 23d | 1 | 0.45mi |
| 6019 Royal St New Orleans, LA | 2.0 | 1.0 | 790 | $1,200 | $1.52 | 23d | 1 | 0.53mi |
| 1333 Angela Ave Arabi, LA | 3.0 | 2.0 | 1090 | $1,850 | $1.70 | 2d | 1 | 0.58mi |
| 5109 Burgundy St New Orleans, LA | 2.0 | 1.0 | 1122 | $1,474 | $1.31 | 17d | 1 | 0.58mi |
| 918 Forstall St New Orleans, LA | 2.0 | 1.0 | 800 | $2,290 | $2.86 | 23d | 1 | 0.60mi |
| 920 Forstall St New Orleans, LA | 2.0 | 1.0 | 800 | $1,600 | $2.00 | 23d | 1 | 0.60mi |
| 5317 N Galvez St New Orleans, LA | 2.0 | 1.0 | 796 | $1,275 | $1.60 | 3d | 1 | 0.60mi |
| 1015 Government St Unit 11 Arabi, LA | 2.0 | 1.0 | 720 | $999 | $1.39 | 43d | 1 | 0.61mi |
| 716 Delery St Unit 716 New Orleans, LA | 2.0 | 1.0 | 900 | $1,200 | $1.33 | 23d | 1 | 0.62mi |
Listing history 17 events
-
2026-06-18days on market $217,000 Active 50 DOM
-
2026-06-17days on market $217,000 Active 49 DOM
-
2026-06-16days on market $217,000 Active 48 DOM
-
2026-06-15days on market $217,000 Active 47 DOM
-
2026-06-13days on market $217,000 Active 45 DOM
-
2026-06-10days on market $217,000 Active 42 DOM
-
2026-06-09days on market $217,000 Active 41 DOM
-
2026-06-08days on market $217,000 Active 40 DOM
-
2026-06-07remarks 601-char remark
-
2026-06-07pricedays on market $217,000 Active 39 DOM
-
2026-06-05days on market $220,000 Active 36 DOM
-
2026-06-03days on market $220,000 Active 35 DOM
-
2026-06-02days on market $220,000 Active 34 DOM
-
2026-06-01days on market $220,000 Active 33 DOM
-
2026-05-31days on market $220,000 Active 32 DOM
-
2026-04-29$220,000 Active 503-char remark
Show marketing remark (601 chars)
Price Improvement! Seller willing to contribute toward buyer closing costs with acceptable offer. Located in the Lower Ninth Ward of New Orleans, this well-built home features durable concrete exterior walls designed for energy efficiency and added storm resilience helping keep utility costs low while offering peace of mind. Elevated entry, off-street parking, and modern curb appeal complete the package. Per current FEMA maps, the property is in Flood Zone X (shaded) outside of the Special Flood Hazard Area; though buyers should verify with their lender and insurer. Schedule your showing today!
ⓘ Source: listings_history table (triggers on properties + properties_extension) + one-shot
backfill from property_details.listing_events for pre-trigger history.
Climate risk First Street
- Flood 8/10 Severe FEMA zone X (shaded) · 60% chance over 30 yrs
- Wildfire 1/10 Low
- Heat 10/10 Extreme 7 d/yr ≥108°F today · 21 d/yr by 30 yrs out
- Wind 10/10 Extreme 99% chance of damaging wind over 30 yrs
- Air quality 3/10 Moderate 3 unhealthy d/yr today · 3 by 30 yrs out
Nearby sold comps map
Loading sold comps map…
Walkable amenities ~0.75 mi
Loading nearby amenities…
Taxation est. · year 1
- Rental income
- $20,499
- − Mortgage interest
- −$12,155
- − Property taxes
- −$3,255
- − Insurance
- −$1,882
- − Repairs & maintenance
- −$1,640
- − Management
- −$1,640
- − Depreciation
- −$6,313
- Taxable loss
- −$6,386
- Est. tax savings @ 24.0%
- +$1,533
- After-tax cash flow
- $-1,066/yr
For passive investors: Depreciation is non-cash, so a rental often shows a tax loss while cash-flowing — sheltering income. Rental losses are passive: they offset passive income freely, and up to $25,000/yr can offset ordinary (W-2) income if you actively participate and your MAGI is under $100k (phasing out to $0 by $150k); unused losses carry forward. On sale, claimed depreciation is recaptured at up to 25%, and gains may owe capital-gains tax (a 1031 exchange can defer both). Figures are a year-1 estimate at your 24.0% rate — not tax advice; consult a CPA.
Schools (NCES district)
- District
- Orleans Parish
- NCES district ID
- 2201170
- Math proficiency
- 11% ▼ -52.00%
- Reading proficiency
- 27% ▼ -46.00%
- Median HH income
- $37,011
- Composite
- 15.78/100
- National rank
- #9271
- State rank
- #69 of 98 in LA
Livability — New Orleans
- Score
- 81/100
- State rank
- #3
- US rank
- #1383
Category grades
Schools grade is shown separately in the Schools card above.
Census & demographics
- Census place
- New Orleans, LA
- County
- Orleans Parish · 338,817 people
- City population
- 338,817
- Metro
- New Orleans-Metairie, LA
- Population (ZIP)
- 25,652
- Household income
- $45,764
- Rent vs Own
- Severe rent burden
- 1988.0
Population outlook (Orleans County) Hauer SSP2
- Today (2025)
- 513,025 people
- By 2030
- 575,781 · +12.2%
- By 2040
- 700,174 · +36.5%
- By 2050
- 826,541 · +61.1%
- By 2075
- 1,123,374 · +119.0%
- By 2100
- 1,355,609 · +164.2%
Race, ethnicity, and origin ACS 2023
- Neighborhood character
- Majority Black (60%)
- Race & ethnicity
- Black 60% White 30% Two or more races 6% Hispanic / Latino 5%
- Common ancestry
- Lithuanian 5% Italian 1% Romanian 1%
- Foreign-born
- 5% · Canada, South Korea
- Languages at home
- 93% English-only · Spanish 3% Other Indo-European 1% French/Haitian/Cajun 1%
Political lean MEDSL · Orleans
- 2024 margin
- Solid D (+67.0) · D 82.2% · R 15.2% · Other 2.7%
- 2008→2024 swing
- +6.7pp toward D · 2008: 60.3pp · 2024: 67.0pp
- All cycles
- 2024: D+67.0 2020: D+68.2 2016: D+66.2 2012: D+62.5 2008: D+60.3
Not yet ingested
- Civics
- —
Market trends
- HPI YoY
- ▼ -177.22%
- Current HPI
- 184.6061
- Rent YoY
- ▲ 2.49%
- Metro
- New Orleans-Metairie, LA
- State GDP YoY
- ▲ 3.29%
- F500 in state
- 10
Industry mix (Fortune 500 HQ in LA)
| Industry | F500 HQs | Revenue |
|---|---|---|
| Telecommunications | 2 | $23B |
|
||
| Utilities | 1 | $12B |
|
||
| Wholesale / Distribution | 1 | $5B |
|
||
| Advertising | 1 | $2B |
|
||
Price history
-1.4% since first listed4 events — show timeline
- 2026-06-06 Price Changed $217,000 AcadianaMLS
- 2026-06-06 Price Changed $217,000 GSREIN
- 2026-04-29 Listed $220,000 GSREIN
- 2026-04-29 Listed $220,000 AcadianaMLS
Property tax history
-0.3%/yrLatest (2015): $89 · -0.3% YoY. Source: county tax records.
Cash-flow waterfall
monthlySold comps — $/sqft
last 12 mo · ≤1 miLoading sold comps…