 🏗️ New Construction
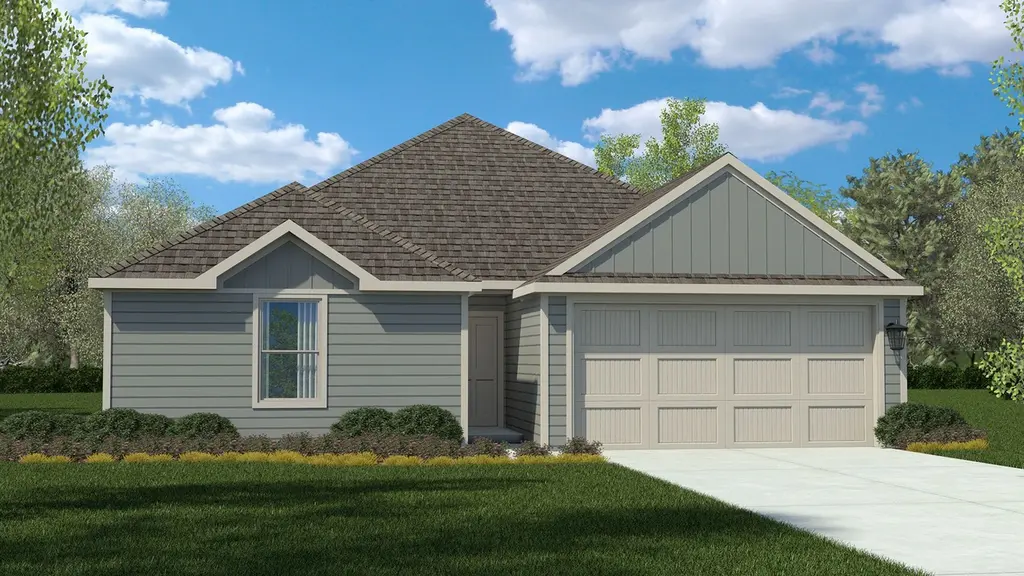
BELLVUE Plan · Godley, TX
Flood risk 1/10 · Minimal
- FEMA flood zone
- X (unshaded)
- Chance of flooding over 30 yrs
- 0.0%
- Est. flood insurance / yr
- $507 – $1,088
Fire risk 6/10 · Moderate
- Est. fire insurance / yr
- $1,222 – $2,270
Heat risk 7/10 · Major
- Hot days now (above 109°F)
- 7 days/yr
- Hot days in 30 yrs
- 22 days/yr
Wind risk 6/10 · Moderate
- Chance of severe wind over 30 yrs
- 27.0%
Air-quality risk 2/10 · Minimal
- Unhealthy air days now
- 1 days/yr
- Unhealthy air days in 30 yrs
- 2 days/yr
Risk factors via First Street. Map © Google.
Why this score? — see what drove the D grade
The composite is a weighted blend of 9 inputs, each scored 0–100. Each bar is that input's sub-score; the figure is the points it added to the 100-point composite (weight × sub-score).
- Cash flow +14.7/30.0
- ARV discount +7.5/15.0
- DSCR +4.5/10.0
- 1% rule +4.1/10.0
- Condition / age +3.8/5.0
- Livability +3.7/5.0
- Schools +3.2/10.0
- Rent growth +2.5/5.0
- Appreciation +0.0/10.0
$279,990
🖨 Deal sheet 📄 Offer letter ✓ Due diligence
Listing remarks
The Bellvue is a thoughtfully designed single-story home offering approximately 1,405 sq. ft. of living space with 3 bedrooms, 2 bathrooms, and a 2-car garage. A welcoming front porch opens into a defined foyer that leads into an open-concept layout where the kitchen, dining nook, and family room come together in one bright, connected living space, ideal for both daily life and entertaining. The kitchen features stainless steel appliances, generous counter space, a centrally located island with sink overlooking the family room, and a walk-in pantry for added storage. Just off the kitchen, the dining nook provides a comfortable space for meals and everyday gathering, flowing seamlessly into
Key facts
- Front porch
- Dining nook
- Open-concept layout
Tags
Property features AI
Finance
- Other: Address: Godley, TX 76044
- Financial info: List price $279,990
Exterior
- Parking: 2 garage spaces (2 total parking spaces)
- Home design: Model/plan home in Godley, TX (BELLVUE)
- Exterior features: Living area approximately 1,405
Interior
- Bedrooms: 3 bedrooms
- Bathrooms: 2 full bathrooms
- Interior features: Plan: BELLVUE (new construction)
Neighborhood map
What this means for you Summary
Snapshot
- This is a 3-bed/2.0-bath single-family listed at $280k. Condition is rated good.
Deal economics
- At list price, monthly cash flow is $68 ($821/yr) — positive.
- The deal already cash-flows at list — no discount required.
- To meet the 1% rule (rent ≥ 1% of price), the offer needs to be $248k (11.3% below list).
- Recommended offer: $248k (11.3% below list) — sets the bar for 1% rule.
- Cap rate 6.6% vs local median 2.8% in Godley — top-decile yield for the area; either an underpriced asset or a hidden risk that comps aren't pricing in. Stress-test before assuming the spread holds.
Location & tenants
- Location reads 73/100 on livability (#226 in TX) — a middle-class / working-renter tenant base. Strengths: crime A+, cost of living A+, housing A+; Watch: schools D+, health & safety D+, amenities F.
- Godley ISD (rural): math 34% / reading 38% proficiency, ranked #466 of 826 in TX (top 56%) — families likely to look elsewhere, expect single-tenant / working-renter base with shorter leases.
- Market conditions: 565 active listings in the ZIP; 6 comparable units currently listed for rent nearby; rentals at typical pace (median 17d on market — plan ~3-4 weeks tenant-placement turnaround); 2,152 units permitted in Johnson County in 2024 (76 in 5+ unit buildings).
Forward outlook
- Local home prices are declining (-3.0%/yr); year-one equity from $2k of loan paydown is wiped out by about $8k of value loss. Plan a longer hold.
- Johnson County population projected at +24% by 2050 — long-run rental-demand tailwind backs the buy-and-hold thesis.
Negotiation context
- Only 12 days on market — expect competitive offers; lowballing is unlikely to land.
Risks & watch-outs
- Climate carrying-cost: major wind risk, 27% chance of damaging wind over 30y; major wildfire risk; extreme-heat days projected 7→22/yr by 2055 (HVAC capex compounding) — expect insurance premiums to compound above CPI over the hold.
Questions for the listing agent
- Is there a deadline driving the sale (1031 exchange, divorce, estate, relocation)? That informs how much negotiation room exists.
- Schools are D-rated, which usually means shorter tenancies and higher turnover. Who's the typical renter profile here, and what's been the actual vacancy rate?
- The area grade is low — what's the realistic commute time and amenity access for the typical tenant pool here? Any planned neighborhood developments (good or bad) we should know about?
- What's the average days-on-market for RENTAL listings here right now (not sales)? A rising rental-DOM trend means longer vacancies and softer asking-rent achievability than the comps imply.
- What's the recent tenant-quality profile in this submarket — average credit score on applications, eviction rate, late-payment / NSF rate, and stable-employment percentage? A property-management company in the area should have these aggregated.
- How much new for-sale + rental construction is in the pipeline within 1–3 miles? Heavy new supply typically softens prices + rents 12–24 months out; constrained supply supports both.
Investment metrics
- 1% rule
- 0.91% ✗
- Cap rate
- 6.59%
- Cash-on-cash
- 1.07%
- DSCR
- 1.05
- GRM
- 9.2
CMA / ARV
- ARV (on-the-fly)
- $273,975
- Comps found
- 12
Show comp detail 12 sales within ~0.75 mi
| Address | Dist | Beds/Ba | Sqft | Sold | Price | $/sf | Match |
|---|---|---|---|---|---|---|---|
| 809 Rodgers Ave | 0.22mi | 3/2.0 | 1,332 (-5%) | 22mo | $324,500 | $244 | 63 |
| 109 Hackberry Ave | 0.37mi | 2/1.0 (-1) | 1,320 (-6%) | 4mo | $235,000 | $178 | 60 |
| 109 S 6th St | 0.62mi | 3/2.0 | 1,375 (-2%) | 9mo | $284,500 | $207 | 60 |
| 241 Amelia Ave | 0.31mi | 3/2.0 | 1,332 (-5%) | 21mo | $319,500 | $240 | 60 |
| 209 W Links Dr | 0.40mi | 3/2.0 | 1,438 (+2%) | 22mo | $279,900 | $195 | 59 |
| 107 S 6th St | 0.61mi | 3/2.0 | 1,332 (-5%) | 6mo | $299,500 | $225 | 58 |
| 300 W Godley Ave | 0.57mi | 3/2.0 | 1,531 (+9%) | 7mo | $265,000 | $173 | 52 |
| 303 N Main St | 0.37mi | 3/2.0 | 1,568 (+12%) | 16mo | $334,900 | $214 | 50 |
| 108 N 2nd St | 0.37mi | 4/3.0 (+1) | 1,574 (+12%) | 8mo | $305,000 | $194 | 47 |
| 520 Highpoint Dr | 0.62mi | 3/2.0 | 1,510 (+8%) | 15mo | $249,000 | $165 | 46 |
| 304 N 5th St | 0.39mi | 3/2.0 | 1,568 (+12%) | 21mo | $224,900 | $143 | 44 |
| 109 S Coleman | 0.65mi | 3/2.0 | 1,248 (-11%) | 12mo | $200,000 | $160 | 41 |
Match score weights: distance 35% · size 25% · config 20% · recency 20%. Top-matched comps best support the ARV.
Projected returns pro-forma
-3.0% appreciation · 3.0% rent growth · sell at horizon
- IRR
- -14.6%
- Equity multiple
- 0.48×
- Total profit
- $-40,000
- Equity at exit
- $40,851
- IRR
- -5.9%
- Equity multiple
- 0.62×
- Total profit
- $-29,066
- Equity at exit
- $23,688
Cash invested: $76,713 (down + closing). Projections, not guarantees.
Landlord ↔ Tenant lean methodology
- Overall (STATE)
- 87 Strongly Landlord-Friendly
- State Texas
- 87 Strongly Landlord-Friendly · R+5
- County
- — inherits STATE
- City
- — inherits STATE
ZIP-level market 76044
- Home prices YoY
- -12.4%
- Active inventory
- 565
- Price-to-rent
- 9.4×
Monthly cashflow live
- Estimated rent
- $2,483 high interval (Pro) →
- Mortgage (P&I)
- −$1,437
- Tax est. 1.5%
- −$342 /mo · $4,110/yr
- Insurance
- −$114
- HOA
- −$0
- Vacancy / Maint / Mgmt
- −$521
- Net cashflow
- $68
Break-even live
UW: 25.0% down · 7.5% · 30yr · 1.5% tax · 5.0% vac · 8.0% maint · 8.0% mgmt
Financing live
Cash to close
- Down payment
- $68,494
- Closing costs
- $8,219
- Reserves months
- —
- Total cash needed
- —
Loan-product check · same deal, 3 products live
Conventional
25% down · 7.5% · 30yr
- Down + closing
- —
- Monthly P&I
- —
- Monthly cashflow
- —
- DSCR
- —
- Eligible?
- —
Personal DTI + credit; lowest rate.
DSCR
20% down · 8.5% · 30yr
- Down + closing
- —
- Monthly P&I
- —
- Monthly cashflow
- —
- DSCR
- —
- Eligible?
- —
No personal income docs; deal must DSCR.
Hard money
10% down · 12.0% · 12mo
- Down + closing
- —
- Monthly P&I
- —
- Monthly cashflow
- —
- DSCR
- —
- Eligible?
- —
Short-term bridge; refi at stabilization.
Rent comps 6 comps
| Address | Beds | Baths | Sqft | Rent | $/sqft | DOM | Units | Dist |
|---|---|---|---|---|---|---|---|---|
| 812 Rodgers Ave Godley, TX | 3.0 | 2.0 | 1747 | $2,600 | $1.49 | 43d | 1 | 0.25mi |
| 644 The Cottages Dr Godley, TX | 3.0 | 2.0 | 1662 | $1,995 | $1.20 | 43d | 1 | 0.44mi |
| 201 Cliff Ct Godley, TX | 3.0 | 2.0 | 1852 | $2,900 | $1.57 | 10d | 1 | 0.52mi |
| 226 Harp Ave Godley, TX | 3.0 | 2.0 | 1737 | $2,400 | $1.38 | 1d | 1 | 0.90mi |
| 920 Elk Ridge Run Godley, TX | 3.0 | 2.0 | 1692 | $2,499 | $1.48 | 16d | 1 | 1.24mi |
| 920 Elk Ridge Run Godley, TX | 3.0 | 2.0 | 1683 | $2,499 | $1.48 | 10d | 1 | 1.24mi |
Listing history 10 events
-
2026-06-18days on market $279,990 Active 12 DOM
-
2026-06-17days on market $279,990 Active 11 DOM
-
2026-06-16days on market $279,990 Active 10 DOM
-
2026-06-15days on market $279,990 Active 9 DOM
-
2026-06-13days on market $279,990 Active 7 DOM
-
2026-06-13days on market $279,990 Active 6 DOM
-
2026-06-09days on market $279,990 Active 3 DOM
-
2026-06-08days on market $279,990 Active 2 DOM
-
2026-06-07remarks 699-char remark
-
2026-06-07$279,990 Active 1 DOM
ⓘ Source: listings_history table (triggers on properties + properties_extension) + one-shot
backfill from property_details.listing_events for pre-trigger history.
Climate risk First Street
- Flood 1/10 Low FEMA zone X (unshaded) · 0% chance over 30 yrs
- Wildfire 6/10 Major
- Heat 7/10 Severe 7 d/yr ≥109°F today · 22 d/yr by 30 yrs out
- Wind 6/10 Major 27% chance of damaging wind over 30 yrs
- Air quality 2/10 Low 1 unhealthy d/yr today · 2 by 30 yrs out
Nearby sold comps map
Loading sold comps map…
Walkable amenities ~0.75 mi
Loading nearby amenities…
Taxation est. · year 1
- Rental income
- $29,800
- − Mortgage interest
- −$15,347
- − Property taxes
- −$4,110
- − Insurance
- −$1,370
- − Repairs & maintenance
- −$2,384
- − Management
- −$2,384
- − Depreciation
- −$7,970
- Taxable loss
- −$3,765
- Est. tax savings @ 24.0%
- +$904
- After-tax cash flow
- $1,725/yr
For passive investors: Depreciation is non-cash, so a rental often shows a tax loss while cash-flowing — sheltering income. Rental losses are passive: they offset passive income freely, and up to $25,000/yr can offset ordinary (W-2) income if you actively participate and your MAGI is under $100k (phasing out to $0 by $150k); unused losses carry forward. On sale, claimed depreciation is recaptured at up to 25%, and gains may owe capital-gains tax (a 1031 exchange can defer both). Figures are a year-1 estimate at your 24.0% rate — not tax advice; consult a CPA.
Condition & rehab AI · 6 photos
The home is in good condition with a well-maintained exterior. It has potential for further value increases through exterior painting, landscaping, and a new front door.
Value-add opportunities
- Both Painting the exterior — Fresh paint can enhance curb appeal and property value
- Both Landscaping the front yard — A well-maintained front yard can improve curb appeal and attract potential buyers
- Both Upgrading the front door — A new front door can improve curb appeal and increase property value
Renovation cost estimate screening
Value-add ROI direction
- Both Painting the exterior — Fresh paint can enhance curb appeal and property value ↑
- Both Landscaping the front yard — A well-maintained front yard can improve curb appeal and attract potential buyers ↑
- Both Upgrading the front door — A new front door can improve curb appeal and increase property value ↑
ⓘ Cost ranges are severity-bucket heuristics (US national rule-of-thumb). Get contractor quotes + a written scope before underwriting a rehab budget.
Schools (NCES district)
- District
- Godley ISD
- NCES district ID
- 4820960
- Math proficiency
- 34% ▼ -4.00%
- Reading proficiency
- 38% ▲ 2.00%
- Median HH income
- $59,332
- Composite
- 32.06/100
- National rank
- #5820
- State rank
- #466 of 826 in TX
Livability — Godley
- Score
- 73/100
- State rank
- #226
- US rank
- #5528
Category grades
Schools grade is shown separately in the Schools card above.
Census & demographics
- Census place
- Godley, TX
- Population (ZIP)
- 8,759
Population outlook (Johnson County) Hauer SSP2
- Today (2025)
- 179,678 people
- By 2030
- 189,208 · +5.3%
- By 2040
- 207,261 · +15.4%
- By 2050
- 223,064 · +24.1%
- By 2075
- 259,979 · +44.7%
- By 2100
- 275,395 · +53.3%
Race, ethnicity, and origin ACS 2023
- Neighborhood character
- Predominantly White (76%)
- Race & ethnicity
- White 76% Hispanic / Latino 19% Two or more races 9% Black 3%
- Hispanic origin (detail)
- Mexican 14%
- Common ancestry
- Slovak 2% Romanian 1% Iranian 1%
- Foreign-born
- 4% · Canada
- Languages at home
- 88% English-only · Spanish 11%
Political lean MEDSL · Johnson
- 2024 margin
- Solid R (+51.4) · D 23.9% · R 75.3%
- 2008→2024 swing
- -3.9pp toward R · 2008: -47.5pp · 2024: -51.4pp
- All cycles
- 2024: R+51.4 2020: R+53.0 2016: R+58.3 2012: R+55.6 2008: R+47.5
Not yet ingested
- Civics
- —
Market trends
- HPI YoY
- ▼ -36.58%
- Current HPI
- 259.1029
- Rent YoY
- —
- Metro
- —
- State GDP YoY
- ▲ 3.95%
- F500 in state
- 110
Industry mix (Fortune 500 HQ in TX)
| Industry | F500 HQs | Revenue |
|---|---|---|
| Energy | 16 | $1,198B |
|
||
| Technology | 5 | $198B |
|
||
| Engineering / Construction | 4 | $72B |
|
||
| Energy Services | 3 | $60B |
|
||
| Utilities | 3 | $41B |
|
||
| Healthcare | 2 | $330B |
|
||
Cash-flow waterfall
monthlySold comps — $/sqft
last 12 mo · ≤1 miLoading sold comps…