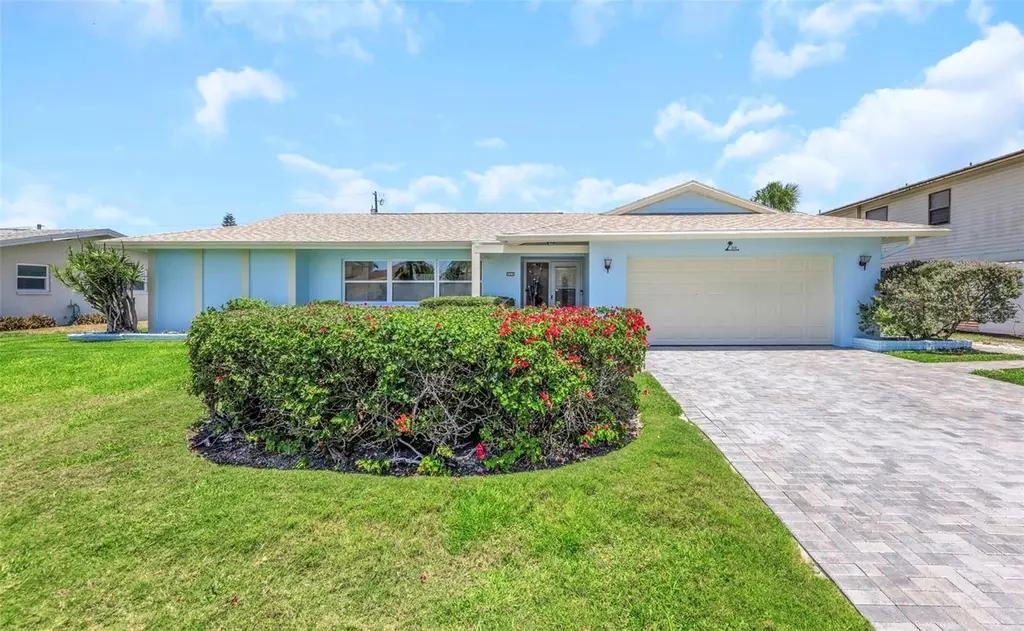
111 24th St · Belleair Beach, FL
Flood risk 9/10 · Severe
- FEMA flood zone
- AE
- Chance of flooding over 30 yrs
- 0.99%
- Est. flood insurance / yr
- $1,737 – $8,500
Fire risk 1/10 · Minimal
- Est. fire insurance / yr
- $947 – $1,759
Heat risk 10/10 · Severe
- Hot days now (above 107°F)
- 7 days/yr
- Hot days in 30 yrs
- 25 days/yr
Wind risk 10/10 · Severe
- Chance of severe wind over 30 yrs
- 99.0%
Air-quality risk 3/10 · Minor
- Unhealthy air days now
- 2 days/yr
- Unhealthy air days in 30 yrs
- 3 days/yr
Risk factors via First Street. Map © Google.
Why this score? — see what drove the C- grade
The composite is a weighted blend of 9 inputs, each scored 0–100. Each bar is that input's sub-score; the figure is the points it added to the 100-point composite (weight × sub-score).
- Cash flow +17.0/30.0
- ARV discount +15.0/15.0
- DSCR +5.3/10.0
- Schools +4.3/10.0
- 1% rule +3.4/10.0
- Livability +3.2/5.0
- Rent growth +2.5/5.0
- Condition / age +2.5/5.0
- Appreciation +0.0/10.0
$649,900
🖨 Deal sheet 📄 Offer letter ✓ Due diligence
Listing remarks
Under contract-accepting backup offers. Nestled in the highly coveted Belleair Beach community and just a short stroll to the pristine Gulf beaches, this beautiful 3-bedroom, 2 full bath single-family residence offers the perfect blend of coastal charm and modern comfort. Situated on an oversized lot, this home has been thoughtfully enhanced with an updated kitchen, stylish newer flooring, and fresh exterior paint, creating a light and inviting atmosphere throughout. The spacious enclosed Florida room provides the perfect extension of living space for entertaining, relaxing, or enjoying the coastal lifestyle year-round. Recent improvements provide peace of mind, including a newer water heat
Key facts
- Relaxing hot tub
- Newer water heater
- Updated kitchen
Tags
Property features AI
Finance
- Other: Homestead property; Furnished status negotiable
- HOA & community: No association indicated
Exterior
- Parking: Attached 2-car garage with garage door opener
- Utilities: Public water; Public sewer; Electricity connected
- Home design: Single family residence; Residential property; One story; North-facing
- Construction: Block construction; Shingle roof; Slab foundation; Built area listed from public records
- Exterior features: Landscaped lot; Paved surfaces; Enclosed patio/porch; Vinyl fencing; Public maintained road access; Street lights in community
Interior
- Kitchen: Dishwasher; Refrigerator; Electric water heater
- Bedrooms: 3 bedrooms
- Flooring: Tile
- Bathrooms: 2 full bathrooms
- Heating & cooling: Electric heating; Central air conditioning
- Interior features: Ceiling fans; Window treatments; Enclosed Florida room
- Laundry & utility: Washer; Dryer; Laundry area in garage
Neighborhood map
What this means for you Summary
Snapshot
- This is a 3-bed/2.0-bath single-family listed at $650k.
Deal economics
- At list price, monthly cash flow is $11 ($127/yr) — positive.
- The deal already cash-flows at list — no discount required.
- To meet the 1% rule (rent ≥ 1% of price), the offer needs to be $543k (16.5% below list).
- Recommended offer: $543k (16.5% below list) — sets the bar for 1% rule.
Location & tenants
- Location reads 64/100 on livability (#671 in FL) — a middle-class / working-renter tenant base. Strengths: crime A+, employment A+, commute A-; Watch: schools D+, amenities F, cost of living F.
- Pinellas (suburban): math 51% / reading 51% proficiency, ranked #31 of 73 in FL (top 42%) — acceptable for families but not a draw, mixed tenant base, ~2y average lease.
- Market conditions: 61 active listings in the ZIP; 32 comparable units currently listed for rent nearby; rentals leasing fast (median 8d on market — plan ~1-2 weeks tenant-placement turnaround); 2,676 units permitted in Pinellas County in 2024 (1,422 in 5+ unit buildings).
Forward outlook
- Local home prices are declining (-3.0%/yr); year-one equity from $4k of loan paydown is wiped out by about $19k of value loss. Plan a longer hold.
- Pinellas County population projected at +14% by 2050 — modest demand growth; plan on rents tracking national, not racing it.
Negotiation context
- It's been on market 33 days — a 3% lower offer ($630k) is reasonable based on typical stale-listing flexibility.
- Current owner paid $118k; list at $650k implies a 453% gain — meaningful room to come down on a strong offer.
Risks & watch-outs
- Watch-outs: flood insurance adds $427/mo.
- Climate carrying-cost: in FEMA flood zone AE (mandatory federal flood insurance); severe wind risk, 99% chance of damaging wind over 30y; extreme-heat days projected 7→25/yr by 2055 (HVAC capex compounding) — expect insurance premiums to compound above CPI over the hold.
Questions for the listing agent
- It's been on market 33 days. Have you received any prior offers? Is the seller open to a 16% concession, seller financing, or rate buy-down credit?
- Built in 1966 — when were the roof, HVAC, electrical panel, plumbing, and water heater last replaced?
- What's the actual annual flood-insurance premium (NFIP or private), and is the property in a SFHA with mandatory coverage?
- Is there a deadline driving the sale (1031 exchange, divorce, estate, relocation)? That informs how much negotiation room exists.
- Schools are D-rated, which usually means shorter tenancies and higher turnover. Who's the typical renter profile here, and what's been the actual vacancy rate?
- What's the average days-on-market for RENTAL listings here right now (not sales)? A rising rental-DOM trend means longer vacancies and softer asking-rent achievability than the comps imply.
- What's the recent tenant-quality profile in this submarket — average credit score on applications, eviction rate, late-payment / NSF rate, and stable-employment percentage? A property-management company in the area should have these aggregated.
- How much new for-sale + rental construction is in the pipeline within 1–3 miles? Heavy new supply typically softens prices + rents 12–24 months out; constrained supply supports both.
Investment metrics
- 1% rule
- 0.84% ✗
- Cap rate
- 7.10%
- Cash-on-cash
- 2.88%
- DSCR
- 1.13
- GRM
- 10.0
CMA / ARV
- ARV (on-the-fly)
- $947,163
- Comps found
- 6
Show comp detail 6 sales within ~0.75 mi
| Address | Dist | Beds/Ba | Sqft | Sold | Price | $/sf | Match |
|---|---|---|---|---|---|---|---|
| 106 22nd St | 0.13mi | 3/2.0 | 1,960 (-0%) | 8mo | $901,900 | $460 | 87 |
| 2801 Gulf Blvd | 0.22mi | 3/2.0 | 2,028 (+3%) | 10mo | $800,000 | $394 | 75 |
| 110 25th St | 0.02mi | 3/2.0 | 1,902 (-3%) | 24mo | $1,005,000 | $528 | 74 |
| 2513 Gulf Blvd | 0.12mi | 3/2.0 | 1,930 (-2%) | 23mo | $800,000 | $415 | 73 |
| 115 13th St | 0.57mi | 2/2.0 (-1) | 1,862 (-5%) | 3mo | $900,000 | $483 | 58 |
| 1628 Sand Key Estates Ct | 0.72mi | 3/3.5 | 2,114 (+8%) | 17mo | $1,050,000 | $497 | 33 |
Match score weights: distance 35% · size 25% · config 20% · recency 20%. Top-matched comps best support the ARV.
Projected returns pro-forma
-3.0% appreciation · 3.0% rent growth · sell at horizon
- IRR
- -16.2%
- Equity multiple
- 0.42×
- Total profit
- $-104,688
- Equity at exit
- $96,902
- IRR
- -7.9%
- Equity multiple
- 0.50×
- Total profit
- $-90,493
- Equity at exit
- $56,191
Cash invested: $181,972 (down + closing). Projections, not guarantees.
Landlord ↔ Tenant lean methodology
- Overall (STATE)
- 87 Strongly Landlord-Friendly
- State Florida
- 87 Strongly Landlord-Friendly · R+3
- County
- — inherits STATE
- City
- — inherits STATE
ZIP-level market 33786
- Home prices YoY
- -31.1%
- Active inventory
- 61
- Price-to-rent
- 10.0×
Monthly cashflow live
- Estimated rent
- $5,428 high interval (Pro) →
- Mortgage (P&I)
- −$3,408
- Tax from tax record
- −$172 /mo · $2,066/yr
- Insurance
- −$271
- Flood insurance flood zone
- −$427 /mo · $5,118/yr
- HOA
- −$0
- Vacancy / Maint / Mgmt
- −$1,140
- Net cashflow
- $11
Break-even live
UW: 25.0% down · 7.5% · 30yr · 1.5% tax · 5.0% vac · 8.0% maint · 8.0% mgmt
Financing live
Cash to close
- Down payment
- $162,475
- Closing costs
- $19,497
- Reserves months
- —
- Total cash needed
- —
Loan-product check · same deal, 3 products live
Conventional
25% down · 7.5% · 30yr
- Down + closing
- —
- Monthly P&I
- —
- Monthly cashflow
- —
- DSCR
- —
- Eligible?
- —
Personal DTI + credit; lowest rate.
DSCR
20% down · 8.5% · 30yr
- Down + closing
- —
- Monthly P&I
- —
- Monthly cashflow
- —
- DSCR
- —
- Eligible?
- —
No personal income docs; deal must DSCR.
Hard money
10% down · 12.0% · 12mo
- Down + closing
- —
- Monthly P&I
- —
- Monthly cashflow
- —
- DSCR
- —
- Eligible?
- —
Short-term bridge; refi at stabilization.
Rent comps 32 comps
| Address | Beds | Baths | Sqft | Rent | $/sqft | DOM | Units | Dist |
|---|---|---|---|---|---|---|---|---|
| 2250 Gulf Blvd Belleair Beach, FL | 3.0 | 3.0 | 2000 | $9,750 | $4.88 | 24d | 1 | 0.14mi |
| 2109 Bayshore Dr Belleair Beach, FL | 3.0 | 3.0 | 2062 | $4,900 | $2.38 | 4d | 1 | 0.17mi |
| 2900 Gulf Blvd Belleair Beach, FL | 2.0–3.0 | 2.0 | 1506 | $4,500 | $2.99 | 24d | 3 | 0.23mi |
| 1910 Bayshore Dr Belleair Beach, FL | 3.0 | 2.0 | 1912 | $3,600 | $1.88 | 4d | 1 | 0.26mi |
| 3001 Gulf Blvd Belleair Beach, FL | 3.0 | 2.0 | 1947 | $3,200 | $1.64 | 24d | 1 | 0.28mi |
| 106 15th St Belleair Beach, FL | 3.0 | 2.0 | 1429 | $3,200 | $2.24 | 4d | 1 | 0.52mi |
| 240 Sand Key Estates Dr #216 Clearwater Beach, FL | 2.0 | 2.0 | 1530 | $4,500 | $2.94 | 4d | 1 | 0.70mi |
| 1660 Gulf Blvd #607 Clearwater Beach, FL | 2.0 | 2.0 | 1610 | $5,500 | $3.42 | 4d | 1 | 0.74mi |
| 1600 Gulf Blvd #814 Clearwater Beach, FL | 2.0 | 2.0 | 1840 | $5,100 | $2.77 | 17d | 1 | 0.76mi |
| 1600 Gulf Blvd #1016 Clearwater Beach, FL | 3.0 | 3.0 | 1970 | $4,995 | $2.54 | 7d | 1 | 0.76mi |
| 1621 Gulf Blvd #503 Clearwater Beach, FL | 2.0 | 2.0 | 1300 | $3,200 | $2.46 | 2d | 1 | 0.77mi |
| 108 8th St Belleair Beach, FL | 3.0 | 2.0 | 1743 | $8,000 | $4.59 | 24d | 1 | 0.90mi |
| 150 Marina del Rey Ct Clearwater Beach, FL | 4.0 | 2.5 | 2250 | $4,950 | $2.20 | 24d | 1 | 0.93mi |
| 1560 Gulf Blvd #804 Clearwater Beach, FL | 2.0 | 2.0 | 1350 | $5,000 | $3.70 | 24d | 1 | 0.94mi |
| 52 N Pine Cir Belleair, FL | 2.0 | 2.0 | 1293 | $6,200 | $4.80 | 4d | 1 | 0.98mi |
| 1540 Gulf Blvd #3 Clearwater Beach, FL | 2.0 | 2.0 | 1255 | $3,750 | $2.99 | 4d | 1 | 0.99mi |
| 1520 Gulf Blvd #1201 Clearwater Beach, FL | 3.0 | 2.0 | 1800 | $7,500 | $4.17 | 24d | 1 | 1.03mi |
| 1520 Gulf Blvd #906 Clearwater Beach, FL | 2.0 | 2.0 | 1450 | $5,400 | $3.72 | 17d | 1 | 1.03mi |
| 1501 Gulf Blvd #102 Clearwater Beach, FL | 2.0 | 2.0 | 1390 | $3,250 | $2.34 | 17d | 1 | 1.09mi |
| 1480 Gulf Blvd #308 Clearwater Beach, FL | 2.0 | 2.0 | 1331 | $2,995 | $2.25 | 24d | 1 | 1.10mi |
| 1460 Gulf Blvd #302 Clearwater Beach, FL | 2.0 | 2.0 | 1298 | $6,000 | $4.62 | 24d | 1 | 1.18mi |
| 1460 Gulf Blvd #1102 Clearwater Beach, FL | 2.0 | 2.0 | 1298 | $3,800 | $2.93 | 4d | 1 | 1.18mi |
| 1460 Gulf Blvd #1205 Clearwater Beach, FL | 2.0 | 2.0 | 1298 | $6,500 | $5.01 | 4d | 1 | 1.18mi |
| 1460 Gulf Blvd #411 Clearwater Beach, FL | 2.0 | 2.0 | 1298 | $3,495 | $2.69 | 4d | 1 | 1.18mi |
| 1460 Gulf Blvd #1105 Clearwater Beach, FL | 2.0 | 2.0 | 1386 | $5,800 | $4.18 | 4d | 1 | 1.18mi |
| 1460 Gulf Blvd #707 Clearwater Beach, FL | 2.0 | 2.0 | 1544 | $5,900 | $3.82 | 4d | 1 | 1.18mi |
| 1430 Gulf Blvd #612 Clearwater Beach, FL | 2.0 | 2.0 | 1380 | $3,800 | $2.75 | 4d | 1 | 1.26mi |
| 1430 Gulf Blvd #404 Clearwater, FL | 2.0 | 2.0 | 1380 | $2,950 | $2.14 | 4d | 1 | 1.26mi |
| 1400 Gulf Blvd #704 Clearwater Beach, FL | 2.0 | 2.0 | 1392 | $4,100 | $2.95 | 24d | 1 | 1.32mi |
| 1390 Gulf Blvd #1204 Clearwater Beach, FL | 3.0 | 2.0 | 1697 | $6,900 | $4.07 | 24d | 1 | 1.38mi |
| 325 Mehlenbacher Rd Belleair Bluffs, FL | 3.0 | 2.0 | 2049 | $4,500 | $2.20 | 4d | 1 | 1.44mi |
| 2509 Bay Blvd Unit B Indian Rocks Beach, FL | 3.0 | 3.5 | 2400 | $5,995 | $2.50 | 24d | 1 | 1.44mi |
Listing history 14 events
-
2026-06-18status $649,900 Pending 33 DOM
-
2026-06-17days on market $649,900 Active 33 DOM
-
2026-06-16days on market $649,900 Active 32 DOM
-
2026-06-15days on market $649,900 Active 31 DOM
-
2026-06-13days on market $649,900 Active 29 DOM
-
2026-06-09days on market $649,900 Active 25 DOM
-
2026-06-08days on market $649,900 Active 24 DOM
-
2026-06-07days on market $649,900 Active 23 DOM
-
2026-06-04days on market $649,900 Active 20 DOM
-
2026-06-03days on market $649,900 Active 19 DOM
-
2026-06-01days on market $649,900 Active 17 DOM
-
2026-05-31days on market $649,900 Active 16 DOM
-
2026-05-15$649,900 Active
-
1983-07-01soldstatus $117,500
ⓘ Source: listings_history table (triggers on properties + properties_extension) + one-shot
backfill from property_details.listing_events for pre-trigger history.
Tax reassessment forecast FL · Resets to sale price
- Current annual tax
- $2,066 · $172/mo
- Projected year-2 tax
- $5,394 · $450/mo
- Expected delta
- +$3,328/yr (+$277/mo · 161.1%)
ⓘ Screening estimate from a state-policy table — verify with the county assessor before closing.
Climate risk First Street
- Flood 9/10 Extreme FEMA zone AE · 99% chance over 30 yrs
- Wildfire 1/10 Low
- Heat 10/10 Extreme 7 d/yr ≥107°F today · 25 d/yr by 30 yrs out
- Wind 10/10 Extreme 99% chance of damaging wind over 30 yrs
- Air quality 3/10 Moderate 2 unhealthy d/yr today · 3 by 30 yrs out
Nearby sold comps map
Loading sold comps map…
Walkable amenities ~0.75 mi
Loading nearby amenities…
Taxation est. · year 1
- Rental income
- $65,137
- − Mortgage interest
- −$36,405
- − Property taxes
- −$2,066
- − Insurance
- −$8,368
- − Repairs & maintenance
- −$5,211
- − Management
- −$5,211
- − Depreciation
- −$18,906
- Taxable loss
- −$11,029
- Est. tax savings @ 24.0%
- +$2,647
- After-tax cash flow
- $2,774/yr
For passive investors: Depreciation is non-cash, so a rental often shows a tax loss while cash-flowing — sheltering income. Rental losses are passive: they offset passive income freely, and up to $25,000/yr can offset ordinary (W-2) income if you actively participate and your MAGI is under $100k (phasing out to $0 by $150k); unused losses carry forward. On sale, claimed depreciation is recaptured at up to 25%, and gains may owe capital-gains tax (a 1031 exchange can defer both). Figures are a year-1 estimate at your 24.0% rate — not tax advice; consult a CPA.
Schools (NCES district)
- District
- Pinellas
- NCES district ID
- 1201560
- Math proficiency
- 51% ▼ -5.00%
- Reading proficiency
- 51% ▼ -3.00%
- Median HH income
- $46,270
- Composite
- 43.27/100
- National rank
- #3046
- State rank
- #31 of 73 in FL
Livability — Belleair Beach
- Score
- 64/100
- State rank
- #671
- US rank
- #13805
Category grades
Schools grade is shown separately in the Schools card above.
Census & demographics
- Census place
- Belleair Beach, FL
- City population
- 1,564
- Population (ZIP)
- 1,564
Population outlook (Pinellas County) Hauer SSP2
- Today (2025)
- 1,027,532 people
- By 2030
- 1,063,586 · +3.5%
- By 2040
- 1,125,020 · +9.5%
- By 2050
- 1,168,637 · +13.7%
- By 2075
- 1,265,188 · +23.1%
- By 2100
- 1,260,357 · +22.7%
Race, ethnicity, and origin ACS 2023
- Neighborhood character
- Predominantly White (92%)
- Race & ethnicity
- White 92% Hispanic / Latino 3% Two or more races 2% Black 2% Asian 2%
- Common ancestry
- Romanian 5% Slovak 4% Lithuanian 3%
- Foreign-born
- 17% · Canada, China, South Korea
- Languages at home
- 85% English-only · German/W. Germanic 4% Other Indo-European 4% Spanish 3%
Political lean MEDSL · Pinellas
- 2024 margin
- Lean R (+5.2) · D 46.9% · R 52.1%
- 2008→2024 swing
- -13.5pp toward R · 2008: 8.3pp · 2024: -5.2pp
- All cycles
- 2024: R+5.2 2020: D+0.2 2016: R+1.1 2012: D+5.6 2008: D+8.3
Not yet ingested
- Civics
- —
Market trends
- HPI YoY
- ▼ -156.72%
- Current HPI
- 347.8284
- Rent YoY
- —
- Metro
- —
- State GDP YoY
- ▲ 3.28%
- F500 in state
- 36
Industry mix (Fortune 500 HQ in FL)
| Industry | F500 HQs | Revenue |
|---|---|---|
| Industrial Technology | 2 | $29B |
|
||
| Insurance | 2 | $17B |
|
||
| Retail | 1 | $60B |
|
||
| Technology Distribution | 1 | $58B |
|
||
| Homebuilding | 1 | $35B |
|
||
| Technology Manufacturing | 1 | $35B |
|
||
Price history
+453.1% since first listed2 events — show timeline
- 2026-05-15 Listed $649,900 Stellar MLS as Distributed by MLS Grid
- 1983-07-01 Sold (Public Records) $117,500 Public Records
Property tax history
-4.7%/yrLatest (2025): $2,066 · -19.0% YoY. Source: county tax records.
Cash-flow waterfall
monthlySold comps — $/sqft
last 12 mo · ≤1 miLoading sold comps…