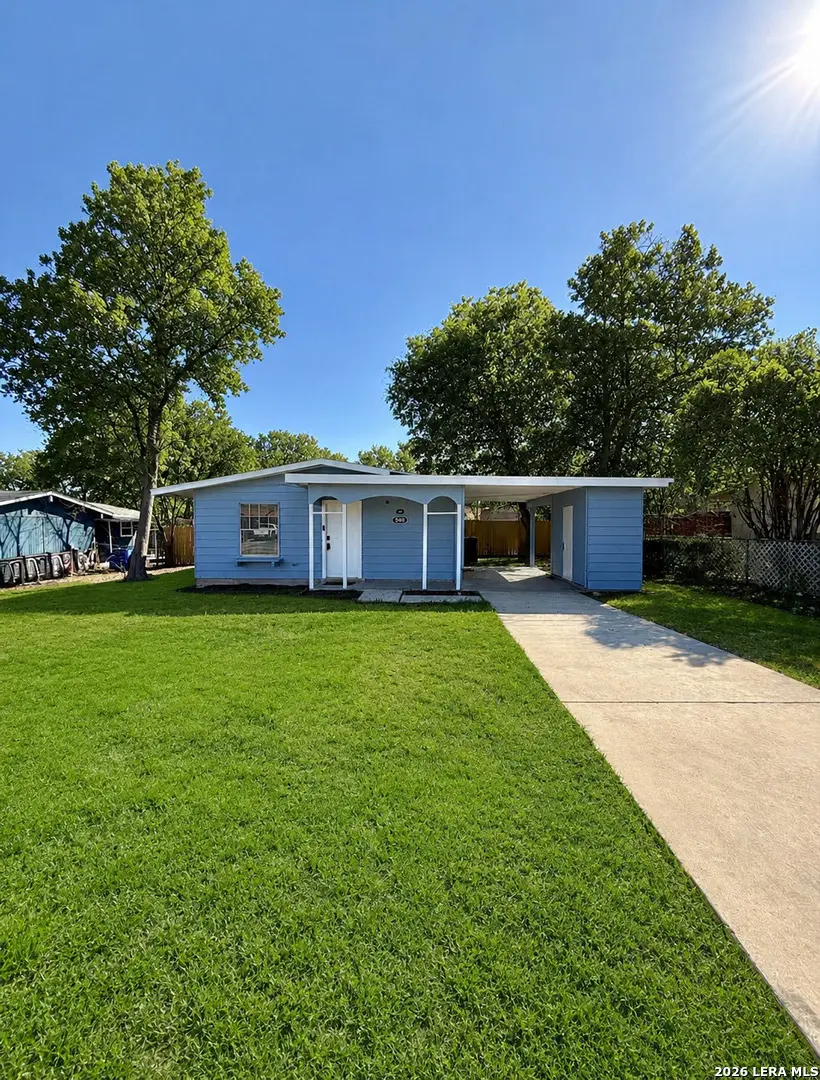
5846 Castle Lk · San Antonio, TX
Flood risk 1/10 · Minimal
- FEMA flood zone
- X (unshaded)
- Chance of flooding over 30 yrs
- 0.0%
- Est. flood insurance / yr
- $507 – $1,088
Fire risk 1/10 · Minimal
- Est. fire insurance / yr
- $1,222 – $2,270
Heat risk 8/10 · Major
- Hot days now (above 108°F)
- 7 days/yr
- Hot days in 30 yrs
- 22 days/yr
Wind risk 8/10 · Major
- Chance of severe wind over 30 yrs
- 80.0%
Air-quality risk 2/10 · Minimal
- Unhealthy air days now
- 0 days/yr
- Unhealthy air days in 30 yrs
- 1 days/yr
Risk factors via First Street. Map © Google.
Why this score? — see what drove the C- grade
The composite is a weighted blend of 9 inputs, each scored 0–100. Each bar is that input's sub-score; the figure is the points it added to the 100-point composite (weight × sub-score).
- Cash flow +16.2/30.0
- ARV discount +14.4/15.0
- 1% rule +5.5/10.0
- DSCR +5.0/10.0
- Livability +4.0/5.0
- Condition / age +2.5/5.0
- Schools +2.4/10.0
- Rent growth +1.1/5.0
- Appreciation +0.0/10.0
$145,000
🖨 Deal sheet (PDF) 📄 Offer letter ✓ Due diligence
Listing remarks MLS
One-story home with excellent investment potential. New carpet in bedrooms and living room (December 2022). Roof replaced in 2016. Foundation repaired in 2020- transferable 10 year foundation warranty available. One car attached carport area with storage. Central air plus two window units. Washing machine and refrigerator convey with purchase.
Key facts
- Fully renovated
- Storage shed
- Spacious carport
Tags
Property features AI
Finance
- Financial info: Down payment assistance not available (DPR N)
- HOA & community: Subdivision: EAST VILLAGE
Exterior
- Utilities: Water system; Sewer system
- Home design: Pre-owned property; Asbestos shingle exterior
- Construction: Approximately 56 years old; Slab foundation; Composition roof
- Exterior features: Chain link fence; Street paved with curbs, gutters, sidewalks and streetlights
Interior
- Kitchen: Stove/Range; Refrigerator
- Bedrooms: Master bedroom (lower level); Master bedroom approx. 12 x 12; Bedroom 2 approx. 11 x 10; Bedroom 3 approx. 11 x 10
- Flooring: Vinyl flooring
- Bathrooms: 1 full bathroom
- Heating & cooling: Central heating (electric); Central air conditioning; Multiple window A/C units
- Interior features: One living area; Separate dining room; All window coverings remain
- Laundry & utility: Washer; Dryer
Neighborhood map
What this means for you Summary
Snapshot
- This is a 3-bed/1.0-bath single-family listed at $145k.
Deal economics
- At list price, monthly cash flow is $77 ($926/yr) — positive.
- The deal already cash-flows at list — no discount required.
- Meets the 1% rule at list price ($2k rent vs $145k).
- Recommended offer: $141k (3.0% below list) — sets the bar for market timing.
- Cap rate 6.9% vs local median 3.8% in San Antonio — top-decile yield for the area; either an underpriced asset or a hidden risk that comps aren't pricing in. Stress-test before assuming the spread holds.
Location & tenants
- Location reads 80/100 on livability (#31 in TX, #1,616 nationally) — a professional / high-income tenant draw. Strengths: amenities A+, commute A+, cost of living A+; Watch: crime F.
- Judson ISD (suburban): math 21% / reading 33% proficiency, ranked #660 of 826 in TX (top 80%) — low school quality limits family demand, transient renter base, plan for 1-2y turnover.
- Zoned schools: Park Village El (math 8% / reading 22%, grade F, #4,021 of 4,322 statewide, top 94%, 441 students, 88% FRL); Kirby Middle (math 11% / reading 23%, grade F, #1,520 of 1,662 statewide, top 92%, 683 students, 94% FRL); Karen Wagner H S (math 12% / reading 29%, grade F, #1,389 of 1,632 statewide, top 86%, 2,366 students, 80% FRL) — zoned schools average 88% FRL vs 57% district-wide (31 pts higher); higher-poverty schools than district average — tighter screening recommended.
- Market conditions: Rents falling (-5.6%/yr); 135 active listings in the ZIP; 40 comparable units currently listed for rent nearby; rentals at typical pace (median 24d on market — plan ~3-4 weeks tenant-placement turnaround); 8,308 units permitted in Bexar County in 2024 (2,506 in 5+ unit buildings).
- This rent runs 32% of the median local income ($57k/yr) — at the standard rent-burdened threshold; future hikes will face affordability resistance.
Forward outlook
- Local home prices are declining (-3.0%/yr); year-one equity from $1k of loan paydown is wiped out by about $4k of value loss. Plan a longer hold.
- Bexar County population projected at +50% by 2050 — long-run rental-demand tailwind backs the buy-and-hold thesis.
Negotiation context
- It's been on market 31 days — a 3% lower offer ($141k) is reasonable based on typical stale-listing flexibility.
- 10 sale attempts since 15y ago with the ask held roughly flat each time — persistent listings suggest the price (not the market) is what's stuck; bring a comps-based counter.
Risks & watch-outs
- Watch-outs: property tax is 2.6% of price.
- Climate carrying-cost: severe wind risk, 80% chance of damaging wind over 30y; extreme-heat days projected 7→22/yr by 2055 (HVAC capex compounding) — expect insurance premiums to compound above CPI over the hold.
Questions for the listing agent
- It's been on market 31 days. Have you received any prior offers? Is the seller open to a 3% concession, seller financing, or rate buy-down credit?
- Built in 1970 — when were the roof, HVAC, electrical panel, plumbing, and water heater last replaced?
- Property tax is high relative to price — has the assessment been appealed recently, and will the sale trigger a re-assessment?
- Is there a deadline driving the sale (1031 exchange, divorce, estate, relocation)? That informs how much negotiation room exists.
- Crime grade is F in this area — have there been break-ins, vandalism, or insurance claims at this property in the last 3 years? What carrier currently insures it and at what premium?
- What's the average days-on-market for RENTAL listings here right now (not sales)? A rising rental-DOM trend means longer vacancies and softer asking-rent achievability than the comps imply.
- What's the recent tenant-quality profile in this submarket — average credit score on applications, eviction rate, late-payment / NSF rate, and stable-employment percentage? A property-management company in the area should have these aggregated.
- How much new for-sale + rental construction is in the pipeline within 1–3 miles? Heavy new supply typically softens prices + rents 12–24 months out; constrained supply supports both.
Investment metrics
- 1% rule
- 1.05% ✓
- Cap rate
- 6.93%
- Cash-on-cash
- 2.28%
- DSCR
- 1.10
- GRM
- 7.9
CMA / ARV
- ARV (on-the-fly)
- $171,248
- Comps found
- 12
Show comp detail 12 sales within ~0.75 mi
| Address | Dist | Beds/Ba | Sqft | Sold | Price | $/sf | Match |
|---|---|---|---|---|---|---|---|
| 5814 Castle Lk | 0.11mi | 3/1.0 | 998 (-10%) | 12mo | $178,500 | $179 | 68 |
| 5806 Castle Yard | 0.12mi | 2/1.0 (-1) | 984 (-12%) | 11mo | $130,000 | $132 | 61 |
| 5839 Castle Yard | 0.16mi | 3/1.0 | 1,267 (+14%) | 13mo | $163,000 | $129 | 58 |
| 4706 Castle Stream Dr | 0.52mi | 3/2.0 | 1,190 (+7%) | 2mo | $144,999 | $122 | 58 |
| 6027 Bluestem Way | 0.57mi | 3/2.0 | 1,197 (+8%) | 0mo | $235,000 | $196 | 56 |
| 4835 Castle Sword | 0.38mi | 3/2.0 | 1,200 (+8%) | 11mo | $185,000 | $154 | 56 |
| 5222 Village | 0.68mi | 3/2.0 | 1,132 (+2%) | 10mo | $139,000 | $123 | 54 |
| 4819 Castle Lance | 0.54mi | 4/2.0 (+1) | 1,200 (+8%) | 2mo | $209,000 | $174 | 51 |
| 4875 Castle Arms | 0.49mi | 3/2.0 | 1,238 (+11%) | 10mo | $184,999 | $149 | 46 |
| 6247 Silver Pegasus | 0.75mi | 3/2.0 | 1,203 (+8%) | 14mo | $249,000 | $207 | 36 |
| 5811 Shadow Way | 0.68mi | 4/2.0 (+1) | 996 (-10%) | 11mo | $119,950 | $120 | 33 |
| 7259 Rosada Way | 0.73mi | 3/2.0 | 1,276 (+15%) | 5mo | $225,000 | $176 | 33 |
Match score weights: distance 35% · size 25% · config 20% · recency 20%. Top-matched comps best support the ARV.
Projected returns pro-forma
-3.0% appreciation · 0.0% rent growth · sell at horizon
- IRR
- -16.5%
- Equity multiple
- 0.43×
- Total profit
- $-22,957
- Equity at exit
- $21,620
- IRR
- -15.8%
- Equity multiple
- 0.25×
- Total profit
- $-30,553
- Equity at exit
- $12,537
Cash invested: $40,600 (down + closing). Projections, not guarantees.
Landlord ↔ Tenant lean methodology
- Overall (STATE)
- 87 Strongly Landlord-Friendly
- State Texas
- 87 Strongly Landlord-Friendly · R+5
- County
- — inherits STATE
- City
- — inherits STATE
ZIP-level market 78218
- Home prices YoY
- -16.1%
- Rents YoY
- -5.6%
- Active inventory
- 135
- Price-to-rent
- 7.9×
Monthly cashflow live
- Estimated rent
- $1,528 high interval (Pro) →
- Mortgage (P&I)
- −$760
- Tax from tax record
- −$309 /mo · $3,710/yr
- Insurance
- −$60
- HOA
- −$0
- Vacancy / Maint / Mgmt
- −$321
- Net cashflow
- $77
Break-even live
Sensitivity live
| Price | -10% $159 | -5% $118 | +0% $77 | +5% $36 | +10% $-5 |
|---|---|---|---|---|---|
| Rent | -10% $-44 | -5% $17 | +0% $77 | +5% $138 | +10% $198 |
| Rate | -1.0pp $150 | -0.5pp $114 | base $77 | +0.5pp $40 | +1.0pp $1 |
UW: 25.0% down · 7.5% · 30yr · 1.5% tax · 5.0% vac · 8.0% maint · 8.0% mgmt
Financing live
Cash to close
- Down payment
- $36,250
- Closing costs
- $4,350
- Reserves months
- —
- Total cash needed
- —
Loan-product check · same deal, 3 products live
Conventional
25% down · 7.5% · 30yr
- Down + closing
- —
- Monthly P&I
- —
- Monthly cashflow
- —
- DSCR
- —
- Eligible?
- —
Personal DTI + credit; lowest rate.
DSCR
20% down · 8.5% · 30yr
- Down + closing
- —
- Monthly P&I
- —
- Monthly cashflow
- —
- DSCR
- —
- Eligible?
- —
No personal income docs; deal must DSCR.
Hard money
10% down · 12.0% · 12mo
- Down + closing
- —
- Monthly P&I
- —
- Monthly cashflow
- —
- DSCR
- —
- Eligible?
- —
Short-term bridge; refi at stabilization.
Rent comps 40 comps
| Address | Beds | Baths | Sqft | Rent | $/sqft | DOM | Units | Dist |
|---|---|---|---|---|---|---|---|---|
| 5874 Castle Run San Antonio, TX | 4.0 | 2.0 | 1273 | $1,300 | $1.02 | 16d | 1 | 0.04mi |
| 6918 Pumpkin Cv San Antonio, TX | 3.0 | 2.0 | 1378 | $1,695 | $1.23 | 3d | 1 | 0.39mi |
| 4862 Castle Arms San Antonio, TX | 3.0 | 2.0 | 1350 | $1,295 | $0.96 | 45d | 1 | 0.44mi |
| 6422 Hibiscus Fls San Antonio, TX | 3.0 | 2.0 | 1417 | $1,675 | $1.18 | 25d | 1 | 0.45mi |
| 4843 Castle Shield San Antonio, TX | 3.0 | 1.0 | 1032 | $1,350 | $1.31 | 25d | 1 | 0.52mi |
| 4839 Castle Strm San Antonio, TX | 3.0 | 1.0 | 872 | $1,300 | $1.49 | 23d | 1 | 0.55mi |
| 4863 Castle Shield San Antonio, TX | 3.0 | 1.0 | 1472 | $1,400 | $0.95 | 6d | 1 | 0.56mi |
| 5414 Stoneshire San Antonio, TX | 3.0 | 2.0 | 1469 | $2,000 | $1.36 | 12d | 1 | 0.68mi |
| 4822 Orchid Star San Antonio, TX | 3.0 | 2.5 | 1450 | $1,435 | $0.99 | 25d | 1 | 0.68mi |
| 6126 Plumbago Pl San Antonio, TX | 3.0 | 2.0 | 1436 | $1,595 | $1.11 | 45d | 1 | 0.69mi |
| 7231 Lavaca Blf San Antonio, TX | 3.0 | 2.0 | 1450 | $1,550 | $1.07 | 9d | 1 | 0.70mi |
| 7238 Rosada Way San Antonio, TX | 3.0 | 2.0 | 1276 | $1,650 | $1.29 | 45d | 1 | 0.73mi |
| 4830 Ray Bon Dr Unit 710 San Antonio, TX | 2.0 | 2.0 | 850 | $1,158 | $1.36 | 0d | 1 | 0.73mi |
| 5819 Woodhill San Antonio, TX | 3.0 | 2.0 | 1015 | $1,300 | $1.28 | 45d | 1 | 0.76mi |
| 7527 Spanish Dagger San Antonio, TX | 3.0 | 2.0 | 1407 | $1,700 | $1.21 | 45d | 1 | 0.80mi |
| 5414 Midcrown Dr Unit 710 San Antonio, TX | 2.0 | 2.0 | 998 | $1,031 | $1.03 | 0d | 1 | 0.81mi |
| 5918 Poesta San Antonio, TX | 3.0 | 2.0 | 1307 | $1,650 | $1.26 | 45d | 1 | 0.83mi |
| 7523 Whispine San Antonio, TX | 3.0 | 2.0 | 1307 | $1,720 | $1.32 | 25d | 1 | 0.83mi |
| 7607 Millchase San Antonio, TX | 3.0 | 2.0 | 1407 | $1,700 | $1.21 | 19d | 1 | 0.86mi |
| 5827 Camier Cv San Antonio, TX | 3.0 | 2.0 | 1307 | $1,650 | $1.26 | 25d | 1 | 0.86mi |
| 5903 Camier Cv San Antonio, TX | 3.0 | 2.0 | 1307 | $1,695 | $1.30 | 6d | 1 | 0.87mi |
| 5915 Camier Cv San Antonio, TX | 3.0 | 2.0 | 1307 | $1,720 | $1.32 | 12d | 1 | 0.89mi |
| 5123 Village Glen San Antonio, TX | 3.0 | 1.0 | 1176 | $1,275 | $1.08 | 45d | 1 | 0.90mi |
| 6003 Camier Cv San Antonio, TX | 3.0 | 2.0 | 1307 | $1,650 | $1.26 | 19d | 1 | 0.92mi |
| 5100 Eisenhauer Rd Unit 710 San Antonio, TX | 2.0 | 2.0 | 1088 | $1,196 | $1.10 | 0d | 1 | 0.93mi |
| 6023 Camier Cv San Antonio, TX | 3.0 | 2.0 | 1407 | $1,745 | $1.24 | 25d | 1 | 0.94mi |
| 7250 Dwarf Palm San Antonio, TX | 3.0 | 2.0 | 1467 | $1,570 | $1.07 | 45d | 1 | 0.95mi |
| 6903 Cozy Run San Antonio, TX | 3.0 | 2.0 | 1243 | $1,550 | $1.25 | 16d | 1 | 0.97mi |
| 5143 Village Lawn San Antonio, TX | 3.0 | 1.5 | 1008 | $1,450 | $1.44 | 23d | 1 | 0.99mi |
| 7151 Woodlake Pkwy San Antonio, TX | 3.0–4.0 | 2.0 | 1528 | $1,329 | $0.87 | 0d | 1 | 1.07mi |
| 4545 Hoeneke St San Antonio, TX | 2.0 | 2.0 | 995 | $999 | $1.00 | 6d | 2 | 1.08mi |
| 4811 Village Vw San Antonio, TX | 3.0 | 2.0 | 1288 | $1,450 | $1.13 | 9d | 1 | 1.13mi |
| 5607 Lakebend West Dr San Antonio, TX | 3.0 | 2.0 | 1210 | $1,249 | $1.03 | 45d | 1 | 1.14mi |
| 5603 W Lakebend Dr Unit A San Antonio, TX | 3.0 | 2.0 | 1210 | $1,350 | $1.12 | 0d | 1 | 1.14mi |
| 4807 Georges Farm San Antonio, TX | 3.0 | 2.0 | 1008 | $1,295 | $1.28 | 45d | 1 | 1.17mi |
| 5415 N Foster Rd San Antonio, TX | 1.0–3.0 | 1.0–2.0 | 966 | $1,655 | $1.71 | 0d | 23 | 1.18mi |
| 4411 Mystic Sunrise Dr San Antonio, TX | 3.0 | 2.0 | 1120 | $2,000 | $1.79 | 25d | 1 | 1.18mi |
| 4726 Georges Farm San Antonio, TX | 4.0 | 2.0 | 1239 | $1,300 | $1.05 | 0d | 1 | 1.23mi |
| 4334 Hickory Hill Dr San Antonio, TX | 3.0 | 1.5 | 1129 | $1,550 | $1.37 | 12d | 1 | 1.27mi |
| 4727 Gavlick Farm San Antonio, TX | 3.0 | 2.0 | 1189 | $1,425 | $1.20 | 45d | 1 | 1.27mi |
Listing history 50 events
-
2026-06-21days on market $145,000 Active 31 DOM
-
2026-06-18days on market $145,000 Active 28 DOM
-
2026-06-17days on market $145,000 Active 27 DOM
-
2026-06-16days on market $145,000 Active 26 DOM
-
2026-06-15days on market $145,000 Active 25 DOM
-
2026-06-13days on market $145,000 Active 23 DOM
-
2026-06-09days on market $145,000 Active 19 DOM
-
2026-06-08days on market $145,000 Active 18 DOM
-
2026-06-07days on market $145,000 Active 17 DOM
-
2026-06-04days on market $145,000 Active 14 DOM
-
2026-06-03days on market $145,000 Active 13 DOM
-
2026-06-02days on market $145,000 Active 12 DOM
-
2026-06-01statusdays on market $145,000 Active 11 DOM
-
2026-05-31days on market $145,000 New 10 DOM
-
2026-05-21$145,000 New
-
2026-05-06historical $1,425
-
2026-02-21$1,425
-
2026-02-11historical $1,399
-
2026-01-31price $1,399
-
2025-10-25price $1,425
-
2025-09-06price $1,550
-
2025-08-28$1,600
-
2025-07-23soldstatus
-
2025-03-30historical $1,250
-
2025-03-28$1,250
-
2025-03-15historical $1,250
-
2025-03-06price $1,250
-
2025-02-05price $1,480
-
2025-01-11$1,600
-
2025-01-05historical $1,600
-
2024-12-05$1,600
-
2024-11-22historical
-
2024-10-04price $165,000
-
2024-08-06price $174,000
-
2024-07-02$175,000 New
-
2023-03-31soldstatus
-
2023-03-30soldstatus Sold 345-char remark
Show marketing remark (345 chars)
One-story home with excellent investment potential. New carpet in bedrooms and living room (December 2022). Roof replaced in 2016. Foundation repaired in 2020- transferable 10 year foundation warranty available. One car attached carport area with storage. Central air plus two window units. Washing machine and refrigerator convey with purchase.
-
2023-03-09status Pending 345-char remark
Show marketing remark (345 chars)
One-story home with excellent investment potential. New carpet in bedrooms and living room (December 2022). Roof replaced in 2016. Foundation repaired in 2020- transferable 10 year foundation warranty available. One car attached carport area with storage. Central air plus two window units. Washing machine and refrigerator convey with purchase.
-
2023-03-07historical Active Option 345-char remark
Show marketing remark (345 chars)
One-story home with excellent investment potential. New carpet in bedrooms and living room (December 2022). Roof replaced in 2016. Foundation repaired in 2020- transferable 10 year foundation warranty available. One car attached carport area with storage. Central air plus two window units. Washing machine and refrigerator convey with purchase.
-
2023-01-30price $157,900 345-char remark
Show marketing remark (345 chars)
One-story home with excellent investment potential. New carpet in bedrooms and living room (December 2022). Roof replaced in 2016. Foundation repaired in 2020- transferable 10 year foundation warranty available. One car attached carport area with storage. Central air plus two window units. Washing machine and refrigerator convey with purchase.
-
2023-01-07price $159,900 345-char remark
Show marketing remark (345 chars)
One-story home with excellent investment potential. New carpet in bedrooms and living room (December 2022). Roof replaced in 2016. Foundation repaired in 2020- transferable 10 year foundation warranty available. One car attached carport area with storage. Central air plus two window units. Washing machine and refrigerator convey with purchase.
-
2023-01-06$164,900 New 345-char remark
Show marketing remark (345 chars)
One-story home with excellent investment potential. New carpet in bedrooms and living room (December 2022). Roof replaced in 2016. Foundation repaired in 2020- transferable 10 year foundation warranty available. One car attached carport area with storage. Central air plus two window units. Washing machine and refrigerator convey with purchase.
-
2021-10-20historical
-
2021-09-21price $155,000
-
2021-09-07price $158,000
-
2021-08-11$160,000 New
-
2011-09-23soldstatus
-
2011-09-16soldstatus
-
2011-08-12historical
-
2011-07-30$35,000
ⓘ Source: listings_history table (triggers on properties + properties_extension) + one-shot
backfill from property_details.listing_events for pre-trigger history.
Tax reassessment forecast TX · Resets to sale price
- Current annual tax
- $3,710 · $309/mo
- Projected year-2 tax
- $3,710 · $309/mo
- Expected delta
- $0/yr ($0/mo · 0.0%)
ⓘ Screening estimate from a state-policy table — verify with the county assessor before closing.
Climate risk First Street
- Flood 1/10 Low FEMA zone X (unshaded) · 0% chance over 30 yrs
- Wildfire 1/10 Low
- Heat 8/10 Severe 7 d/yr ≥108°F today · 22 d/yr by 30 yrs out
- Wind 8/10 Severe 80% chance of damaging wind over 30 yrs
- Air quality 2/10 Low 0 unhealthy d/yr today · 1 by 30 yrs out
Nearby sold comps map
Loading sold comps map…
Walkable amenities ~0.75 mi
Loading nearby amenities…
Taxation est. · year 1
- Rental income
- $18,337
- − Mortgage interest
- −$8,122
- − Property taxes
- −$3,710
- − Insurance
- −$725
- − Repairs & maintenance
- −$1,467
- − Management
- −$1,467
- − Depreciation
- −$4,218
- Taxable loss
- −$1,373
- Est. tax savings @ 24.0%
- +$329
- After-tax cash flow
- $1,256/yr
For passive investors: Depreciation is non-cash, so a rental often shows a tax loss while cash-flowing — sheltering income. Rental losses are passive: they offset passive income freely, and up to $25,000/yr can offset ordinary (W-2) income if you actively participate and your MAGI is under $100k (phasing out to $0 by $150k); unused losses carry forward. On sale, claimed depreciation is recaptured at up to 25%, and gains may owe capital-gains tax (a 1031 exchange can defer both). Figures are a year-1 estimate at your 24.0% rate — not tax advice; consult a CPA.
Schools (NCES district)
- District
- Judson ISD
- NCES district ID
- 4824990
- Math proficiency
- 21% ▼ -21.00%
- Reading proficiency
- 33% ▼ -7.00%
- Median HH income
- $57,542
- Composite
- 24.39/100
- National rank
- #7689
- State rank
- #660 of 826 in TX
Livability — San Antonio
- Score
- 80/100
- State rank
- #31
- US rank
- #1616
Category grades
Schools grade is shown separately in the Schools card above.
Census & demographics
- Census place
- San Antonio, TX
- County
- Bexar County · 1,990,555 people
- City population
- 1,806,925
- Metro
- San Antonio-New Braunfels, TX
- Population (ZIP)
- 39,428
- Household income
- $57,285
- Rent vs Own
- Severe rent burden
- 2508.0
Population outlook (Bexar County) Hauer SSP2
- Today (2025)
- 2,336,851 people
- By 2030
- 2,560,728 · +9.6%
- By 2040
- 3,020,569 · +29.3%
- By 2050
- 3,493,522 · +49.5%
- By 2075
- 4,668,459 · +99.8%
- By 2100
- 5,533,242 · +136.8%
Race, ethnicity, and origin ACS 2023
- Neighborhood character
- Diverse neighborhood (Simpson 0.64)
- Race & ethnicity
- Hispanic / Latino 53% Two or more races 26% White 25% Black 14% Asian 3% Native American 2%
- Hispanic origin (detail)
- Mexican 41% Puerto Rican 3%
- Common ancestry
- Serbian 2% Italian 1% Romanian 1%
- Foreign-born
- 18% · Canada, Vietnam, China
- Languages at home
- 60% English-only · Spanish 34% Vietnamese 1% Other Asian/Pacific 1%
Political lean MEDSL · Bexar
- 2024 margin
- Lean D (+9.8) · D 54.3% · R 44.6% · Other 1.1%
- 2008→2024 swing
- +4.2pp toward D · 2008: 5.6pp · 2024: 9.8pp
- All cycles
- 2024: D+9.8 2020: D+18.2 2016: D+13.5 2012: D+4.6 2008: D+5.6
Not yet ingested
- Civics
- —
Market trends
- HPI YoY
- ▼ -52.17%
- Current HPI
- 271.2807
- Rent YoY
- ▼ -5.56%
- Metro
- San Antonio-New Braunfels, TX
- State GDP YoY
- ▲ 3.95%
- F500 in state
- 110
Industry mix (Fortune 500 HQ in TX)
| Industry | F500 HQs | Revenue |
|---|---|---|
| Energy | 16 | $1,198B |
|
||
| Technology | 5 | $198B |
|
||
| Engineering / Construction | 4 | $72B |
|
||
| Energy Services | 3 | $60B |
|
||
| Utilities | 3 | $41B |
|
||
| Healthcare | 2 | $330B |
|
||
Price history
+314.3% since first listed36 events — show timeline
- 2026-05-21 Listed $145,000 LERA
- 2026-05-06 Rental Removed $1,425 SABOR
- 2026-02-21 Listed for Rent $1,425 SABOR
- 2026-02-11 Rental Removed $1,399 ACTRIS
- 2026-01-31 Price Changed $1,399 ACTRIS
- 2025-10-25 Price Changed $1,425 ACTRIS
- 2025-09-06 Price Changed $1,550 ACTRIS
- 2025-08-28 Listed for Rent $1,600 ACTRIS
- 2025-07-23 Sold (Public Records) — Public Records
- 2025-03-30 Rental Removed $1,250 Avail
- 2025-03-28 Listed for Rent $1,250 Avail
- 2025-03-15 Rental Removed $1,250 Avail
- 2025-03-06 Price Changed $1,250 Avail
- 2025-02-05 Price Changed $1,480 Avail
- 2025-01-11 Listed for Rent $1,600 Avail
- 2025-01-05 Rental Removed $1,600 Avail
- 2024-12-05 Listed for Rent $1,600 Avail
- 2024-11-22 Listing Removed — LERA
- 2024-10-04 Price Changed $165,000 LERA
- 2024-08-06 Price Changed $174,000 LERA
- 2024-07-02 Listed $175,000 LERA
- 2023-03-31 Sold (Public Records) — Public Records
- 2023-03-30 Sold (MLS) — LERA
- 2023-03-09 Pending — LERA
- 2023-03-07 Contingent — LERA
- 2023-01-30 Price Changed $157,900 LERA
- 2023-01-07 Price Changed $159,900 LERA
- 2023-01-06 Listed $164,900 LERA
- 2021-10-20 Listing Removed — LERA
- 2021-09-21 Price Changed $155,000 LERA
- 2021-09-07 Price Changed $158,000 LERA
- 2021-08-11 Listed $160,000 LERA
- 2011-09-23 Sold (Public Records) — Public Records
- 2011-09-16 Sold (MLS) — LERA
- 2011-08-12 Listing Removed — LERA
- 2011-07-30 Listed $35,000 LERA
Property tax history
+14.1%/yrLatest (2025): $3,710 · +1.6% YoY. Source: county tax records.
Cash-flow waterfall
monthlySold comps — $/sqft
last 12 mo · ≤1 miLoading sold comps…