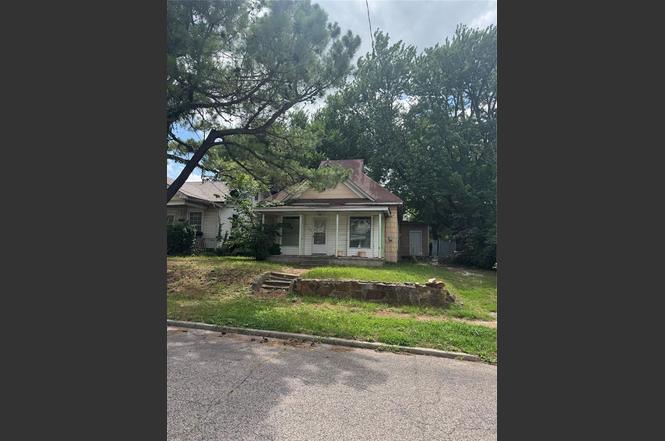
636 N Bell · Shawnee, OK
Flood risk 1/10 · Minimal
- FEMA flood zone
- X (unshaded)
- Chance of flooding over 30 yrs
- 0.0%
- Est. flood insurance / yr
- $507 – $1,088
Fire risk 4/10 · Minor
- Est. fire insurance / yr
- $2,463 – $4,575
Heat risk 5/10 · Moderate
- Hot days now (above 109°F)
- 7 days/yr
- Hot days in 30 yrs
- 18 days/yr
Wind risk 3/10 · Minor
- Chance of severe wind over 30 yrs
- 5.0%
Air-quality risk 2/10 · Minimal
- Unhealthy air days now
- 1 days/yr
- Unhealthy air days in 30 yrs
- 1 days/yr
Risk factors via First Street. Map © Google.
Why this score? — see what drove the B grade
The composite is a weighted blend of 9 inputs, each scored 0–100. Each bar is that input's sub-score; the figure is the points it added to the 100-point composite (weight × sub-score).
- Cash flow +30.0/30.0
- 1% rule +10.0/10.0
- DSCR +10.0/10.0
- ARV discount +7.5/15.0
- Rent growth +3.2/5.0
- Livability +3.2/5.0
- Appreciation +2.7/10.0
- Condition / age +2.5/5.0
- Schools +1.1/10.0
$30,000
🖨 Deal sheet 📄 Offer letter ✓ Due diligence
Listing remarks MLS
Fixer Upper! 3 Bedroom, 1 Bath home located in Shawnee. Country Kitchen. Storage Building! Buyer to verify Elementary school district.
Key facts
- Convenient location
- Sizable lot
- 4,190 sq ft lot
Tags
Property features AI
Finance
- Other: Homestead recorded; Vacant and unoccupied; Living area reported as 1,265 (assessor)
- Financial info: Assumable loan: No; Current price listed: $30,000
- HOA & community: No mandatory association dues
Exterior
- Parking: No parking details listed
- Security: No security features listed
- Utilities: No utility details listed
- Home design: Single-family residence; One level; East-facing
- Construction: Frame construction; Composition roof; Conventional foundation; Existing property
- Exterior features: No exterior features listed; Interior lot
Interior
- Kitchen: No appliances listed
- Bedrooms: 3 bedrooms
- Flooring: No flooring details listed
- Bathrooms: 1 full bathroom; 1 half bathroom
- Heating & cooling: No heating; No cooling
- Interior features: No fireplace; No formal study; In-law plan not indicated
- Laundry & utility: No laundry or utility details listed
Neighborhood map
What this means for you Summary
Snapshot
- This is a 3-bed/1.0-bath single-family listed at $30k.
Deal economics
- At list price, monthly cash flow is $652 ($8k/yr) — positive.
- The deal already cash-flows at list — no discount required.
- Meets the 1% rule at list price ($1k rent vs $30k).
- Cap rate 32.4% vs local median 3.9% in Shawnee — top-decile yield for the area; either an underpriced asset or a hidden risk that comps aren't pricing in. Stress-test before assuming the spread holds.
Location & tenants
- Location reads 63/100 on livability (#217 in OK) — a middle-class / working-renter tenant base. Strengths: cost of living A+, housing A+; Watch: crime F, amenities F, commute F.
- Shawnee (town): math 11% / reading 17% proficiency, ranked #238 of 270 in OK (top 88%) — low school quality limits family demand, transient renter base, plan for 1-2y turnover; 70% free/reduced lunch — lower-income household profile, screen leases tightly.
- Zoned schools: Shawnee Hs (math 16% / reading 35%, grade F, #142 of 447 statewide, top 32%, 987 students, 0% FRL) — zoned schools average 0% FRL vs 70% district-wide (70 pts lower); this property's tenant base skews higher-income than the district average.
- Market conditions: Rents rising (+2.8%/yr); 192 active listings in the ZIP; 4 comparable units currently listed for rent nearby; rentals at typical pace (median 20d on market — plan ~3-4 weeks tenant-placement turnaround); 183 units permitted in Pottawatomie County in 2024 (16 in 5+ unit buildings).
Forward outlook
- Local home prices are declining (-3.0%/yr); year-one equity from $207 of loan paydown is wiped out by about $900 of value loss. Plan a longer hold.
- Pottawatomie County population projected at +12% by 2050 — modest demand growth; plan on rents tracking national, not racing it.
- At projected returns (-3.0% appreciation + 2.8% rent growth), your $8k cash investment doubles in ~2 years — after that, you're playing with house money.
Negotiation context
- Only 5 days on market — expect competitive offers; lowballing is unlikely to land.
- 2 sale attempts since 5y ago with the ask held roughly flat each time — persistent listings suggest the price (not the market) is what's stuck; bring a comps-based counter.
- Current owner paid $25k; 20% above their basis — modest negotiation headroom, anchor on the comps not their cost.
Risks & watch-outs
- Watch-outs: built in 1927 — expect roof / HVAC / electrical / plumbing capex.
- Climate carrying-cost: extreme-heat days projected 7→18/yr by 2055 (HVAC capex compounding) — expect insurance premiums to compound above CPI over the hold.
Questions for the listing agent
- Built in 1927 — when were the roof, HVAC, electrical panel, plumbing, and water heater last replaced?
- Is there a deadline driving the sale (1031 exchange, divorce, estate, relocation)? That informs how much negotiation room exists.
- Schools are F-rated, which usually means shorter tenancies and higher turnover. Who's the typical renter profile here, and what's been the actual vacancy rate?
- Crime grade is F in this area — have there been break-ins, vandalism, or insurance claims at this property in the last 3 years? What carrier currently insures it and at what premium?
- What's the average days-on-market for RENTAL listings here right now (not sales)? A rising rental-DOM trend means longer vacancies and softer asking-rent achievability than the comps imply.
- What's the recent tenant-quality profile in this submarket — average credit score on applications, eviction rate, late-payment / NSF rate, and stable-employment percentage? A property-management company in the area should have these aggregated.
- How much new for-sale + rental construction is in the pipeline within 1–3 miles? Heavy new supply typically softens prices + rents 12–24 months out; constrained supply supports both.
Investment metrics
- 1% rule
- 3.58% ✓
- Cap rate
- 32.35%
- Cash-on-cash
- 93.07%
- DSCR
- 5.14
- GRM
- 2.3
CMA / ARV
- ARV (on-the-fly)
- $117,645
- Comps found
- 12
Show comp detail 12 sales within ~0.75 mi
| Address | Dist | Beds/Ba | Sqft | Sold | Price | $/sf | Match |
|---|---|---|---|---|---|---|---|
| 706 N Louisa Ave | 0.42mi | 2/1.0 (-1) | 1,229 (-3%) | 3mo | $43,500 | $35 | 68 |
| 542 W Wood St | 0.59mi | 3/1.0 | 1,288 (+2%) | 4mo | $125,000 | $97 | 66 |
| 508 E Wallace St | 0.31mi | 3/1.5 | 1,145 (-10%) | 3mo | $107,000 | $93 | 65 |
| 607 W Dewey St | 0.64mi | 3/1.0 | 1,306 (+3%) | 3mo | $129,000 | $99 | 62 |
| 1028 E Chandler St | 0.67mi | 3/1.5 | 1,180 (-7%) | 2mo | $129,000 | $109 | 54 |
| 220 N Aydelotte Ave | 0.71mi | 3/1.5 | 1,186 (-6%) | 3mo | $43,500 | $37 | 52 |
| 619 N Chapman Ave | 0.59mi | 2/2.0 (-1) | 1,182 (-7%) | 3mo | $81,500 | $69 | 50 |
| 1207 N Beard Ave | 0.59mi | 3/1.5 | 1,428 (+13%) | 3mo | $110,000 | $77 | 47 |
| 515 W 10th St | 0.66mi | 3/2.0 | 1,131 (-11%) | 3mo | $43,500 | $38 | 45 |
| 1416 N Mckinley Ave | 0.63mi | 3/1.0 | 1,076 (-15%) | 4mo | $134,900 | $125 | 43 |
| 907 N Mckinley Ave | 0.49mi | 2/2.0 (-1) | 1,086 (-14%) | 4mo | $99,000 | $91 | 42 |
| 635 W Ford St | 0.73mi | 3/1.0 | 1,088 (-14%) | 2mo | $140,000 | $129 | 41 |
Match score weights: distance 35% · size 25% · config 20% · recency 20%. Top-matched comps best support the ARV.
Projected returns pro-forma
-3.0% appreciation · 2.82% rent growth · sell at horizon
- IRR
- 93.7%
- Equity multiple
- 5.34×
- Total profit
- $36,450
- Equity at exit
- $4,473
- IRR
- 96.4%
- Equity multiple
- 11.05×
- Total profit
- $84,418
- Equity at exit
- $2,594
Cash invested: $8,400 (down + closing). Projections, not guarantees.
Landlord ↔ Tenant lean methodology
- Overall (STATE)
- 83 Strongly Landlord-Friendly
- State Oklahoma
- 83 Strongly Landlord-Friendly · R+20
- County
- — inherits STATE
- City
- — inherits STATE
ZIP-level market 74801
- Home prices YoY
- -1.7%
- Rents YoY
- 2.8%
- Active inventory
- 192
- Price-to-rent
- 2.3×
Monthly cashflow live
- Estimated rent
- $1,074 medium interval (Pro) →
- Mortgage (P&I)
- −$157
- Tax from tax record
- −$27 /mo · $322/yr
- Insurance
- −$12
- HOA
- −$0
- Vacancy / Maint / Mgmt
- −$225
- Net cashflow
- $652
Break-even live
UW: 25.0% down · 7.5% · 30yr · 1.5% tax · 5.0% vac · 8.0% maint · 8.0% mgmt
Financing live
Cash to close
- Down payment
- $7,500
- Closing costs
- $900
- Reserves months
- —
- Total cash needed
- —
Loan-product check · same deal, 3 products live
Conventional
25% down · 7.5% · 30yr
- Down + closing
- —
- Monthly P&I
- —
- Monthly cashflow
- —
- DSCR
- —
- Eligible?
- —
Personal DTI + credit; lowest rate.
DSCR
20% down · 8.5% · 30yr
- Down + closing
- —
- Monthly P&I
- —
- Monthly cashflow
- —
- DSCR
- —
- Eligible?
- —
No personal income docs; deal must DSCR.
Hard money
10% down · 12.0% · 12mo
- Down + closing
- —
- Monthly P&I
- —
- Monthly cashflow
- —
- DSCR
- —
- Eligible?
- —
Short-term bridge; refi at stabilization.
Rent comps 4 comps
| Address | Beds | Baths | Sqft | Rent | $/sqft | DOM | Units | Dist |
|---|---|---|---|---|---|---|---|---|
| 721 E Wallace St Shawnee, OK | 2.0 | 1.0 | 1176 | $850 | $0.72 | 4d | 1 | 0.49mi |
| 515 W 10th St Shawnee, OK | 3.0 | 1.0 | 1131 | $825 | $0.73 | 20d | 1 | 0.65mi |
| 319 S Center Ave Shawnee, OK | 3.0 | 2.0 | 1243 | $1,245 | $1.00 | 4d | 1 | 0.94mi |
| 315 S Kennedy Ave Shawnee, OK | 2.0–3.0 | 1.0–2.0 | 979 | $898 | $0.92 | 23d | 5 | 1.23mi |
Listing history 7 events
-
2026-06-19days on market $30,000 Active 5 DOM
-
2026-06-18days on market $30,000 Active 4 DOM
-
2026-06-17days on market $30,000 Active 3 DOM
-
2026-06-17remarks 512-char remark
-
2026-06-16days on market $30,000 Active 2 DOM
-
2026-06-15remarks 446-char remark
-
2026-06-15$30,000 Active 1 DOM
ⓘ Source: listings_history table (triggers on properties + properties_extension) + one-shot
backfill from property_details.listing_events for pre-trigger history.
Tax reassessment forecast OK · Resets to sale price
- Current annual tax
- $322 · $27/mo
- Projected year-2 tax
- $322 · $27/mo
- Expected delta
- $0/yr ($0/mo · 0.0%)
ⓘ Screening estimate from a state-policy table — verify with the county assessor before closing.
Climate risk First Street
- Flood 1/10 Low FEMA zone X (unshaded) · 0% chance over 30 yrs
- Wildfire 4/10 Moderate
- Heat 5/10 Major 7 d/yr ≥109°F today · 18 d/yr by 30 yrs out
- Wind 3/10 Moderate 5% chance of damaging wind over 30 yrs
- Air quality 2/10 Low 1 unhealthy d/yr today · 1 by 30 yrs out
Nearby sold comps map
Loading sold comps map…
Walkable amenities ~0.75 mi
Loading nearby amenities…
Taxation est. · year 1
- Rental income
- $12,884
- − Mortgage interest
- −$1,680
- − Property taxes
- −$322
- − Insurance
- −$150
- − Repairs & maintenance
- −$1,031
- − Management
- −$1,031
- − Depreciation
- −$873
- Taxable income
- $7,797
- Est. tax owed @ 24.0%
- −$1,871
- After-tax cash flow
- $5,947/yr
For passive investors: Depreciation is non-cash, so a rental often shows a tax loss while cash-flowing — sheltering income. Rental losses are passive: they offset passive income freely, and up to $25,000/yr can offset ordinary (W-2) income if you actively participate and your MAGI is under $100k (phasing out to $0 by $150k); unused losses carry forward. On sale, claimed depreciation is recaptured at up to 25%, and gains may owe capital-gains tax (a 1031 exchange can defer both). Figures are a year-1 estimate at your 24.0% rate — not tax advice; consult a CPA.
Schools (NCES district)
- District
- Shawnee
- NCES district ID
- 4027570
- Math proficiency
- 11% ▼ -10.00%
- Reading proficiency
- 17% ▼ -10.00%
- Median HH income
- $32,128
- Composite
- 11.21/100
- National rank
- #9724
- State rank
- #238 of 270 in OK
Livability — Shawnee
- Score
- 63/100
- State rank
- #217
- US rank
- #15593
Category grades
Schools grade is shown separately in the Schools card above.
Census & demographics
- Census place
- Shawnee, OK
- County
- Pottawatomie County · 45,194 people
- City population
- 45,194
- Metro
- Shawnee, OK
- Population (ZIP)
- 21,967
- Household income
- $55,077
- Rent vs Own
- Severe rent burden
- 594.0
Population outlook (Pottawatomie County) Hauer SSP2
- Today (2025)
- 76,622 people
- By 2030
- 78,816 · +2.9%
- By 2040
- 82,766 · +8.0%
- By 2050
- 86,031 · +12.3%
- By 2075
- 93,316 · +21.8%
- By 2100
- 95,820 · +25.1%
Race, ethnicity, and origin ACS 2023
- Neighborhood character
- Predominantly White (67%)
- Race & ethnicity
- White 67% Native American 15% Two or more races 10% Hispanic / Latino 7% Black 3%
- Hispanic origin (detail)
- Mexican 6%
- Common ancestry
- Lithuanian 1% Slovak 1% Italian 1%
- Foreign-born
- 2% · Canada
- Languages at home
- 96% English-only · Spanish 2% Other Asian/Pacific 1%
Political lean MEDSL · Pottawatomie
- 2024 margin
- Solid R (+47.4) · D 25.2% · R 72.7% · Other 2.1%
- 2008→2024 swing
- -9.1pp toward R · 2008: -38.4pp · 2024: -47.4pp
- All cycles
- 2024: R+47.4 2020: R+46.0 2016: R+46.5 2012: R+38.7 2008: R+38.4
Not yet ingested
- Civics
- —
Market trends
- HPI YoY
- ▼ -4.66%
- Current HPI
- 266.7965
- Rent YoY
- ▲ 2.82%
- Metro
- Shawnee, OK
- State GDP YoY
- ▲ 1.55%
- F500 in state
- 6
Industry mix (Fortune 500 HQ in OK)
| Industry | F500 HQs | Revenue |
|---|---|---|
| Energy | 3 | $48B |
|
||
Price history
+81.8% since first listed6 events — show timeline
- 2026-06-14 Listed $30,000 MLSOK
- 2022-03-30 Sold (MLS) $24,900 MLSOK
- 2021-11-15 Pending — MLSOK
- 2021-11-03 Listed $24,900 MLSOK
- 2007-11-05 Sold (Public Records) $22,000 Public Records
- 1998-02-02 Sold (Public Records) $16,500 Public Records
Property tax history
+1.7%/yrLatest (2025): $322 · +4.2% YoY. Source: county tax records.
Cash-flow waterfall
monthlySold comps — $/sqft
last 12 mo · ≤1 miLoading sold comps…