5729 Kay Dr · Fort Worth, TX
Flood risk 1/10 · Minimal
- FEMA flood zone
- X (unshaded)
- Chance of flooding over 30 yrs
- 0.0%
- Est. flood insurance / yr
- $507 – $1,088
Fire risk 2/10 · Minimal
- Est. fire insurance / yr
- $1,222 – $2,270
Heat risk 7/10 · Major
- Hot days now (above 110°F)
- 7 days/yr
- Hot days in 30 yrs
- 21 days/yr
Wind risk 6/10 · Moderate
- Chance of severe wind over 30 yrs
- 27.0%
Air-quality risk 3/10 · Minor
- Unhealthy air days now
- 2 days/yr
- Unhealthy air days in 30 yrs
- 4 days/yr
Risk factors via First Street. Map © Google.
Why this score? — see what drove the B- grade
The composite is a weighted blend of 9 inputs, each scored 0–100. Each bar is that input's sub-score; the figure is the points it added to the 100-point composite (weight × sub-score).
- Cash flow +30.0/30.0
- 1% rule +10.0/10.0
- DSCR +10.0/10.0
- ARV discount +7.5/15.0
- Livability +4.0/5.0
- Condition / age +2.2/5.0
- Rent growth +2.1/5.0
- Schools +2.0/10.0
- Appreciation +0.0/10.0
$75,000
🖨 Deal sheet 📄 Offer letter ✓ Due diligence
Listing remarks
Discover comfort and convenience in this spacious 1,456?sq?ft mobile home featuring 3 bedrooms and 2 full baths. The open-concept layout offers a bright living area that flows into a well-appointed kitchen & acirc; & euro; & rdquo; perfect for family gatherings or quiet evenings at home. The primary suite includes a private bath and generous closet space, while two additional bedrooms provide flexibility for guests, an office, or hobbies. Enjoy modern finishes, durable flooring, and abundant natural light throughout. Outside, you & acirc; & euro; & trade; ll find a private yard ideal for relaxing or entertaining. This home combines affordability with style, making i
Key facts
- Durable flooring
- Private yard
- Modern finishes
Tags
Neighborhood map
What this means for you Summary
Snapshot
- This is a 3-bed/1.0-bath other listed at $75k. Condition is rated fair.
Deal economics
- At list price, monthly cash flow is $886 ($11k/yr) — positive.
- The deal already cash-flows at list — no discount required.
- Meets the 1% rule at list price ($2k rent vs $75k).
- Recommended offer: $74k (1.5% below list) — sets the bar for market timing.
- Cap rate 20.5% vs local median 3.9% in Fort Worth — top-decile yield for the area; either an underpriced asset or a hidden risk that comps aren't pricing in. Stress-test before assuming the spread holds.
Location & tenants
- Location reads 80/100 on livability (#49 in TX, #1,954 nationally) — a professional / high-income tenant draw. Strengths: amenities A+, cost of living A+, housing A+; Watch: schools D+, crime F.
- Fort Worth ISD (urban): math 18% / reading 28% proficiency, ranked #742 of 826 in TX (top 90%) — low school quality limits family demand, transient renter base, plan for 1-2y turnover; 73% free/reduced lunch — lower-income household profile, screen leases tightly.
- Market conditions: Rents soft (-1.6%/yr); 186 active listings in the ZIP; 23 comparable units currently listed for rent nearby; rentals lingering (median 44d on market — plan ~5-8 weeks vacancy on turnover, expect pricing pressure); 52% of comp listings sitting > 30 days — soft ceiling on asking rent; 18,938 units permitted in Tarrant County in 2024 (8,336 in 5+ unit buildings).
- This rent runs 42% of the median local income ($51k/yr) — at the standard rent-burdened threshold; future hikes will face affordability resistance.
Forward outlook
- Local home prices are declining (-3.0%/yr); year-one equity from $519 of loan paydown is wiped out by about $2k of value loss. Plan a longer hold.
- Tarrant County population projected at +41% by 2050 — long-run rental-demand tailwind backs the buy-and-hold thesis.
- At projected returns (-3.0% appreciation + 0.0% rent growth), your $21k cash investment doubles in ~3 years — after that, you're playing with house money.
Negotiation context
- It's been on market 19 days — a 2% lower offer ($74k) is reasonable based on typical stale-listing flexibility.
Risks & watch-outs
- Climate carrying-cost: major wind risk, 27% chance of damaging wind over 30y; extreme-heat days projected 7→21/yr by 2055 (HVAC capex compounding) — expect insurance premiums to compound above CPI over the hold.
Questions for the listing agent
- Have any recent inspections been done? Can we get a copy of the seller's disclosures and any deferred-maintenance estimates?
- Is there a deadline driving the sale (1031 exchange, divorce, estate, relocation)? That informs how much negotiation room exists.
- Schools are D-rated, which usually means shorter tenancies and higher turnover. Who's the typical renter profile here, and what's been the actual vacancy rate?
- Crime grade is F in this area — have there been break-ins, vandalism, or insurance claims at this property in the last 3 years? What carrier currently insures it and at what premium?
- What's the average days-on-market for RENTAL listings here right now (not sales)? A rising rental-DOM trend means longer vacancies and softer asking-rent achievability than the comps imply.
- What's the recent tenant-quality profile in this submarket — average credit score on applications, eviction rate, late-payment / NSF rate, and stable-employment percentage? A property-management company in the area should have these aggregated.
- How much new for-sale + rental construction is in the pipeline within 1–3 miles? Heavy new supply typically softens prices + rents 12–24 months out; constrained supply supports both.
Investment metrics
- 1% rule
- 2.37% ✓
- Cap rate
- 20.46%
- Cash-on-cash
- 50.61%
- DSCR
- 3.25
- GRM
- 3.5
CMA / ARV
No comps found within radius.
Projected returns pro-forma
-3.0% appreciation · 0.0% rent growth · sell at horizon
- IRR
- 45.0%
- Equity multiple
- 2.86×
- Total profit
- $39,078
- Equity at exit
- $11,183
- IRR
- 49.5%
- Equity multiple
- 5.13×
- Total profit
- $86,649
- Equity at exit
- $6,485
Cash invested: $21,000 (down + closing). Projections, not guarantees.
Landlord ↔ Tenant lean methodology
- Overall (STATE)
- 87 Strongly Landlord-Friendly
- State Texas
- 87 Strongly Landlord-Friendly · R+5
- County
- — inherits STATE
- City
- — inherits STATE
ZIP-level market 76119
- Home prices YoY
- -6.4%
- Rents YoY
- -1.6%
- Active inventory
- 186
- Price-to-rent
- 3.5×
Monthly cashflow live
- Estimated rent
- $1,777 high interval (Pro) →
- Mortgage (P&I)
- −$393
- Tax est. 1.5%
- −$94 /mo · $1,125/yr
- Insurance
- −$31
- HOA
- −$0
- Vacancy / Maint / Mgmt
- −$373
- Net cashflow
- $886
Break-even live
UW: 25.0% down · 7.5% · 30yr · 1.5% tax · 5.0% vac · 8.0% maint · 8.0% mgmt
Financing live
Cash to close
- Down payment
- $18,750
- Closing costs
- $2,250
- Reserves months
- —
- Total cash needed
- —
Loan-product check · same deal, 3 products live
Conventional
25% down · 7.5% · 30yr
- Down + closing
- —
- Monthly P&I
- —
- Monthly cashflow
- —
- DSCR
- —
- Eligible?
- —
Personal DTI + credit; lowest rate.
DSCR
20% down · 8.5% · 30yr
- Down + closing
- —
- Monthly P&I
- —
- Monthly cashflow
- —
- DSCR
- —
- Eligible?
- —
No personal income docs; deal must DSCR.
Hard money
10% down · 12.0% · 12mo
- Down + closing
- —
- Monthly P&I
- —
- Monthly cashflow
- —
- DSCR
- —
- Eligible?
- —
Short-term bridge; refi at stabilization.
Rent comps 23 comps
| Address | Beds | Baths | Sqft | Rent | $/sqft | DOM | Units | Dist |
|---|---|---|---|---|---|---|---|---|
| 5641 Willamette Dr Fort Worth, TX | 3.0 | 2.5 | 1631 | $2,150 | $1.32 | 16d | 1 | 0.73mi |
| 5532 Shore Point Trl Fort Worth, TX | 3.0 | 2.5 | 1446 | $1,950 | $1.35 | 43d | 1 | 0.80mi |
| 5664 Shore Point Trl Fort Worth, TX | 3.0 | 2.5 | 1742 | $2,150 | $1.23 | 43d | 1 | 0.80mi |
| 7014 Cadillac Blvd Arlington, TX | 3.0 | 2.0 | 1525 | $2,199 | $1.44 | 43d | 1 | 1.01mi |
| 5702 Shoreline Cir S Fort Worth, TX | 3.0 | 2.0 | 1200 | $1,450 | $1.21 | 43d | 1 | 1.04mi |
| 6905 Forestview Dr Arlington, TX | 3.0 | 2.0 | 1780 | $2,149 | $1.21 | 24d | 1 | 1.12mi |
| 4912 Paces Trl Arlington, TX | 2.0 | 2.0 | 966 | $1,509 | $1.56 | 43d | 1 | 1.23mi |
| 5030 Savannah Club Dr Arlington, TX | 1.0–2.0 | 1.0–2.0 | 843 | $1,396 | $1.66 | 2d | 11 | 1.27mi |
| 348 Spring Branch Ln Kennedale, TX | 3.0 | 2.0 | 1170 | $1,800 | $1.54 | 43d | 1 | 1.31mi |
| 6610 Greenspring Dr Arlington, TX | 3.0 | 2.0 | 1517 | $1,950 | $1.29 | 6d | 1 | 1.32mi |
| 6610 Greenspring Dr Arlington, TX | 3.0 | 2.0 | 1517 | $2,295 | $1.51 | 44d | 1 | 1.32mi |
| 4924 Sigmond Dr Arlington, TX | 1.0–3.0 | 1.0–2.0 | 790 | $1,699 | $2.15 | 1d | 13 | 1.35mi |
| 4933 Wild Holly Ln Arlington, TX | 2.0 | 2.0 | 950 | $1,352 | $1.42 | 43d | 1 | 1.40mi |
| 1001 Boxwood Ln Fort Worth, TX | 3.0 | 2.5 | 1298 | $1,715 | $1.32 | 43d | 1 | 1.43mi |
| 1704 Magnolia Ln Forest Hill, TX | 3.0 | 2.5 | 1298 | $1,675 | $1.29 | 43d | 1 | 1.46mi |
| 404 Briarwood Ln Forest Hill, TX | 3.0 | 2.5 | 1298 | $1,775 | $1.37 | 6d | 1 | 1.47mi |
| 603 Briarwood Ln Forest Hill, TX | 3.0 | 2.5 | 1298 | $1,650 | $1.27 | 24d | 1 | 1.47mi |
| 6601 Treepoint Dr Arlington, TX | 2.0 | 2.0 | 1125 | $1,511 | $1.34 | 3d | 1 | 1.48mi |
| 6601 Treepoint Dr Unit 6634 Arlington, TX | 3.0 | 2.0 | 1050 | $1,718 | $1.64 | 43d | 1 | 1.48mi |
| 6601 Treepoint Dr Unit 6658 Arlington, TX | 2.0 | 2.0 | 1125 | $1,372 | $1.22 | 43d | 1 | 1.48mi |
| 6601 Treepoint Dr Arlington, TX | 2.0 | 2.0 | 950 | $1,470 | $1.55 | 12d | 1 | 1.48mi |
| 6601 Treepoint Dr Unit 3121 Arlington, TX | 3.0 | 2.0 | 1050 | $1,723 | $1.64 | 2d | 1 | 1.48mi |
| 6601 Treepoint Dr Unit 2121 Arlington, TX | 2.0 | 2.0 | 900 | $1,132 | $1.26 | 2d | 1 | 1.48mi |
Listing history 11 events
-
2026-06-15days on market $75,000 Active 19 DOM
-
2026-06-13days on market $75,000 Active 17 DOM
-
2026-06-09days on market $75,000 Active 13 DOM
-
2026-06-08days on market $75,000 Active 12 DOM
-
2026-06-07days on market $75,000 Active 11 DOM
-
2026-06-04days on market $75,000 Active 8 DOM
-
2026-06-03days on market $75,000 Active 7 DOM
-
2026-06-02days on market $75,000 Active 6 DOM
-
2026-06-02days on market $75,000 Active 5 DOM
-
2026-05-31days on market $75,000 Active 4 DOM
-
2026-05-28$75,000 Active
ⓘ Source: listings_history table (triggers on properties + properties_extension) + one-shot
backfill from property_details.listing_events for pre-trigger history.
Climate risk First Street
- Flood 1/10 Low FEMA zone X (unshaded) · 0% chance over 30 yrs
- Wildfire 2/10 Low
- Heat 7/10 Severe 7 d/yr ≥110°F today · 21 d/yr by 30 yrs out
- Wind 6/10 Major 27% chance of damaging wind over 30 yrs
- Air quality 3/10 Moderate 2 unhealthy d/yr today · 4 by 30 yrs out
Nearby sold comps map
Loading sold comps map…
Walkable amenities ~0.75 mi
Loading nearby amenities…
Taxation est. · year 1
- Rental income
- $21,327
- − Mortgage interest
- −$4,201
- − Property taxes
- −$1,125
- − Insurance
- −$375
- − Repairs & maintenance
- −$1,706
- − Management
- −$1,706
- − Depreciation
- −$2,182
- Taxable income
- $10,032
- Est. tax owed @ 24.0%
- −$2,408
- After-tax cash flow
- $8,221/yr
For passive investors: Depreciation is non-cash, so a rental often shows a tax loss while cash-flowing — sheltering income. Rental losses are passive: they offset passive income freely, and up to $25,000/yr can offset ordinary (W-2) income if you actively participate and your MAGI is under $100k (phasing out to $0 by $150k); unused losses carry forward. On sale, claimed depreciation is recaptured at up to 25%, and gains may owe capital-gains tax (a 1031 exchange can defer both). Figures are a year-1 estimate at your 24.0% rate — not tax advice; consult a CPA.
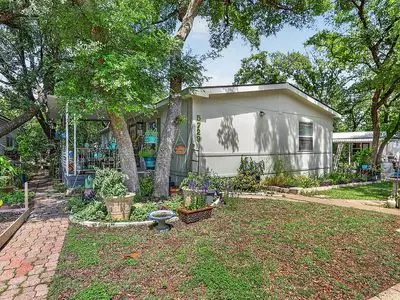
Condition & rehab AI · 1 photo
This mobile home requires significant landscaping and exterior maintenance to improve its curb appeal and value for both resale and rental.
Repairs flagged
- Major Landscaping — Overgrown vegetation and debris need removal.
- Major Exterior painting — Vegetation obscures the exterior, indicating neglect.
- Major Landscaping maintenance — Overgrown vegetation and debris need removal.
- Major Exterior cleaning — Vegetation obscures the exterior, indicating neglect.
Value-add opportunities
- Both Landscaping and exterior cleaning — Improves curb appeal and value for both resale and rental.
- Both Exterior painting — Enhances curb appeal and value for both resale and rental.
Renovation cost estimate screening
| Repair item | Severity | Est. cost |
|---|---|---|
| Landscaping · Overgrown vegetation and debris need removal. | Major | $15,000–50,000 |
| Exterior painting · Vegetation obscures the exterior, indicating neglect. | Major | $15,000–50,000 |
| Landscaping maintenance · Overgrown vegetation and debris need removal. | Major | $15,000–50,000 |
| Exterior cleaning · Vegetation obscures the exterior, indicating neglect. | Major | $15,000–50,000 |
| Total estimated repair cost · 4 items | $60,000–200,000 |
Value-add ROI direction
- Both Landscaping and exterior cleaning — Improves curb appeal and value for both resale and rental. ↑
- Both Exterior painting — Enhances curb appeal and value for both resale and rental. ↑
ⓘ Cost ranges are severity-bucket heuristics (US national rule-of-thumb). Get contractor quotes + a written scope before underwriting a rehab budget.
Schools (NCES district)
- District
- Fort Worth ISD
- NCES district ID
- 4819700
- Math proficiency
- 18% ▼ -16.00%
- Reading proficiency
- 28% ▼ -6.00%
- Median HH income
- $42,109
- Composite
- 19.61/100
- National rank
- #8753
- State rank
- #742 of 826 in TX
Livability — Fort Worth
- Score
- 80/100
- State rank
- #49
- US rank
- #1954
Category grades
Schools grade is shown separately in the Schools card above.
Census & demographics
- Census place
- Fort Worth, TX
- County
- Tarrant County · 2,033,669 people
- City population
- 911,619
- Metro
- Dallas-Fort Worth-Arlington, TX
- Population (ZIP)
- 52,974
- Household income
- $51,267
- Rent vs Own
- Severe rent burden
- 2221.0
Population outlook (Tarrant County) Hauer SSP2
- Today (2025)
- 2,380,417 people
- By 2030
- 2,578,900 · +8.3%
- By 2040
- 2,974,995 · +25.0%
- By 2050
- 3,350,489 · +40.8%
- By 2075
- 4,216,909 · +77.2%
- By 2100
- 4,741,527 · +99.2%
Race, ethnicity, and origin ACS 2023
- Neighborhood character
- Diverse neighborhood (Simpson 0.60)
- Race & ethnicity
- Hispanic / Latino 51% Black 36% Two or more races 26% White 8% Asian 3%
- Hispanic origin (detail)
- Mexican 44%
- Foreign-born
- 25% · Canada, Philippines
- Languages at home
- 54% English-only · Spanish 42% Other Indo-European 2% Other Asian/Pacific 1%
Political lean MEDSL · Tarrant
- 2024 margin
- Lean R (+5.1) · D 46.7% · R 51.9% · Other 1.4%
- 2008→2024 swing
- +6.6pp toward D · 2008: -11.7pp · 2024: -5.1pp
- All cycles
- 2024: R+5.1 2020: D+0.2 2016: R+8.7 2012: R+15.7 2008: R+11.7
Not yet ingested
- Civics
- —
Market trends
- HPI YoY
- ▼ -23.04%
- Current HPI
- 336.7941
- Rent YoY
- ▼ -1.61%
- Metro
- Dallas-Fort Worth-Arlington, TX
- State GDP YoY
- ▲ 3.95%
- F500 in state
- 110
Industry mix (Fortune 500 HQ in TX)
| Industry | F500 HQs | Revenue |
|---|---|---|
| Energy | 16 | $1,198B |
|
||
| Technology | 5 | $198B |
|
||
| Engineering / Construction | 4 | $72B |
|
||
| Energy Services | 3 | $60B |
|
||
| Utilities | 3 | $41B |
|
||
| Healthcare | 2 | $330B |
|
||
Price history
1 event — show timeline
- 2026-05-28 Listed $75,000 FSBO.com
Cash-flow waterfall
monthlySold comps — $/sqft
last 12 mo · ≤1 miLoading sold comps…