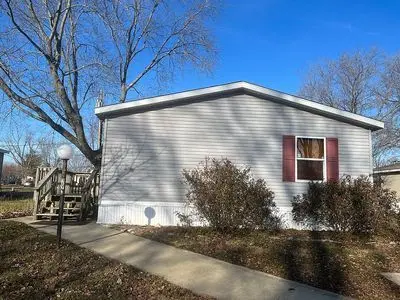
291 Du Page St · Lake of the Woods, IL
Flood risk 1/10 · Minimal
- FEMA flood zone
- X (unshaded)
- Chance of flooding over 30 yrs
- 0.0%
- Est. flood insurance / yr
- $507 – $1,088
Fire risk 1/10 · Minimal
- Est. fire insurance / yr
- $804 – $1,492
Heat risk 3/10 · Minor
- Hot days now (above 103°F)
- 7 days/yr
- Hot days in 30 yrs
- 19 days/yr
Wind risk 2/10 · Minimal
- Chance of severe wind over 30 yrs
- 1.0%
Air-quality risk 2/10 · Minimal
- Unhealthy air days now
- 1 days/yr
- Unhealthy air days in 30 yrs
- 1 days/yr
Risk factors via First Street. Map © Google.
Why this score? — see what drove the B- grade
The composite is a weighted blend of 9 inputs, each scored 0–100. Each bar is that input's sub-score; the figure is the points it added to the 100-point composite (weight × sub-score).
- Cash flow +30.0/30.0
- 1% rule +10.0/10.0
- DSCR +10.0/10.0
- ARV discount +7.5/15.0
- Schools +3.5/10.0
- Livability +3.3/5.0
- Rent growth +2.5/5.0
- Condition / age +2.5/5.0
- Appreciation +0.0/10.0
$71,000
🖨 Deal sheet 📄 Offer letter ✓ Due diligence
Listing remarks
Well-Maintained Manufactured Home! This home is in great shape and has been lovingly cared for. A brand-new roof was installed in 2024, and the bill of materials will be provided with the purchase for your peace of mind. The kitchen and laundry come fully equipped with a dryer, microwave, stove, and refrigerator. All purchased in 2023, in excellent working condition, and gently used. Out back, you& apos; ll find a handy 8 x 8 ft. storage shed, perfect for keeping tools, lawn equipment, and seasonal items organized and out of the way. Award-Winning Schools: This home is served by the highly regarded Mahomet-Seymour School District (CUSD #3) for grades PreK & acirc; & euro; &
Key facts
- Brand new roof
- Storage shed
- Built 2008
Tags
Neighborhood map
What this means for you Summary
Snapshot
- This is a 3-bed/2.0-bath manufactured listed at $71k.
Deal economics
- At list price, monthly cash flow is $1k ($15k/yr) — positive.
- The deal already cash-flows at list — no discount required.
- Meets the 1% rule at list price ($2k rent vs $71k).
Location & tenants
- Location reads 66/100 on livability (#574 in IL) — a middle-class / working-renter tenant base. Strengths: crime A+, cost of living A+, housing A+; Watch: schools D-, amenities F, commute F.
- Mahomet-Seymour CUSD 3 (town): math 40% / reading 35% proficiency, ranked #140 of 620 in IL (top 23%) — families likely to look elsewhere, expect single-tenant / working-renter base with shorter leases; only 19% free/reduced lunch — higher-income household profile.
- Market conditions: 132 active listings in the ZIP; high-income renter base; 573 units permitted in Champaign County in 2024 (359 in 5+ unit buildings).
Forward outlook
- Local home prices are declining (-3.0%/yr); year-one equity from $491 of loan paydown is wiped out by about $2k of value loss. Plan a longer hold.
- Champaign County population projected at +15% by 2050 — modest demand growth; plan on rents tracking national, not racing it.
- At projected returns (-3.0% appreciation + 3.0% rent growth), your $20k cash investment doubles in ~2 years — after that, you're playing with house money.
Negotiation context
- Only 8 days on market — expect competitive offers; lowballing is unlikely to land.
Questions for the listing agent
- Is there a deadline driving the sale (1031 exchange, divorce, estate, relocation)? That informs how much negotiation room exists.
- Schools are D-rated, which usually means shorter tenancies and higher turnover. Who's the typical renter profile here, and what's been the actual vacancy rate?
- What's the average days-on-market for RENTAL listings here right now (not sales)? A rising rental-DOM trend means longer vacancies and softer asking-rent achievability than the comps imply.
- What's the recent tenant-quality profile in this submarket — average credit score on applications, eviction rate, late-payment / NSF rate, and stable-employment percentage? A property-management company in the area should have these aggregated.
- How much new for-sale + rental construction is in the pipeline within 1–3 miles? Heavy new supply typically softens prices + rents 12–24 months out; constrained supply supports both.
Investment metrics
- 1% rule
- 3.11% ✓
- Cap rate
- 27.53%
- Cash-on-cash
- 75.84%
- DSCR
- 4.37
- GRM
- 2.7
CMA / ARV
No comps found within radius.
Projected returns pro-forma
-3.0% appreciation · 3.0% rent growth · sell at horizon
- IRR
- 75.8%
- Equity multiple
- 4.45×
- Total profit
- $68,554
- Equity at exit
- $10,586
- IRR
- 79.5%
- Equity multiple
- 9.19×
- Total profit
- $162,878
- Equity at exit
- $6,139
Cash invested: $19,880 (down + closing). Projections, not guarantees.
Landlord ↔ Tenant lean methodology
- Overall (STATE)
- 43 Moderately Tenant-Leaning
- State Illinois
- 43 Moderately Tenant-Leaning · D+7
- County
- — inherits STATE
- City
- — inherits STATE
ZIP-level market 61853
- Home prices YoY
- -26.5%
- Active inventory
- 132
- Price-to-rent
- 2.7×
Monthly cashflow live
- Estimated rent
- $2,212 medium interval (Pro) →
- Mortgage (P&I)
- −$372
- Tax est. 1.5%
- −$89 /mo · $1,065/yr
- Insurance
- −$30
- HOA
- −$0
- Vacancy / Maint / Mgmt
- −$464
- Net cashflow
- $1,256
Break-even live
UW: 25.0% down · 7.5% · 30yr · 1.5% tax · 5.0% vac · 8.0% maint · 8.0% mgmt
Financing live
Cash to close
- Down payment
- $17,750
- Closing costs
- $2,130
- Reserves months
- —
- Total cash needed
- —
Loan-product check · same deal, 3 products live
Conventional
25% down · 7.5% · 30yr
- Down + closing
- —
- Monthly P&I
- —
- Monthly cashflow
- —
- DSCR
- —
- Eligible?
- —
Personal DTI + credit; lowest rate.
DSCR
20% down · 8.5% · 30yr
- Down + closing
- —
- Monthly P&I
- —
- Monthly cashflow
- —
- DSCR
- —
- Eligible?
- —
No personal income docs; deal must DSCR.
Hard money
10% down · 12.0% · 12mo
- Down + closing
- —
- Monthly P&I
- —
- Monthly cashflow
- —
- DSCR
- —
- Eligible?
- —
Short-term bridge; refi at stabilization.
Listing history 7 events
-
2026-06-18days on market $71,000 Active 8 DOM
-
2026-06-17days on market $71,000 Active 7 DOM
-
2026-06-16days on market $71,000 Active 6 DOM
-
2026-06-15days on market $71,000 Active 5 DOM
-
2026-06-14days on market $71,000 Active 3 DOM
-
2026-06-13remarks 683-char remark
-
2026-06-13$71,000 Active 2 DOM
ⓘ Source: listings_history table (triggers on properties + properties_extension) + one-shot
backfill from property_details.listing_events for pre-trigger history.
Climate risk First Street
- Flood 1/10 Low FEMA zone X (unshaded) · 0% chance over 30 yrs
- Wildfire 1/10 Low
- Heat 3/10 Moderate 7 d/yr ≥103°F today · 19 d/yr by 30 yrs out
- Wind 2/10 Low 100% chance of damaging wind over 30 yrs
- Air quality 2/10 Low 1 unhealthy d/yr today · 1 by 30 yrs out
Nearby sold comps map
Loading sold comps map…
Walkable amenities ~0.75 mi
Loading nearby amenities…
Taxation est. · year 1
- Rental income
- $26,539
- − Mortgage interest
- −$3,977
- − Property taxes
- −$1,065
- − Insurance
- −$355
- − Repairs & maintenance
- −$2,123
- − Management
- −$2,123
- − Depreciation
- −$2,065
- Taxable income
- $14,830
- Est. tax owed @ 24.0%
- −$3,559
- After-tax cash flow
- $11,519/yr
For passive investors: Depreciation is non-cash, so a rental often shows a tax loss while cash-flowing — sheltering income. Rental losses are passive: they offset passive income freely, and up to $25,000/yr can offset ordinary (W-2) income if you actively participate and your MAGI is under $100k (phasing out to $0 by $150k); unused losses carry forward. On sale, claimed depreciation is recaptured at up to 25%, and gains may owe capital-gains tax (a 1031 exchange can defer both). Figures are a year-1 estimate at your 24.0% rate — not tax advice; consult a CPA.
Schools (NCES district)
- District
- Mahomet-Seymour CUSD 3
- NCES district ID
- 1724060
- Math proficiency
- 40% ▼ -8.00%
- Reading proficiency
- 35% ▼ -15.00%
- Median HH income
- $73,748
- Composite
- 34.72/100
- National rank
- #5134
- State rank
- #140 of 620 in IL
Livability — Lake of the Woods
- Score
- 66/100
- State rank
- #574
- US rank
- #12058
Category grades
Schools grade is shown separately in the Schools card above.
Census & demographics
- Census place
- Lake of the Woods, IL
- County
- Champaign County · 182,148 people
- Metro
- Champaign-Urbana, IL
- Population (ZIP)
- 14,831
- Household income
- $115,512
- Rent vs Own
- Severe rent burden
- 163.0
Population outlook (Champaign County) Hauer SSP2
- Today (2025)
- 223,848 people
- By 2030
- 231,416 · +3.4%
- By 2040
- 244,321 · +9.1%
- By 2050
- 256,432 · +14.6%
- By 2075
- 285,823 · +27.7%
- By 2100
- 296,406 · +32.4%
Race, ethnicity, and origin ACS 2023
- Neighborhood character
- Predominantly White (89%)
- Race & ethnicity
- White 89% Hispanic / Latino 5% Two or more races 3% Asian 3%
- Hispanic origin (detail)
- Mexican 5%
- Common ancestry
- Italian 3% Iranian 2% Romanian 2%
- Foreign-born
- 5% · Canada, China
- Languages at home
- 92% English-only · Spanish 4% Other Indo-European 2% French/Haitian/Cajun 1%
Political lean MEDSL · Champaign
- 2024 margin
- Strong D (+24.1) · D 61.3% · R 37.2% · Other 1.5%
- 2008→2024 swing
- +6.6pp toward D · 2008: 17.5pp · 2024: 24.1pp
- All cycles
- 2024: D+24.1 2020: D+22.8 2016: D+18.4 2012: D+6.8 2008: D+17.5
Not yet ingested
- Civics
- —
Market trends
- HPI YoY
- ▼ -72.54%
- Current HPI
- 200.9388
- Rent YoY
- —
- Metro
- Champaign-Urbana, IL
- State GDP YoY
- ▲ 1.59%
- F500 in state
- 60
Industry mix (Fortune 500 HQ in IL)
| Industry | F500 HQs | Revenue |
|---|---|---|
| Insurance | 4 | $201B |
|
||
| Consumer Goods | 4 | $87B |
|
||
| Industrial Machinery | 3 | $64B |
|
||
| Healthcare | 2 | $55B |
|
||
| Retail / Pharmacy | 1 | $148B |
|
||
| Agriculture / Food | 1 | $86B |
|
||
Price history
+18.3% since first listed2 events — show timeline
- 2026-06-11 Listed $71,000 FSBO.com
- 2022-12-13 Price Changed $60,000 FSBO.com
Cash-flow waterfall
monthlySold comps — $/sqft
last 12 mo · ≤1 miLoading sold comps…