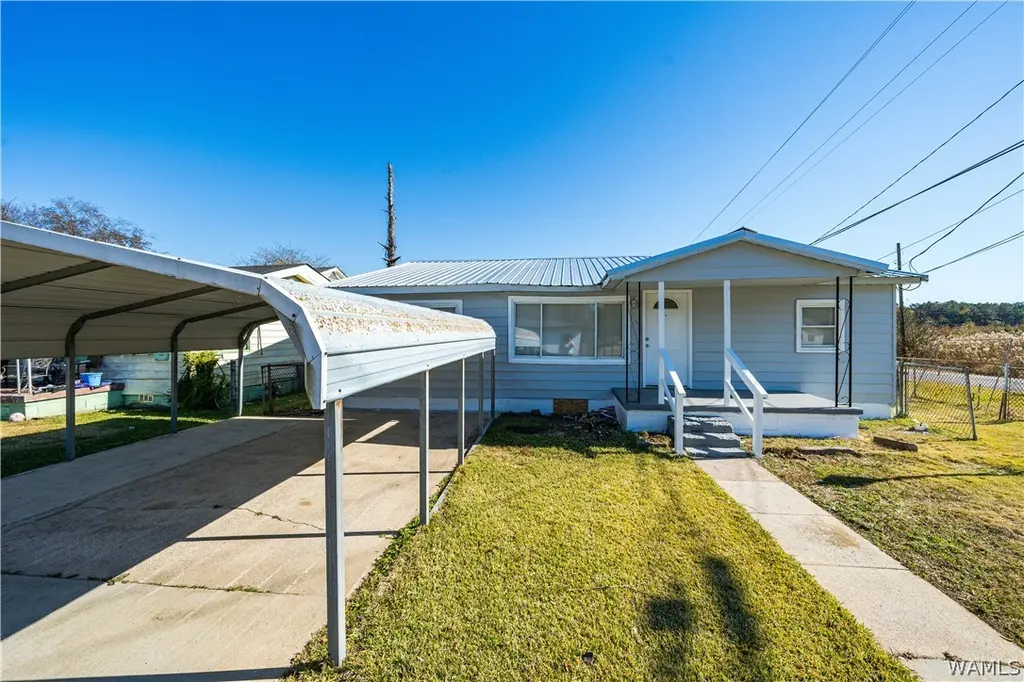
3100 Taylor Cir · Tuscaloosa, AL
Flood risk 1/10 · Minimal
- FEMA flood zone
- X (unshaded)
- Chance of flooding over 30 yrs
- 0.0%
- Est. flood insurance / yr
- $507 – $1,088
Fire risk 2/10 · Minimal
- Est. fire insurance / yr
- $916 – $1,700
Heat risk 7/10 · Major
- Hot days now (above 108°F)
- 7 days/yr
- Hot days in 30 yrs
- 20 days/yr
Wind risk 6/10 · Moderate
- Chance of severe wind over 30 yrs
- 60.0%
Air-quality risk 1/10 · Minimal
- Unhealthy air days now
- 0 days/yr
- Unhealthy air days in 30 yrs
- 0 days/yr
Risk factors via First Street. Map © Google.
Why this score? — see what drove the B+ grade
The composite is a weighted blend of 9 inputs, each scored 0–100. Each bar is that input's sub-score; the figure is the points it added to the 100-point composite (weight × sub-score).
- Cash flow +30.0/30.0
- ARV discount +15.0/15.0
- DSCR +10.0/10.0
- 1% rule +8.9/10.0
- Rent growth +4.1/5.0
- Livability +3.9/5.0
- Schools +2.5/10.0
- Condition / age +2.5/5.0
- Appreciation +0.0/10.0
$130,900
🖨 Deal sheet 📄 Offer letter ✓ Due diligence
Listing remarks MLS
Attention Investors!!! Check out this property in Tuscaloosa with 4 beds, 2 baths, renovated with granite counters, luxury flooring throughout, and a carport! Currently rented for $1200. Lease runs through 4/30/2028
Key facts
- Luxury flooring
- Carport
- Recently renovated
Tags
Neighborhood map
What this means for you Summary
Snapshot
- This is a 4-bed/2.0-bath single-family listed at $131k.
Deal economics
- At list price, monthly cash flow is $637 ($8k/yr) — positive.
- The deal already cash-flows at list — no discount required.
- Meets the 1% rule at list price ($2k rent vs $131k).
- Recommended offer: $115k (12.0% below list) — sets the bar for market timing.
- Cap rate 12.1% vs local median 3.4% in Tuscaloosa — top-decile yield for the area; either an underpriced asset or a hidden risk that comps aren't pricing in. Stress-test before assuming the spread holds.
Location & tenants
- Location reads 77/100 on livability (#9 in AL, #2,909 nationally) — a middle-class / working-renter tenant base. Strengths: amenities A+, health & safety A+, cost of living A; Watch: crime F, employment D-.
- Tuscaloosa City (urban): math 19% / reading 40% proficiency, ranked #74 of 129 in AL (top 57%) — low school quality limits family demand, transient renter base, plan for 1-2y turnover.
- Market conditions: Rents rising fast (+6.3%/yr); 306 active listings in the ZIP; 4 comparable units currently listed for rent nearby; rentals lingering (median 44d on market — plan ~5-8 weeks vacancy on turnover, expect pricing pressure); 50% of comp listings sitting > 30 days — soft ceiling on asking rent; lower-income renter base — watch delinquency; 622 units permitted in Tuscaloosa County in 2024 (69 in 5+ unit buildings).
- At $1,822/mo this rent would consume 75% of the median local household income ($29k/yr) (locally 3997% of renters already pay >50% of income on rent) — very limited rent-growth headroom before tenants either downsize or default.
Forward outlook
- Local home prices are declining (-3.0%/yr); year-one equity from $905 of loan paydown is wiped out by about $4k of value loss. Plan a longer hold.
- Tuscaloosa County population projected at +26% by 2050 — long-run rental-demand tailwind backs the buy-and-hold thesis.
- At projected returns (-3.0% appreciation + 6.3% rent growth), your $37k cash investment doubles in ~6 years — after that, you're playing with house money.
Negotiation context
- It's been on market 720 days — a 12% lower offer ($115k) is reasonable based on typical stale-listing flexibility.
- 3 sale attempts since 5y ago; this cycle's ask is 10808% above the opening price — seller raised mid-cycle; expect resistance to lowballs.
Risks & watch-outs
- Watch-outs: built in 1945 — expect roof / HVAC / electrical / plumbing capex.
- Climate carrying-cost: major wind risk, 60% chance of damaging wind over 30y; extreme-heat days projected 7→20/yr by 2055 (HVAC capex compounding) — expect insurance premiums to compound above CPI over the hold.
Questions for the listing agent
- It's been on market 720 days. Have you received any prior offers? Is the seller open to a 12% concession, seller financing, or rate buy-down credit?
- Built in 1945 — when were the roof, HVAC, electrical panel, plumbing, and water heater last replaced?
- Why hasn't it sold? Are there any deal-killer items the seller is aware of (foundation, flood, title, zoning, code violations)?
- Is there a deadline driving the sale (1031 exchange, divorce, estate, relocation)? That informs how much negotiation room exists.
- Crime grade is F in this area — have there been break-ins, vandalism, or insurance claims at this property in the last 3 years? What carrier currently insures it and at what premium?
- What's the average days-on-market for RENTAL listings here right now (not sales)? A rising rental-DOM trend means longer vacancies and softer asking-rent achievability than the comps imply.
- What's the recent tenant-quality profile in this submarket — average credit score on applications, eviction rate, late-payment / NSF rate, and stable-employment percentage? A property-management company in the area should have these aggregated.
- How much new for-sale + rental construction is in the pipeline within 1–3 miles? Heavy new supply typically softens prices + rents 12–24 months out; constrained supply supports both.
Investment metrics
- 1% rule
- 1.39% ✓
- Cap rate
- 12.13%
- Cash-on-cash
- 20.84%
- DSCR
- 1.93
- GRM
- 6.0
CMA / ARV
- ARV (median comp)
- $180,442
- List price
- $130,900
- Delta
- -27.46%
- Verdict
- UNDERPRICED
- Comps
- 20 within 1.0 mi
Show comp detail 10 sales within ~0.75 mi
| Address | Dist | Beds/Ba | Sqft | Sold | Price | $/sf | Match |
|---|---|---|---|---|---|---|---|
| 6616 36th St | 0.36mi | 3/1.5 (-1) | 1,472 (+2%) | 6mo | $190,000 | $129 | 67 |
| 3517 66th Ave | 0.30mi | 4/2.0 | 1,494 (+4%) | 20mo | $191,500 | $128 | 63 |
| 3216 Culver Rd | 0.53mi | 3/2.0 (-1) | 1,521 (+6%) | 5mo | $70,000 | $46 | 57 |
| 3820 64th Ave | 0.50mi | 3/2.0 (-1) | 1,450 (+1%) | 20mo | $158,000 | $109 | 54 |
| 3219 Westlee Dr | 0.59mi | 3/2.0 (-1) | 1,572 (+9%) | 6mo | $155,000 | $99 | 47 |
| 3909 68th Ave | 0.58mi | 3/1.5 (-1) | 1,375 (-4%) | 19mo | $189,900 | $138 | 42 |
| 4894 Virginia Cir | 0.73mi | 3/2.0 (-1) | 1,350 (-6%) | 12mo | $157,000 | $116 | 40 |
| 3000 52nd Ct | 0.50mi | 3/2.0 (-1) | 1,600 (+11%) | 16mo | $217,500 | $136 | 40 |
| 5006 Virginia Cir | 0.73mi | 3/1.0 (-1) | 1,248 (-13%) | 2mo | $164,000 | $131 | 32 |
| 3309 Westlee Dr | 0.63mi | 3/2.0 (-1) | 1,224 (-15%) | 11mo | $189,900 | $155 | 32 |
Match score weights: distance 35% · size 25% · config 20% · recency 20%. Top-matched comps best support the ARV.
Projected returns pro-forma
-3.0% appreciation · 6.29% rent growth · sell at horizon
- IRR
- 16.6%
- Equity multiple
- 1.70×
- Total profit
- $25,528
- Equity at exit
- $19,518
- IRR
- 27.3%
- Equity multiple
- 3.77×
- Total profit
- $101,653
- Equity at exit
- $11,318
Cash invested: $36,652 (down + closing). Projections, not guarantees.
Landlord ↔ Tenant lean methodology
- Overall (STATE)
- 90 Strongly Landlord-Friendly
- State Alabama
- 90 Strongly Landlord-Friendly · R+15
- County
- — inherits STATE
- City
- — inherits STATE
ZIP-level market 35401
- Rents YoY
- 6.3%
- Active inventory
- 306
- Price-to-rent
- 6.0×
Monthly cashflow live
- Estimated rent
- $1,822 medium interval (Pro) →
- Mortgage (P&I)
- −$686
- Tax from tax record
- −$62 /mo · $744/yr
- Insurance
- −$55
- HOA
- −$0
- Vacancy / Maint / Mgmt
- −$383
- Net cashflow
- $637
Break-even live
UW: 25.0% down · 7.5% · 30yr · 1.5% tax · 5.0% vac · 8.0% maint · 8.0% mgmt
Financing live
Cash to close
- Down payment
- $32,725
- Closing costs
- $3,927
- Reserves months
- —
- Total cash needed
- —
Loan-product check · same deal, 3 products live
Conventional
25% down · 7.5% · 30yr
- Down + closing
- —
- Monthly P&I
- —
- Monthly cashflow
- —
- DSCR
- —
- Eligible?
- —
Personal DTI + credit; lowest rate.
DSCR
20% down · 8.5% · 30yr
- Down + closing
- —
- Monthly P&I
- —
- Monthly cashflow
- —
- DSCR
- —
- Eligible?
- —
No personal income docs; deal must DSCR.
Hard money
10% down · 12.0% · 12mo
- Down + closing
- —
- Monthly P&I
- —
- Monthly cashflow
- —
- DSCR
- —
- Eligible?
- —
Short-term bridge; refi at stabilization.
Rent comps 4 comps
| Address | Beds | Baths | Sqft | Rent | $/sqft | DOM | Units | Dist |
|---|---|---|---|---|---|---|---|---|
| 5022 Virginia Cir Tuscaloosa, AL | 3.0 | 1.5 | 1161 | $1,350 | $1.16 | 43d | 1 | 0.70mi |
| 4416 Tari St Tuscaloosa, AL | 3.0 | 2.0 | 1259 | $1,700 | $1.35 | 13d | 1 | 1.38mi |
| 3499 Joyce Lewis Ave Tuscaloosa, AL | 3.0 | 2.0 | 1340 | $1,700 | $1.27 | 21d | 1 | 1.38mi |
| 4342 Tari St Tuscaloosa, AL | 3.0 | 2.0 | 1340 | $1,750 | $1.31 | 43d | 1 | 1.44mi |
Listing history 32 events
-
2026-06-18days on market $130,900 Active 720 DOM
-
2026-06-17days on market $130,900 Active 719 DOM
-
2026-06-16days on market $130,900 Active 718 DOM
-
2026-06-15days on market $130,900 Active 717 DOM
-
2026-06-14days on market $130,900 Active 715 DOM
-
2026-06-13days on market $130,900 Active 714 DOM
-
2026-06-10days on market $130,900 Active 712 DOM
-
2026-06-09days on market $130,900 Active 711 DOM
-
2026-06-08days on market $130,900 Active 710 DOM
-
2026-06-07days on market $130,900 Active 709 DOM
-
2026-06-05days on market $130,900 Active 706 DOM
-
2026-06-03days on market $130,900 Active 705 DOM
-
2026-06-02days on market $130,900 Active 704 DOM
-
2026-06-01days on market $130,900 Active 703 DOM
-
2026-05-31days on market $130,900 Active 702 DOM
-
2026-05-30days on market $130,900 Active 701 DOM
-
2026-04-20historical $1,200
-
2026-03-11$1,200
-
2026-02-25price $130,900 215-char remark
Show marketing remark (215 chars)
Attention Investors!!! Check out this property in Tuscaloosa with 4 beds, 2 baths, renovated with granite counters, luxury flooring throughout, and a carport! Currently rented for $1200. Lease runs through 4/30/2028
-
2025-08-28price $135,900 215-char remark
Show marketing remark (215 chars)
Attention Investors!!! Check out this property in Tuscaloosa with 4 beds, 2 baths, renovated with granite counters, luxury flooring throughout, and a carport! Currently rented for $1200. Lease runs through 4/30/2028
-
2025-08-19price $137,900 215-char remark
Show marketing remark (215 chars)
Attention Investors!!! Check out this property in Tuscaloosa with 4 beds, 2 baths, renovated with granite counters, luxury flooring throughout, and a carport! Currently rented for $1200. Lease runs through 4/30/2028
-
2025-03-19price $139,900 215-char remark
Show marketing remark (215 chars)
Attention Investors!!! Check out this property in Tuscaloosa with 4 beds, 2 baths, renovated with granite counters, luxury flooring throughout, and a carport! Currently rented for $1200. Lease runs through 4/30/2028
-
2025-01-27price $140,000 215-char remark
Show marketing remark (215 chars)
Attention Investors!!! Check out this property in Tuscaloosa with 4 beds, 2 baths, renovated with granite counters, luxury flooring throughout, and a carport! Currently rented for $1200. Lease runs through 4/30/2028
-
2024-08-14price $130,000 215-char remark
Show marketing remark (215 chars)
Attention Investors!!! Check out this property in Tuscaloosa with 4 beds, 2 baths, renovated with granite counters, luxury flooring throughout, and a carport! Currently rented for $1200. Lease runs through 4/30/2028
-
2024-07-14price $140,000 215-char remark
Show marketing remark (215 chars)
Attention Investors!!! Check out this property in Tuscaloosa with 4 beds, 2 baths, renovated with granite counters, luxury flooring throughout, and a carport! Currently rented for $1200. Lease runs through 4/30/2028
-
2024-06-30price $150,000 215-char remark
Show marketing remark (215 chars)
Attention Investors!!! Check out this property in Tuscaloosa with 4 beds, 2 baths, renovated with granite counters, luxury flooring throughout, and a carport! Currently rented for $1200. Lease runs through 4/30/2028
-
2024-06-24$130,000 Active 215-char remark
Show marketing remark (215 chars)
Attention Investors!!! Check out this property in Tuscaloosa with 4 beds, 2 baths, renovated with granite counters, luxury flooring throughout, and a carport! Currently rented for $1200. Lease runs through 4/30/2028
-
2022-01-04soldstatus $130,000
-
2021-12-06soldstatus $291,000
-
2021-09-28soldstatus $31,000 157-char remark
Show marketing remark (157 chars)
Corner Lot-Great opportunity for investors or first time home buyers. "SOLD AS IS" convenient drive to Stillman College and University of Alabama.
-
2021-07-23$45,000 157-char remark
Show marketing remark (157 chars)
Corner Lot-Great opportunity for investors or first time home buyers. "SOLD AS IS" convenient drive to Stillman College and University of Alabama.
-
2020-07-14soldstatus $19,000
ⓘ Source: listings_history table (triggers on properties + properties_extension) + one-shot
backfill from property_details.listing_events for pre-trigger history.
Tax reassessment forecast AL · Resets to sale price
- Current annual tax
- $744 · $62/mo
- Projected year-2 tax
- $744 · $62/mo
- Expected delta
- $0/yr ($0/mo · 0.0%)
ⓘ Screening estimate from a state-policy table — verify with the county assessor before closing.
Climate risk First Street
- Flood 1/10 Low FEMA zone X (unshaded) · 0% chance over 30 yrs
- Wildfire 2/10 Low
- Heat 7/10 Severe 7 d/yr ≥108°F today · 20 d/yr by 30 yrs out
- Wind 6/10 Major 60% chance of damaging wind over 30 yrs
- Air quality 1/10 Low 0 unhealthy d/yr today · 0 by 30 yrs out
Nearby sold comps map
Loading sold comps map…
Walkable amenities ~0.75 mi
Loading nearby amenities…
Taxation est. · year 1
- Rental income
- $21,867
- − Mortgage interest
- −$7,332
- − Property taxes
- −$744
- − Insurance
- −$654
- − Repairs & maintenance
- −$1,749
- − Management
- −$1,749
- − Depreciation
- −$3,808
- Taxable income
- $5,829
- Est. tax owed @ 24.0%
- −$1,399
- After-tax cash flow
- $6,240/yr
For passive investors: Depreciation is non-cash, so a rental often shows a tax loss while cash-flowing — sheltering income. Rental losses are passive: they offset passive income freely, and up to $25,000/yr can offset ordinary (W-2) income if you actively participate and your MAGI is under $100k (phasing out to $0 by $150k); unused losses carry forward. On sale, claimed depreciation is recaptured at up to 25%, and gains may owe capital-gains tax (a 1031 exchange can defer both). Figures are a year-1 estimate at your 24.0% rate — not tax advice; consult a CPA.
Schools (NCES district)
- District
- Tuscaloosa City
- NCES district ID
- 0103360
- Math proficiency
- 19% ▼ -24.00%
- Reading proficiency
- 40% ▼ -1.00%
- Median HH income
- $37,474
- Composite
- 24.51/100
- National rank
- #7647
- State rank
- #74 of 129 in AL
Livability — Tuscaloosa
- Score
- 77/100
- State rank
- #9
- US rank
- #2909
Category grades
Schools grade is shown separately in the Schools card above.
Census & demographics
- Census place
- Tuscaloosa, AL
- County
- Tuscaloosa County · 206,491 people
- City population
- 134,228
- Metro
- Tuscaloosa, AL
- Population (ZIP)
- 43,459
- Household income
- $29,152
- Rent vs Own
- Severe rent burden
- 3997.0
Population outlook (Tuscaloosa County) Hauer SSP2
- Today (2025)
- 228,293 people
- By 2030
- 240,551 · +5.4%
- By 2040
- 263,856 · +15.6%
- By 2050
- 286,491 · +25.5%
- By 2075
- 335,783 · +47.1%
- By 2100
- 370,520 · +62.3%
Race, ethnicity, and origin ACS 2023
- Neighborhood character
- Diverse neighborhood (Simpson 0.58)
- Race & ethnicity
- Black 47% White 44% Hispanic / Latino 5% Two or more races 4% Asian 2%
- Common ancestry
- Slovak 2% Italian 1% Romanian 1%
- Foreign-born
- 3% · Canada, China
- Languages at home
- 96% English-only · Spanish 2% Other Indo-European 1% Chinese 1%
Political lean MEDSL · Tuscaloosa
- 2024 margin
- Strong R (+20.4) · D 39.4% · R 59.8%
- 2008→2024 swing
- -4.4pp toward R · 2008: -16.0pp · 2024: -20.4pp
- All cycles
- 2024: R+20.4 2020: R+14.8 2016: R+19.5 2012: R+17.4 2008: R+16.0
Not yet ingested
- Civics
- —
Market trends
- HPI YoY
- ▼ -191.40%
- Current HPI
- 179.8335
- Rent YoY
- ▲ 6.29%
- Metro
- Tuscaloosa, AL
- State GDP YoY
- ▲ 2.94%
- F500 in state
- 4
Industry mix (Fortune 500 HQ in AL)
| Industry | F500 HQs | Revenue |
|---|---|---|
| Financial Services | 1 | $8B |
|
||
| Healthcare | 1 | $5B |
|
||
Price history
-93.7% since first listed16 events — show timeline
- 2026-04-20 Rental Removed $1,200 SHOWMOJO
- 2026-03-11 Listed for Rent $1,200 SHOWMOJO
- 2026-02-25 Price Changed $130,900 WAMLS
- 2025-08-28 Price Changed $135,900 WAMLS
- 2025-08-19 Price Changed $137,900 WAMLS
- 2025-03-19 Price Changed $139,900 WAMLS
- 2025-01-27 Price Changed $140,000 WAMLS
- 2024-08-14 Price Changed $130,000 WAMLS
- 2024-07-14 Price Changed $140,000 WAMLS
- 2024-06-30 Price Changed $150,000 WAMLS
- 2024-06-24 Listed $130,000 WAMLS
- 2022-01-04 Sold (Public Records) $130,000 Public Records
- 2021-12-06 Sold (Public Records) $291,000 Public Records
- 2021-09-28 Sold (MLS) $31,000 WAMLS
- 2021-07-23 Listed $45,000 WAMLS
- 2020-07-14 Sold (Public Records) $19,000 Public Records
Property tax history
+4.1%/yrLatest (2025): $744 · +7.0% YoY. Source: county tax records.
Cash-flow waterfall
monthlySold comps — $/sqft
last 12 mo · ≤1 miLoading sold comps…