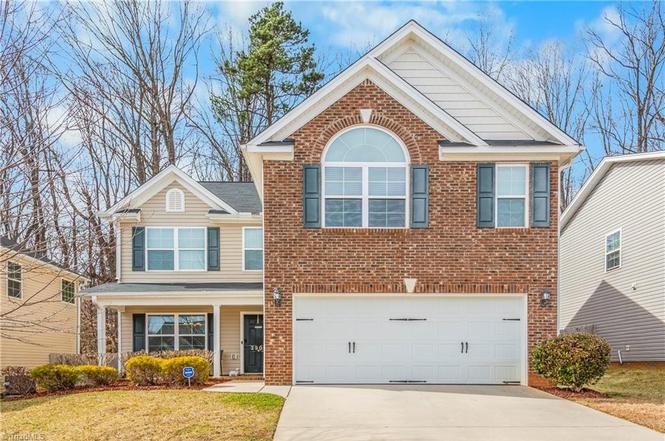
2900 Glenn Abbey Ln · Greensboro, NC
Flood risk 1/10 · Minimal
- FEMA flood zone
- X (unshaded)
- Chance of flooding over 30 yrs
- 0.0%
- Est. flood insurance / yr
- $507 – $1,088
Fire risk 3/10 · Minor
- Est. fire insurance / yr
- $906 – $1,684
Heat risk 6/10 · Moderate
- Hot days now (above 103°F)
- 7 days/yr
- Hot days in 30 yrs
- 18 days/yr
Wind risk 4/10 · Minor
- Chance of severe wind over 30 yrs
- 14.0%
Air-quality risk 2/10 · Minimal
- Unhealthy air days now
- 1 days/yr
- Unhealthy air days in 30 yrs
- 2 days/yr
Risk factors via First Street. Map © Google.
Why this score? — see what drove the D grade
The composite is a weighted blend of 9 inputs, each scored 0–100. Each bar is that input's sub-score; the figure is the points it added to the 100-point composite (weight × sub-score).
- Cash flow +11.8/30.0
- ARV discount +10.1/15.0
- Livability +4.0/5.0
- Schools +3.6/10.0
- DSCR +3.5/10.0
- 1% rule +3.0/10.0
- Rent growth +2.5/5.0
- Condition / age +2.5/5.0
- Appreciation +0.0/10.0
$315,000
🖨 Deal sheet 📄 Offer letter ✓ Due diligence
Listing remarks
MOTIVATED SELLER and a PRICE DROP!!! What a GREAT combination. Bring us an offer. WELCOME HOME to the place you have been dreaming of. This beautiful 4-bedroom, 2.5 bath home offers an inviting open floor plan designed for both everyday living and entertaining. The spacious kitchen is ready for all your culinary creations and flows seamlessly into the dining area and large family room featuring a cozy fireplace. The perfect place to relax after a long day. The main level also features a formal dining room with, ideal for hosting gatherings and special occasions. Upstairs you will find a large primary suite complete with a en suite bath offering dual vanities, a separate shower, and a relaxi
Key facts
- 4,791 sq ft lot
- 2 garage spots
- Built 2019
Neighborhood map
What this means for you Summary
Snapshot
- This is a 4-bed/2.5-bath single-family listed at $315k.
Deal economics
- At list price, monthly cash flow is $-84 ($-1k/yr) — negative.
- To cash-flow at today's rent, offer at most $300k (4.7% below list).
- To meet the 1% rule (rent ≥ 1% of price), the offer needs to be $253k (19.8% below list).
- Recommended offer: $253k (19.8% below list) — sets the bar for 1% rule.
- Cap rate 6.0% vs local median 3.8% in Greensboro — top-decile yield for the area; either an underpriced asset or a hidden risk that comps aren't pricing in. Stress-test before assuming the spread holds.
Location & tenants
- Location reads 81/100 on livability (#12 in NC, #1,335 nationally) — a professional / high-income tenant draw. Strengths: amenities A+, commute A+, cost of living A+; Watch: employment D, crime F.
- Guilford County Schools (urban): math 39% / reading 45% proficiency, ranked #99 of 178 in NC (top 56%) — families likely to look elsewhere, expect single-tenant / working-renter base with shorter leases.
- Market conditions: 99 active listings in the ZIP; 4 comparable units currently listed for rent nearby; rentals at typical pace (median 23d on market — plan ~3-4 weeks tenant-placement turnaround); solid renter incomes; 3,843 units permitted in Guilford County in 2024 (2,397 in 5+ unit buildings).
- This rent runs 37% of the median local income ($83k/yr) — at the standard rent-burdened threshold; future hikes will face affordability resistance.
Forward outlook
- Local home prices are declining (-3.0%/yr); year-one equity from $2k of loan paydown is wiped out by about $9k of value loss. Plan a longer hold.
- Guilford County population projected at +26% by 2050 — long-run rental-demand tailwind backs the buy-and-hold thesis.
Negotiation context
- It's been on market 64 days — a 6% lower offer ($296k) is reasonable based on typical stale-listing flexibility.
Risks & watch-outs
- Climate carrying-cost: extreme-heat days projected 7→18/yr by 2055 (HVAC capex compounding) — expect insurance premiums to compound above CPI over the hold.
Questions for the listing agent
- What do current leases actually rent for vs. the listed asking? Can we see a recent rent roll and the last 12 months of T-12 income?
- It's been on market 64 days. Have you received any prior offers? Is the seller open to a 20% concession, seller financing, or rate buy-down credit?
- What does the HOA fee cover, when was the last increase, and are there any pending special assessments or reserve-fund shortfalls?
- Why hasn't it sold? Are there any deal-killer items the seller is aware of (foundation, flood, title, zoning, code violations)?
- Is there a deadline driving the sale (1031 exchange, divorce, estate, relocation)? That informs how much negotiation room exists.
- Crime grade is F in this area — have there been break-ins, vandalism, or insurance claims at this property in the last 3 years? What carrier currently insures it and at what premium?
- The area grade is low — what's the realistic commute time and amenity access for the typical tenant pool here? Any planned neighborhood developments (good or bad) we should know about?
- What's the average days-on-market for RENTAL listings here right now (not sales)? A rising rental-DOM trend means longer vacancies and softer asking-rent achievability than the comps imply.
- What's the recent tenant-quality profile in this submarket — average credit score on applications, eviction rate, late-payment / NSF rate, and stable-employment percentage? A property-management company in the area should have these aggregated.
- How much new for-sale + rental construction is in the pipeline within 1–3 miles? Heavy new supply typically softens prices + rents 12–24 months out; constrained supply supports both.
Investment metrics
- 1% rule
- 0.80% ✗
- Cap rate
- 5.97%
- Cash-on-cash
- -1.14%
- DSCR
- 0.95
- GRM
- 10.4
CMA / ARV
- ARV (on-the-fly)
- $334,616
- Comps found
- 7
Show comp detail 7 sales within ~0.75 mi
| Address | Dist | Beds/Ba | Sqft | Sold | Price | $/sf | Match |
|---|---|---|---|---|---|---|---|
| 3012 Glenn Abbey Ln | 0.10mi | 4/2.5 | 2,225 (+0%) | 19mo | $319,900 | $144 | 79 |
| 2711 Glenn Abbey Ln | 0.11mi | 4/2.5 | 1,941 (-12%) | 8mo | $293,000 | $151 | 67 |
| 3607 Torrey Ln | 0.06mi | 3/2.5 (-1) | 1,895 (-14%) | 4mo | $284,000 | $150 | 64 |
| 5211 Skylark Dr | 0.47mi | 4/3.0 | 2,293 (+4%) | 12mo | $460,000 | $201 | 60 |
| 5522 Birch Ridge Rd | 0.24mi | 3/2.5 (-1) | 2,388 (+8%) | 20mo | $365,000 | $153 | 54 |
| 3587 Sydney Oaks Dr | 0.34mi | 3/2.5 (-1) | 2,000 (-10%) | 13mo | $299,500 | $150 | 52 |
| 4 Arbor Spring Ct | 0.33mi | 3/2.5 (-1) | 1,944 (-12%) | 9mo | $304,000 | $156 | 52 |
Match score weights: distance 35% · size 25% · config 20% · recency 20%. Top-matched comps best support the ARV.
Projected returns pro-forma
-3.0% appreciation · 3.0% rent growth · sell at horizon
- IRR
- -18.2%
- Equity multiple
- 0.36×
- Total profit
- $-56,396
- Equity at exit
- $46,968
- IRR
- -10.5%
- Equity multiple
- 0.36×
- Total profit
- $-56,060
- Equity at exit
- $27,235
Cash invested: $88,200 (down + closing). Projections, not guarantees.
Landlord ↔ Tenant lean methodology
- Overall (STATE)
- 85 Strongly Landlord-Friendly
- State North Carolina
- 85 Strongly Landlord-Friendly · R+3
- County
- — inherits STATE
- City
- — inherits STATE
ZIP-level market 27214
- Home prices YoY
- -20.2%
- Active inventory
- 99
- Price-to-rent
- 10.4×
Monthly cashflow live
- Estimated rent
- $2,527 medium interval (Pro) →
- Mortgage (P&I)
- −$1,652
- Tax from tax record
- −$228 /mo · $2,733/yr
- Insurance
- −$131
- HOA
- −$69
- Vacancy / Maint / Mgmt
- −$531
- Net cashflow
- $-84
Break-even live
UW: 25.0% down · 7.5% · 30yr · 1.5% tax · 5.0% vac · 8.0% maint · 8.0% mgmt
Financing live
Cash to close
- Down payment
- $78,750
- Closing costs
- $9,450
- Reserves months
- —
- Total cash needed
- —
Loan-product check · same deal, 3 products live
Conventional
25% down · 7.5% · 30yr
- Down + closing
- —
- Monthly P&I
- —
- Monthly cashflow
- —
- DSCR
- —
- Eligible?
- —
Personal DTI + credit; lowest rate.
DSCR
20% down · 8.5% · 30yr
- Down + closing
- —
- Monthly P&I
- —
- Monthly cashflow
- —
- DSCR
- —
- Eligible?
- —
No personal income docs; deal must DSCR.
Hard money
10% down · 12.0% · 12mo
- Down + closing
- —
- Monthly P&I
- —
- Monthly cashflow
- —
- DSCR
- —
- Eligible?
- —
Short-term bridge; refi at stabilization.
Rent comps 4 comps
| Address | Beds | Baths | Sqft | Rent | $/sqft | DOM | Units | Dist |
|---|---|---|---|---|---|---|---|---|
| 2216 Ram Rd Greensboro, NC | 4.0 | 2.5 | 2201 | $2,315 | $1.05 | 23d | 1 | 1.03mi |
| 4127 Landerwood Dr Greensboro, NC | 4.0 | 3.0 | 1676 | $1,995 | $1.19 | 23d | 1 | 1.04mi |
| 4103 Laurel Creek Dr Greensboro, NC | 4.0 | 2.5 | 1964 | $2,159 | $1.10 | 14d | 1 | 1.06mi |
| 2015 Ram Rd Greensboro, NC | 5.0 | 3.0 | 2420 | $2,195 | $0.91 | 18d | 1 | 1.33mi |
HOA detail
- Monthly dues
- $69 · $828/yr
Listing history 6 events
-
2026-04-24status Pending
-
2026-04-16price $315,000
-
2026-03-30price $320,000
-
2026-03-17price $330,750
-
2026-02-20$337,750 Active
-
2026-02-19historical $337,750
ⓘ Source: listings_history table (triggers on properties + properties_extension) + one-shot
backfill from property_details.listing_events for pre-trigger history.
Tax reassessment forecast NC · Resets to sale price
- Current annual tax
- $2,733 · $228/mo
- Projected year-2 tax
- $2,733 · $228/mo
- Expected delta
- $0/yr ($0/mo · 0.0%)
ⓘ Screening estimate from a state-policy table — verify with the county assessor before closing.
Climate risk First Street
- Flood 1/10 Low FEMA zone X (unshaded) · 0% chance over 30 yrs
- Wildfire 3/10 Moderate
- Heat 6/10 Major 7 d/yr ≥103°F today · 18 d/yr by 30 yrs out
- Wind 4/10 Moderate 14% chance of damaging wind over 30 yrs
- Air quality 2/10 Low 1 unhealthy d/yr today · 2 by 30 yrs out
Nearby sold comps map
Loading sold comps map…
Walkable amenities ~0.75 mi
Loading nearby amenities…
Taxation est. · year 1
- Rental income
- $30,323
- − Mortgage interest
- −$17,645
- − Property taxes
- −$2,733
- − Insurance
- −$1,575
- − Repairs & maintenance
- −$2,426
- − Management
- −$2,426
- − HOA
- −$828
- − Depreciation
- −$9,164
- Taxable loss
- −$6,474
- Est. tax savings @ 24.0%
- +$1,554
- After-tax cash flow
- $549/yr
For passive investors: Depreciation is non-cash, so a rental often shows a tax loss while cash-flowing — sheltering income. Rental losses are passive: they offset passive income freely, and up to $25,000/yr can offset ordinary (W-2) income if you actively participate and your MAGI is under $100k (phasing out to $0 by $150k); unused losses carry forward. On sale, claimed depreciation is recaptured at up to 25%, and gains may owe capital-gains tax (a 1031 exchange can defer both). Figures are a year-1 estimate at your 24.0% rate — not tax advice; consult a CPA.
Schools (NCES district)
- District
- Guilford County Schools
- NCES district ID
- 3701920
- Math proficiency
- 39% ▲ 1.00%
- Reading proficiency
- 45% ▲ 1.00%
- Median HH income
- $46,315
- Composite
- 35.78/100
- National rank
- #4842
- State rank
- #99 of 178 in NC
Livability — Greensboro
- Score
- 81/100
- State rank
- #12
- US rank
- #1335
Category grades
Schools grade is shown separately in the Schools card above.
Census & demographics
- Census place
- Greensboro, NC
- County
- Guilford County · 487,190 people
- City population
- 329,421
- Metro
- Greensboro-High Point, NC
- Population (ZIP)
- 14,766
- Household income
- $82,655
- Rent vs Own
- Severe rent burden
- 32.0
Population outlook (Guilford County) Hauer SSP2
- Today (2025)
- 584,596 people
- By 2030
- 616,851 · +5.5%
- By 2040
- 678,451 · +16.1%
- By 2050
- 734,788 · +25.7%
- By 2075
- 862,985 · +47.6%
- By 2100
- 948,704 · +62.3%
Race, ethnicity, and origin ACS 2023
- Neighborhood character
- Diverse neighborhood (Simpson 0.56)
- Race & ethnicity
- White 56% Black 35% Two or more races 6% Hispanic / Latino 6%
- Hispanic origin (detail)
- Mexican 5%
- Common ancestry
- Italian 1% Hispanic 1% Serbian 1%
- Foreign-born
- 9% · Canada
- Languages at home
- 92% English-only · Spanish 7%
Political lean MEDSL · Guilford
- 2024 margin
- Strong D (+21.8) · D 60.2% · R 38.4% · Other 1.4%
- 2008→2024 swing
- +3.5pp toward D · 2008: 18.4pp · 2024: 21.8pp
- All cycles
- 2024: D+21.8 2020: D+23.1 2016: D+20.0 2012: D+16.5 2008: D+18.4
Not yet ingested
- Civics
- —
Market trends
- HPI YoY
- ▼ -63.20%
- Current HPI
- 249.9252
- Rent YoY
- —
- Metro
- Greensboro-High Point, NC
- State GDP YoY
- ▲ 3.28%
- F500 in state
- 26
Industry mix (Fortune 500 HQ in NC)
| Industry | F500 HQs | Revenue |
|---|---|---|
| Financial Services | 2 | $213B |
|
||
| Retail | 2 | $95B |
|
||
| Industrial Conglomerate | 1 | $38B |
|
||
| Metals / Steel | 1 | $35B |
|
||
| Utilities | 1 | $30B |
|
||
| Industrial Machinery | 1 | $19B |
|
||
Price history
-6.7% since first listed6 events — show timeline
- 2026-04-24 Pending — Triad MLS
- 2026-04-16 Price Changed $315,000 Triad MLS
- 2026-03-30 Price Changed $320,000 Triad MLS
- 2026-03-17 Price Changed $330,750 Triad MLS
- 2026-02-20 Listed $337,750 Triad MLS
- 2026-02-19 Coming Soon $337,750 Triad MLS
Property tax history
+152.9%/yrLatest (2025): $2,733 · -1.0% YoY. Source: county tax records.
Cash-flow waterfall
monthlySold comps — $/sqft
last 12 mo · ≤1 miLoading sold comps…