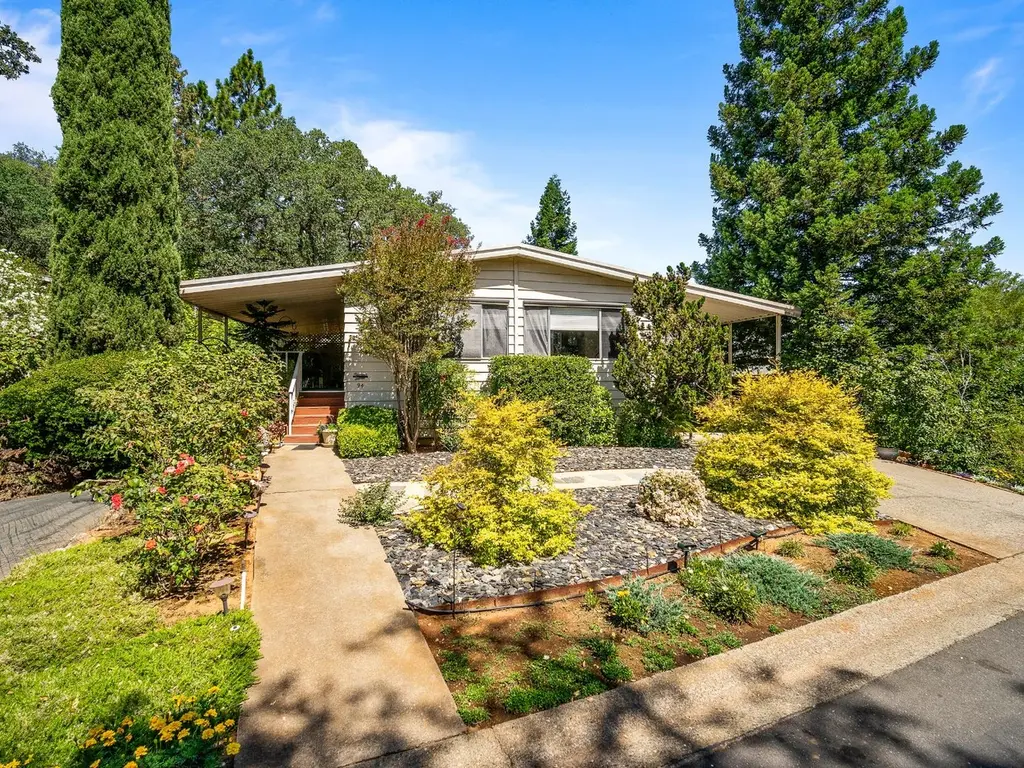
4700 Old French Town Rd #94 · Diamond Springs, CA
Flood risk 1/10 · Minimal
- FEMA flood zone
- X (unshaded)
- Chance of flooding over 30 yrs
- 0.0%
- Est. flood insurance / yr
- $507 – $1,088
Fire risk 10/10 · Severe
- Est. fire insurance / yr
- $659 – $1,223
Heat risk 6/10 · Moderate
- Hot days now (above 100°F)
- 6 days/yr
- Hot days in 30 yrs
- 14 days/yr
Wind risk 1/10 · Minimal
- Chance of severe wind over 30 yrs
- —
Air-quality risk 10/10 · Severe
- Unhealthy air days now
- 26 days/yr
- Unhealthy air days in 30 yrs
- 30 days/yr
Risk factors via First Street. Map © Google.
Why this score? — see what drove the B- grade
The composite is a weighted blend of 9 inputs, each scored 0–100. Each bar is that input's sub-score; the figure is the points it added to the 100-point composite (weight × sub-score).
- Cash flow +28.0/30.0
- ARV discount +10.9/15.0
- DSCR +10.0/10.0
- 1% rule +7.7/10.0
- Schools +5.1/10.0
- Rent growth +3.2/5.0
- Condition / age +2.5/5.0
- Livability +2.4/5.0
- Appreciation +0.0/10.0
$179,500
🖨 Deal sheet 📄 Offer letter ✓ Due diligence
Listing remarks
Charming Mobile Home in Greenstone Estates, 55+ Community with Spacious floorplan and covered Deck Welcome to this beautifully maintained 2-bedroom, 2-bath mobile home located in a peaceful senior community. This home offers a spacious and open floorplan, perfect for relaxing or entertaining guests. The heart of the home is the inviting living room, which opens directly onto a gorgeous covered deck, ideal for morning coffee or enjoying cool evening breezes. Pride of ownership is evident throughout the property, especially in the lushly landscaped yard, which adds both curb appeal and tranquility to the outdoor space. Additional features include: Bright kitchen with ample cabinetry and cou
Key facts
- Covered deck
- Bright kitchen
- Central heat and air
Tags
Property features AI
Finance
- Other: Located in a land-lease park
- Financial info: Land lease amount applies
- HOA & community: Not part of an association; Located in a senior community; Land lease community (land lease fee applies)
Exterior
- Parking: Guest parking available
- Utilities: Public water; Public sewer; Cable available; Individual electric meter; 220V in kitchen; 220V in laundry
- Home design: Manufactured in-park double wide; Sherwood make; Built in 1978
- Construction: Metal skirting; Composition roof; Double wide manufactured home
- Exterior features: Carport awning; Backyard and front yard; Shed(s); Other yard features
Interior
- Kitchen: Built-in electric oven; Built-in electric range; Electric cooktop; Dishwasher; Disposal; Free-standing refrigerator; Laminate counters
- Bedrooms: 2 bedrooms (including a master bedroom)
- Flooring: Carpet; Linoleum; Vinyl
- Bathrooms: 2 full bathrooms; Double sinks; Sunken tub; Tub with shower over; Shower stall(s)
- Heating & cooling: Central heating; Electric heating; Pellet stove; Central air conditioning; Ceiling fans
- Interior features: Built-in electric oven and range; Electric cooktop; Dishwasher; Disposal; Free-standing refrigerator; Pellet stove fireplace (1); Covered deck and porch steps; Great room living area; Laminate countertops; Dining/Living combo
- Laundry & utility: Laundry inside the home; 220V in laundry
Neighborhood map
What this means for you Summary
Snapshot
- This is a 2-bed/2.0-bath manufactured listed at $180k.
Deal economics
- At list price, monthly cash flow is $560 ($7k/yr) — positive.
- The deal already cash-flows at list — no discount required.
- Meets the 1% rule at list price ($2k rent vs $180k).
- Recommended offer: $169k (6.0% below list) — sets the bar for market timing.
- Cap rate 10.0% vs local median 2.3% in Diamond Springs — top-decile yield for the area; either an underpriced asset or a hidden risk that comps aren't pricing in. Stress-test before assuming the spread holds.
Location & tenants
- Location reads 47/100 on livability (#1,239 in CA) — a working-class tenant base; expect higher turnover. Strengths: housing B+; Watch: schools D, crime D-, amenities F.
- El Dorado Union High (suburban): math 44% / reading 69% proficiency, ranked #89 of 517 in CA (top 17%) — acceptable for families but not a draw, mixed tenant base, ~2y average lease.
- Market conditions: Rents rising (+2.9%/yr); 236 active listings in the ZIP; high-income renter base; 437 units permitted in El Dorado County in 2024 (0 in 5+ unit buildings).
Forward outlook
- Local home prices are declining (-3.0%/yr); year-one equity from $1k of loan paydown is wiped out by about $5k of value loss. Plan a longer hold.
- El Dorado County population projected to shrink 3% by 2050 — rents likely to lag national; underwrite the cash flow, not the appreciation.
- At projected returns (-3.0% appreciation + 2.9% rent growth), your $50k cash investment doubles in ~9 years — after that, you're playing with house money.
Negotiation context
- It's been on market 84 days — a 6% lower offer ($169k) is reasonable based on typical stale-listing flexibility.
Risks & watch-outs
- Climate carrying-cost: severe wildfire risk; extreme-heat days projected 6→14/yr by 2055 (HVAC capex compounding) — expect insurance premiums to compound above CPI over the hold.
Questions for the listing agent
- It's been on market 84 days. Have you received any prior offers? Is the seller open to a 6% concession, seller financing, or rate buy-down credit?
- Built in 1978 — when were the roof, HVAC, electrical panel, plumbing, and water heater last replaced?
- Why hasn't it sold? Are there any deal-killer items the seller is aware of (foundation, flood, title, zoning, code violations)?
- Is there a deadline driving the sale (1031 exchange, divorce, estate, relocation)? That informs how much negotiation room exists.
- Schools are D-rated, which usually means shorter tenancies and higher turnover. Who's the typical renter profile here, and what's been the actual vacancy rate?
- Crime grade is D in this area — have there been break-ins, vandalism, or insurance claims at this property in the last 3 years? What carrier currently insures it and at what premium?
- What's the average days-on-market for RENTAL listings here right now (not sales)? A rising rental-DOM trend means longer vacancies and softer asking-rent achievability than the comps imply.
- What's the recent tenant-quality profile in this submarket — average credit score on applications, eviction rate, late-payment / NSF rate, and stable-employment percentage? A property-management company in the area should have these aggregated.
- How much new for-sale + rental construction is in the pipeline within 1–3 miles? Heavy new supply typically softens prices + rents 12–24 months out; constrained supply supports both.
Investment metrics
- 1% rule
- 1.27% ✓
- Cap rate
- 10.04%
- Cash-on-cash
- 13.37%
- DSCR
- 1.60
- GRM
- 6.6
CMA / ARV
- ARV (on-the-fly)
- $194,400
- Comps found
- 10
Show comp detail 10 sales within ~0.75 mi
| Address | Dist | Beds/Ba | Sqft | Sold | Price | $/sf | Match |
|---|---|---|---|---|---|---|---|
| 4700 Old French Town #71 | 0.04mi | 2/2.0 | 1,440 (0%) | 13mo | $195,000 | $135 | 87 |
| 4700 Old French Town Rd #74 | 0.07mi | 2/2.0 | 1,440 (0%) | 15mo | $185,000 | $128 | 84 |
| 4700 Old Frenchtown Rd #61 | 0.08mi | 2/2.0 | 1,440 (0%) | 22mo | $158,000 | $110 | 78 |
| 4700 Old French Town Rd #25 | 0.18mi | 3/2.0 (+1) | 1,450 (+1%) | 17mo | $250,000 | $172 | 71 |
| 4700 Old French Town Rd #2 | 0.12mi | 2/2.0 | 1,536 (+7%) | 24mo | $109,000 | $71 | 64 |
| 4700 Old French Town Rd #12 | 0.17mi | 3/2.0 (+1) | 1,332 (-8%) | 15mo | $179,800 | $135 | 62 |
| 4700 Old French Town Rd #29 | 0.21mi | 3/2.0 (+1) | 1,512 (+5%) | 18mo | $285,000 | $188 | 62 |
| 4700 Old French Town Rd #102 | 0.05mi | 2/2.0 | 1,608 (+12%) | 21mo | $143,000 | $89 | 61 |
| 4700 Old French Town Rd #5 | 0.14mi | 3/2.0 (+1) | 1,615 (+12%) | 9mo | $280,000 | $173 | 61 |
| 4919 Mother Lode Dr | 0.59mi | 2/2.0 | 1,512 (+5%) | 8mo | $479,000 | $317 | 58 |
Match score weights: distance 35% · size 25% · config 20% · recency 20%. Top-matched comps best support the ARV.
Projected returns pro-forma
-3.0% appreciation · 2.86% rent growth · sell at horizon
- IRR
- 3.3%
- Equity multiple
- 1.13×
- Total profit
- $6,304
- Equity at exit
- $26,764
- IRR
- 12.7%
- Equity multiple
- 2.00×
- Total profit
- $50,257
- Equity at exit
- $15,520
Cash invested: $50,260 (down + closing). Projections, not guarantees.
Landlord ↔ Tenant lean methodology
- Overall (STATE)
- 18 Strongly Tenant-Friendly
- State California
- 18 Strongly Tenant-Friendly · D+13
- County
- — inherits STATE
- City
- — inherits STATE
ZIP-level market 95682
- Rents YoY
- 2.9%
- Active inventory
- 236
- Price-to-rent
- 6.6×
Monthly cashflow live
- Estimated rent
- $2,279 medium interval (Pro) →
- Mortgage (P&I)
- −$941
- Tax est. 1.5%
- −$224 /mo · $2,692/yr
- Insurance
- −$75
- HOA
- −$0
- Vacancy / Maint / Mgmt
- −$479
- Net cashflow
- $560
Break-even live
UW: 25.0% down · 7.5% · 30yr · 1.5% tax · 5.0% vac · 8.0% maint · 8.0% mgmt
Financing live
Cash to close
- Down payment
- $44,875
- Closing costs
- $5,385
- Reserves months
- —
- Total cash needed
- —
Loan-product check · same deal, 3 products live
Conventional
25% down · 7.5% · 30yr
- Down + closing
- —
- Monthly P&I
- —
- Monthly cashflow
- —
- DSCR
- —
- Eligible?
- —
Personal DTI + credit; lowest rate.
DSCR
20% down · 8.5% · 30yr
- Down + closing
- —
- Monthly P&I
- —
- Monthly cashflow
- —
- DSCR
- —
- Eligible?
- —
No personal income docs; deal must DSCR.
Hard money
10% down · 12.0% · 12mo
- Down + closing
- —
- Monthly P&I
- —
- Monthly cashflow
- —
- DSCR
- —
- Eligible?
- —
Short-term bridge; refi at stabilization.
Listing history 12 events
-
2026-06-18days on market $179,500 Active 84 DOM
-
2026-06-17days on market $179,500 Active 83 DOM
-
2026-06-16days on market $179,500 Active 82 DOM
-
2026-06-15days on market $179,500 Active 81 DOM
-
2026-06-13days on market $179,500 Active 79 DOM
-
2026-06-09days on market $179,500 Active 75 DOM
-
2026-06-08days on market $179,500 Active 74 DOM
-
2026-06-07days on market $179,500 Active 73 DOM
-
2026-06-03days on market $179,500 Active 69 DOM
-
2026-06-02days on market $179,500 Active 68 DOM
-
2026-06-01days on market $179,500 Active 67 DOM
-
2026-05-31days on market $179,500 Active 66 DOM
ⓘ Source: listings_history table (triggers on properties + properties_extension) + one-shot
backfill from property_details.listing_events for pre-trigger history.
Climate risk First Street
- Flood 1/10 Low FEMA zone X (unshaded) · 0% chance over 30 yrs
- Wildfire 10/10 Extreme
- Heat 6/10 Major 6 d/yr ≥100°F today · 14 d/yr by 30 yrs out
- Wind 1/10 Low
- Air quality 10/10 Extreme 26 unhealthy d/yr today · 30 by 30 yrs out
Nearby sold comps map
Loading sold comps map…
Walkable amenities ~0.75 mi
Loading nearby amenities…
Taxation est. · year 1
- Rental income
- $27,352
- − Mortgage interest
- −$10,055
- − Property taxes
- −$2,692
- − Insurance
- −$898
- − Repairs & maintenance
- −$2,188
- − Management
- −$2,188
- − Depreciation
- −$5,222
- Taxable income
- $4,109
- Est. tax owed @ 24.0%
- −$986
- After-tax cash flow
- $5,736/yr
For passive investors: Depreciation is non-cash, so a rental often shows a tax loss while cash-flowing — sheltering income. Rental losses are passive: they offset passive income freely, and up to $25,000/yr can offset ordinary (W-2) income if you actively participate and your MAGI is under $100k (phasing out to $0 by $150k); unused losses carry forward. On sale, claimed depreciation is recaptured at up to 25%, and gains may owe capital-gains tax (a 1031 exchange can defer both). Figures are a year-1 estimate at your 24.0% rate — not tax advice; consult a CPA.
Schools (NCES district)
- District
- El Dorado Union High
- NCES district ID
- 0612070
- Math proficiency
- 44% ▼ -11.00%
- Reading proficiency
- 69% ▬ 0.00%
- Median HH income
- $78,936
- Composite
- 50.84/100
- National rank
- #1798
- State rank
- #89 of 517 in CA
Livability — Diamond Springs
- Score
- 47/100
- State rank
- #1239
- US rank
- #26264
Category grades
Schools grade is shown separately in the Schools card above.
Census & demographics
- County
- El Dorado County · 144,198 people
- City population
- 6,362
- Metro
- Sacramento-Roseville-Folsom, CA
- Population (ZIP)
- 30,065
- Household income
- $122,436
- Rent vs Own
- Severe rent burden
- 634.0
Population outlook (El Dorado County) Hauer SSP2
- Today (2025)
- 191,666 people
- By 2030
- 193,662 · +1.0%
- By 2040
- 192,583 · +0.5%
- By 2050
- 185,904 · -3.0%
- By 2075
- 169,543 · -11.5%
- By 2100
- 139,623 · -27.2%
Race, ethnicity, and origin ACS 2023
- Neighborhood character
- Predominantly White (80%)
- Race & ethnicity
- White 80% Hispanic / Latino 13% Two or more races 8% Asian 2%
- Hispanic origin (detail)
- Mexican 9%
- Common ancestry
- Lithuanian 3% Portuguese 3% Italian 3%
- Foreign-born
- 5% · Canada, China
- Languages at home
- 93% English-only · Spanish 3% German/W. Germanic 1% Chinese 1%
Political lean MEDSL · El Dorado
- 2024 margin
- R (+12.0) · D 42.6% · R 54.6% · Other 2.8%
- 2008→2024 swing
- -1.5pp toward R · 2008: -10.5pp · 2024: -12.0pp
- All cycles
- 2024: R+12.0 2020: R+8.8 2016: R+13.9 2012: R+18.2 2008: R+10.5
Not yet ingested
- Civics
- —
Market trends
- HPI YoY
- ▼ -417.68%
- Current HPI
- 279.3817
- Rent YoY
- ▲ 2.86%
- Metro
- Sacramento-Roseville-Folsom, CA
- State GDP YoY
- ▲ 3.21%
- F500 in state
- 116
Industry mix (Fortune 500 HQ in CA)
| Industry | F500 HQs | Revenue |
|---|---|---|
| Technology | 27 | $1,492B |
|
||
| Financial Services | 3 | $174B |
|
||
| Retail | 3 | $44B |
|
||
| Insurance | 3 | $26B |
|
||
| Media / Entertainment | 2 | $115B |
|
||
| Pharmaceuticals / Biotech | 2 | $62B |
|
||
Cash-flow waterfall
monthlySold comps — $/sqft
last 12 mo · ≤1 miLoading sold comps…