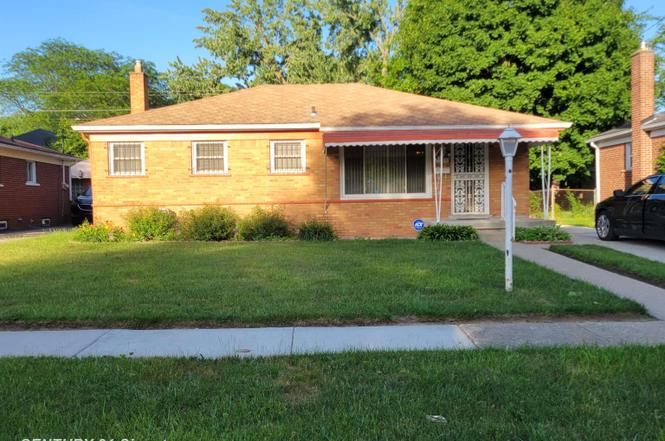
5521 Leslie Dr · Flint, MI
Flood risk 6/10 · Moderate
- FEMA flood zone
- X (unshaded)
- Chance of flooding over 30 yrs
- 0.7%
- Est. flood insurance / yr
- $473 – $860
Fire risk 1/10 · Minimal
- Est. fire insurance / yr
- $784 – $1,456
Heat risk 2/10 · Minimal
- Hot days now (above 96°F)
- 7 days/yr
- Hot days in 30 yrs
- 15 days/yr
Wind risk 2/10 · Minimal
- Chance of severe wind over 30 yrs
- —
Air-quality risk 2/10 · Minimal
- Unhealthy air days now
- 1 days/yr
- Unhealthy air days in 30 yrs
- 3 days/yr
Risk factors via First Street. Map © Google.
Why this score? — see what drove the C grade
The composite is a weighted blend of 9 inputs, each scored 0–100. Each bar is that input's sub-score; the figure is the points it added to the 100-point composite (weight × sub-score).
- Cash flow +26.6/30.0
- DSCR +9.1/10.0
- 1% rule +7.1/10.0
- ARV discount +4.4/15.0
- Condition / age +3.8/5.0
- Livability +3.7/5.0
- Rent growth +2.5/5.0
- Schools +1.1/10.0
- Appreciation +0.0/10.0
$81,500
🖨 Deal sheet 📄 Offer letter ✓ Due diligence
Listing remarks MLS
One of the home's standout features is the bright and inviting enclosed sunroom located just off the back of the house. Surrounded by windows, this space allows you to relax and enjoy the natural sunlight, morning coffee or evening conversations all with the view of the back yard in comfort throughout much of the year
Key facts
- Enclosed sunroom
- View of back yard
- Natural sunlight
Tags
Property features AI
Finance
- Other: Above-grade finished area and below-grade finished area listed as 954 (units omitted as instructed)
- Financial info: Property tax information not included per instructions
- HOA & community: Homeowners association present
Exterior
- Parking: Parking details not provided
- Security: No security features listed
- Utilities: Public water; Public sewer / sewer available
- Home design: Single-family residence; One story
- Construction: Brick construction
- Exterior features: Paved road access; Lot approximately 0.52 acres; Subdivision: BEL-AIRE WOODS 1; Cross streets near Homes / Fleming/Marlowe Dr
Interior
- Kitchen: Oven; Range; Refrigerator
- Bedrooms: Total of 7 rooms (bedroom count not specified)
- Flooring: Hardwood floors
- Bathrooms: 1 full bathroom; 1 half bathroom
- Heating & cooling: Central air; Ceiling fans; Forced air heating; Hot water heating; Natural gas heating
- Interior features: Eat-in kitchen; Finished full basement with concrete floor
- Laundry & utility: Gas water heater
Neighborhood map
What this means for you Summary
Snapshot
- This is a 3-bed/1.5-bath single-family listed at $82k. Condition is rated good.
Deal economics
- At list price, monthly cash flow is $217 ($3k/yr) — positive.
- The deal already cash-flows at list — no discount required.
- Meets the 1% rule at list price ($988 rent vs $82k).
Location & tenants
- Location reads 74/100 on livability (#196 in MI, #4,946 nationally) — a middle-class / working-renter tenant base. Strengths: commute A+, cost of living A+, housing A+; Watch: schools F, crime F, employment F.
- Flint School District (urban): math 7% / reading 13% proficiency, ranked #714 of 760 in MI (top 94%) — low school quality limits family demand, transient renter base, plan for 1-2y turnover; 83% free/reduced lunch — lower-income household profile, screen leases tightly.
- Market conditions: 131 active listings in the ZIP; 3 comparable units currently listed for rent nearby; rentals leasing fast (median 14d on market — plan ~1-2 weeks tenant-placement turnaround); 419 units permitted in Genesee County in 2024 (68 in 5+ unit buildings).
Forward outlook
- Local home prices are declining (-3.0%/yr); year-one equity from $563 of loan paydown is wiped out by about $2k of value loss. Plan a longer hold.
- Genesee County population projected at -27% by 2050 — secular population decline; favor cash flow + early exit over multi-decade hold.
- At projected returns (-3.0% appreciation + 3.0% rent growth), your $23k cash investment doubles in ~10 years — after that, you're playing with house money.
Negotiation context
- Only 2 days on market — expect competitive offers; lowballing is unlikely to land.
- 2 sale attempts with the ask held roughly flat each time — persistent listings suggest the price (not the market) is what's stuck; bring a comps-based counter.
Risks & watch-outs
- Watch-outs: built in 1955 — expect roof / HVAC / electrical / plumbing capex.
- Climate carrying-cost: major flood risk — expect insurance premiums to compound above CPI over the hold.
Questions for the listing agent
- Built in 1955 — when were the roof, HVAC, electrical panel, plumbing, and water heater last replaced?
- Is there a deadline driving the sale (1031 exchange, divorce, estate, relocation)? That informs how much negotiation room exists.
- Schools are F-rated, which usually means shorter tenancies and higher turnover. Who's the typical renter profile here, and what's been the actual vacancy rate?
- Crime grade is F in this area — have there been break-ins, vandalism, or insurance claims at this property in the last 3 years? What carrier currently insures it and at what premium?
- What's the average days-on-market for RENTAL listings here right now (not sales)? A rising rental-DOM trend means longer vacancies and softer asking-rent achievability than the comps imply.
- What's the recent tenant-quality profile in this submarket — average credit score on applications, eviction rate, late-payment / NSF rate, and stable-employment percentage? A property-management company in the area should have these aggregated.
- How much new for-sale + rental construction is in the pipeline within 1–3 miles? Heavy new supply typically softens prices + rents 12–24 months out; constrained supply supports both.
Investment metrics
- 1% rule
- 1.21% ✓
- Cap rate
- 9.49%
- Cash-on-cash
- 11.43%
- DSCR
- 1.51
- GRM
- 6.9
CMA / ARV
- ARV (on-the-fly)
- $76,320
- Comps found
- 12
Show comp detail 12 sales within ~0.75 mi
| Address | Dist | Beds/Ba | Sqft | Sold | Price | $/sf | Match |
|---|---|---|---|---|---|---|---|
| 1518 Randy Ct | 0.12mi | 3/1.0 | 2,082 (+9%) | 1mo | $84,000 | $40 | 76 |
| 4539 Trumbull Dr | 0.50mi | 3/1.0 | 1,932 (+1%) | 1mo | $90,000 | $47 | 72 |
| 5816 Susan St | 0.33mi | 3/1.5 | 1,967 (+3%) | 14mo | $29,500 | $15 | 68 |
| 1216 Barbara Dr | 0.42mi | 3/1.0 | 1,804 (-6%) | 3mo | $71,650 | $40 | 67 |
| 1909 Cherrylawn Dr | 0.41mi | 3/1.0 | 1,742 (-9%) | 2mo | $45,000 | $26 | 63 |
| 5709 Dupont St | 0.55mi | 3/1.0 | 1,770 (-7%) | 1mo | $28,000 | $16 | 60 |
| 1315 Chatham Dr | 0.48mi | 4/1.5 (+1) | 1,806 (-5%) | 11mo | $130,500 | $72 | 54 |
| 902 W Ridgeway Ave | 0.46mi | 3/1.0 | 1,738 (-9%) | 14mo | $10,000 | $6 | 50 |
| 6714 Parkbelt Dr | 0.61mi | 3/1.5 | 2,061 (+8%) | 11mo | $65,000 | $32 | 49 |
| 1327 Chatham Dr | 0.46mi | 4/2.0 (+1) | 2,047 (+7%) | 13mo | $94,000 | $46 | 49 |
| 4407 Wisner St | 0.72mi | 3/2.0 | 1,799 (-6%) | 12mo | $28,000 | $16 | 44 |
| 4230 Leerda St | 0.70mi | 4/1.5 (+1) | 1,798 (-6%) | 14mo | $74,000 | $41 | 41 |
Match score weights: distance 35% · size 25% · config 20% · recency 20%. Top-matched comps best support the ARV.
Projected returns pro-forma
-3.0% appreciation · 3.0% rent growth · sell at horizon
- IRR
- 0.7%
- Equity multiple
- 1.03×
- Total profit
- $647
- Equity at exit
- $12,152
- IRR
- 10.4%
- Equity multiple
- 1.81×
- Total profit
- $18,444
- Equity at exit
- $7,047
Cash invested: $22,820 (down + closing). Projections, not guarantees.
Landlord ↔ Tenant lean methodology
- Overall (STATE)
- 62 Landlord-Friendly
- State Michigan
- 62 Landlord-Friendly · EVEN
- County
- — inherits STATE
- City
- — inherits STATE
ZIP-level market 48504
- Active inventory
- 131
- Price-to-rent
- 6.9×
Monthly cashflow live
- Estimated rent
- $988 medium interval (Pro) →
- Mortgage (P&I)
- −$427
- Tax est. 1.5%
- −$102 /mo · $1,222/yr
- Insurance
- −$34
- HOA
- −$0
- Vacancy / Maint / Mgmt
- −$207
- Net cashflow
- $217
Break-even live
UW: 25.0% down · 7.5% · 30yr · 1.5% tax · 5.0% vac · 8.0% maint · 8.0% mgmt
Financing live
Cash to close
- Down payment
- $20,375
- Closing costs
- $2,445
- Reserves months
- —
- Total cash needed
- —
Loan-product check · same deal, 3 products live
Conventional
25% down · 7.5% · 30yr
- Down + closing
- —
- Monthly P&I
- —
- Monthly cashflow
- —
- DSCR
- —
- Eligible?
- —
Personal DTI + credit; lowest rate.
DSCR
20% down · 8.5% · 30yr
- Down + closing
- —
- Monthly P&I
- —
- Monthly cashflow
- —
- DSCR
- —
- Eligible?
- —
No personal income docs; deal must DSCR.
Hard money
10% down · 12.0% · 12mo
- Down + closing
- —
- Monthly P&I
- —
- Monthly cashflow
- —
- DSCR
- —
- Eligible?
- —
Short-term bridge; refi at stabilization.
Rent comps 3 comps
| Address | Beds | Baths | Sqft | Rent | $/sqft | DOM | Units | Dist |
|---|---|---|---|---|---|---|---|---|
| 5813 Edwards Ave Flint, MI | 3.0 | 1.0 | 1500 | $899 | $0.60 | 13d | 1 | 0.50mi |
| 411 W Marengo Ave Flint, MI | 3.0 | 1.0 | 1350 | $1,072 | $0.79 | 13d | 1 | 0.87mi |
| 5280 Cedar Shores Ct Flint, MI | 2.0–3.0 | 2.0 | 1150 | $1,148 | $1.00 | 13d | 6 | 1.37mi |
Listing history 3 events
-
2026-06-18days on market $81,500 Active 2 DOM
-
2026-06-16remarks 319-char remark
-
2026-06-16$81,500 Active 1 DOM
ⓘ Source: listings_history table (triggers on properties + properties_extension) + one-shot
backfill from property_details.listing_events for pre-trigger history.
Climate risk First Street
- Flood 6/10 Major FEMA zone X (unshaded) · 70% chance over 30 yrs
- Wildfire 1/10 Low
- Heat 2/10 Low 7 d/yr ≥96°F today · 15 d/yr by 30 yrs out
- Wind 2/10 Low
- Air quality 2/10 Low 1 unhealthy d/yr today · 3 by 30 yrs out
Nearby sold comps map
Loading sold comps map…
Walkable amenities ~0.75 mi
Loading nearby amenities…
Taxation est. · year 1
- Rental income
- $11,856
- − Mortgage interest
- −$4,565
- − Property taxes
- −$1,222
- − Insurance
- −$408
- − Repairs & maintenance
- −$948
- − Management
- −$948
- − Depreciation
- −$2,371
- Taxable income
- $1,393
- Est. tax owed @ 24.0%
- −$334
- After-tax cash flow
- $2,273/yr
For passive investors: Depreciation is non-cash, so a rental often shows a tax loss while cash-flowing — sheltering income. Rental losses are passive: they offset passive income freely, and up to $25,000/yr can offset ordinary (W-2) income if you actively participate and your MAGI is under $100k (phasing out to $0 by $150k); unused losses carry forward. On sale, claimed depreciation is recaptured at up to 25%, and gains may owe capital-gains tax (a 1031 exchange can defer both). Figures are a year-1 estimate at your 24.0% rate — not tax advice; consult a CPA.
Condition & rehab AI · 10 photos
This single-family home is in good condition with a good condition score of 75. It has a good exterior, interior, and appliances. The home is move-in ready with minor maintenance items to address.
Value-add opportunities
- Both Paint exterior trim — Enhances curb appeal and value
- Both Clean gutters — Improves drainage and prevents water damage
Renovation cost estimate screening
Value-add ROI direction
- Both Paint exterior trim — Enhances curb appeal and value ↑
- Both Clean gutters — Improves drainage and prevents water damage ↑
ⓘ Cost ranges are severity-bucket heuristics (US national rule-of-thumb). Get contractor quotes + a written scope before underwriting a rehab budget.
Schools (NCES district)
- District
- Flint School District
- NCES district ID
- 2614520
- Math proficiency
- 7% ▬ 0.00%
- Reading proficiency
- 13% ▲ 3.00%
- Median HH income
- $25,954
- Composite
- 10.97/100
- National rank
- #14642
- State rank
- #714 of 760 in MI
Livability — Flint
- Score
- 74/100
- State rank
- #196
- US rank
- #4946
Category grades
Schools grade is shown separately in the Schools card above.
Census & demographics
- Census place
- Flint, MI
- City population
- 93,814
- Population (ZIP)
- 23,873
Population outlook (Genesee County) Hauer SSP2
- Today (2025)
- 381,312 people
- By 2030
- 362,731 · -4.9%
- By 2040
- 321,550 · -15.7%
- By 2050
- 279,212 · -26.8%
- By 2075
- 193,336 · -49.3%
- By 2100
- 128,118 · -66.4%
Race, ethnicity, and origin ACS 2023
- Neighborhood character
- Predominantly Black (66%)
- Race & ethnicity
- Black 66% White 24% Two or more races 6% Hispanic / Latino 5% Asian 1%
- Common ancestry
- Romanian 2% Lithuanian 1% Italian 1%
- Foreign-born
- 3% · Canada, China
- Languages at home
- 96% English-only · Spanish 2%
Political lean MEDSL · Genesee
- 2024 margin
- Toss-up / Even · D 51.4% · R 47.2% · Other 1.4%
- 2008→2024 swing
- -28.3pp toward R · 2008: 32.5pp · 2024: 4.2pp
- All cycles
- 2024: D+4.2 2020: D+9.3 2016: D+9.5 2012: D+28.2 2008: D+32.5
Not yet ingested
- Civics
- —
Market trends
- HPI YoY
- ▼ -101.67%
- Current HPI
- 94.3111
- Rent YoY
- —
- Metro
- —
- State GDP YoY
- ▲ 1.37%
- F500 in state
- 28
Industry mix (Fortune 500 HQ in MI)
| Industry | F500 HQs | Revenue |
|---|---|---|
| Automotive Parts | 3 | $48B |
|
||
| Automotive | 2 | $372B |
|
||
| Chemicals | 1 | $45B |
|
||
| Automotive Retail | 1 | $29B |
|
||
| Healthcare / Medical Devices | 1 | $23B |
|
||
| Automotive Technology | 1 | $20B |
|
||
Price history
+0.0% since first listed2 events — show timeline
- 2026-06-16 Listed $81,500 REALCOMP
- 2026-06-15 Listed $81,500 MiRealSource-MiMLS
Cash-flow waterfall
monthlySold comps — $/sqft
last 12 mo · ≤1 miLoading sold comps…