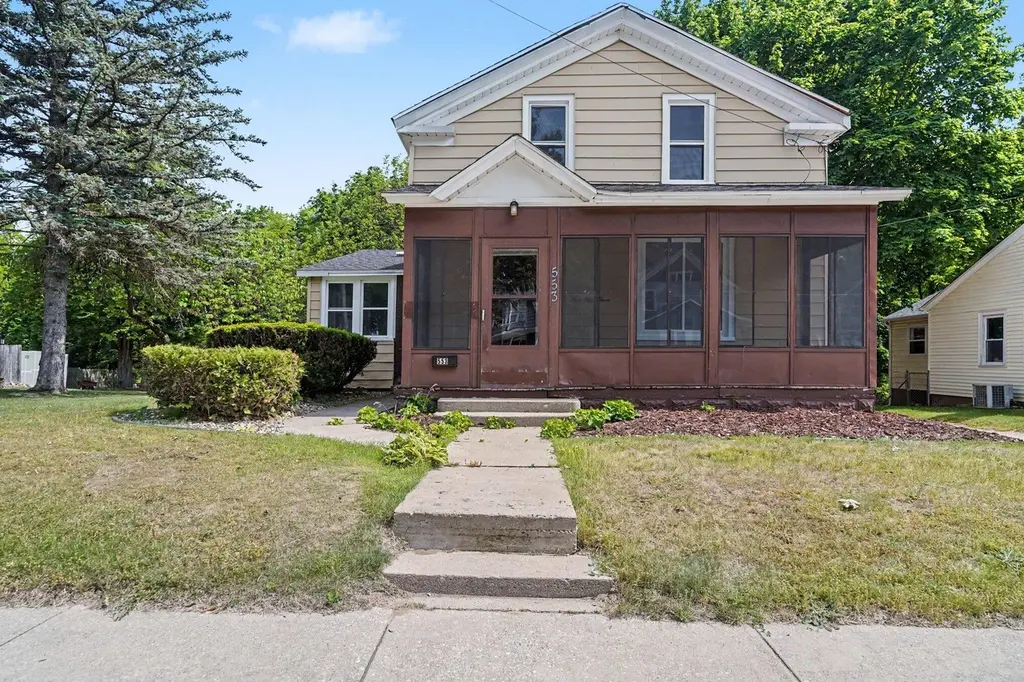
553 Ely St · Allegan, MI
Flood risk 1/10 · Minimal
- FEMA flood zone
- X (unshaded)
- Chance of flooding over 30 yrs
- 0.0%
- Est. flood insurance / yr
- $473 – $860
Fire risk 3/10 · Minor
- Est. fire insurance / yr
- $784 – $1,456
Heat risk 2/10 · Minimal
- Hot days now (above 97°F)
- 7 days/yr
- Hot days in 30 yrs
- 16 days/yr
Wind risk 2/10 · Minimal
- Chance of severe wind over 30 yrs
- —
Air-quality risk 3/10 · Minor
- Unhealthy air days now
- 2 days/yr
- Unhealthy air days in 30 yrs
- 3 days/yr
Risk factors via First Street. Map © Google.
Why this score? — see what drove the C+ grade
The composite is a weighted blend of 9 inputs, each scored 0–100. Each bar is that input's sub-score; the figure is the points it added to the 100-point composite (weight × sub-score).
- Cash flow +24.6/30.0
- ARV discount +12.2/15.0
- DSCR +7.9/10.0
- 1% rule +6.4/10.0
- Livability +3.5/5.0
- Schools +2.7/10.0
- Rent growth +2.5/5.0
- Condition / age +2.5/5.0
- Appreciation +0.0/10.0
$210,000
🖨 Deal sheet 📄 Offer letter ✓ Due diligence
Listing remarks MLS
Charming home at an affordable price! This 3-bedroom, 2-bath home offers a functional layout, an abundance of space, and has had several recent updates. Replacement windows were installed in 2025, and the roof, water heater, and furnace were all replaced in 2019. The main floor features a spacious kitchen with an adjoining dining area, living room, primary bedroom, full bath, convenient main floor laundry, and a versatile bonus room. Upstairs you will find two additional bedrooms, a second full bath, and another flex space. Situated on a large . 58-acre lot near schools and downtown Allegan, this home offers character, comfort, and plenty of opportunity. Schedule a tour today!
Key facts
- Spacious kitchen
- Main floor laundry
- Large lot
Tags
Property features AI
Exterior
- Utilities: Public water; Natural gas available and connected; Electricity available
- Home design: Single family residence; Residential property
- Construction: Built in 1920; Vinyl siding; Composition/Shingle roof; Crawl space and Michigan basement
- Exterior features: Sidewalk; Wooded lot; Shed(s)
Interior
- Kitchen: Range; Refrigerator
- Bathrooms: 2 full bathrooms
- Heating & cooling: Forced air heating
- Interior features: 10 total rooms; Replacement windows
- Laundry & utility: Washer; Dryer
Neighborhood map
What this means for you Summary
Snapshot
- This is a 3-bed/2.0-bath single-family listed at $210k.
Deal economics
- At list price, monthly cash flow is $433 ($5k/yr) — positive.
- The deal already cash-flows at list — no discount required.
- Meets the 1% rule at list price ($2k rent vs $210k).
- Recommended offer: $207k (1.5% below list) — sets the bar for market timing.
- Cap rate 8.8% vs local median 4.6% in Allegan — top-decile yield for the area; either an underpriced asset or a hidden risk that comps aren't pricing in. Stress-test before assuming the spread holds.
Location & tenants
- Location reads 70/100 on livability (#318 in MI) — a middle-class / working-renter tenant base. Strengths: crime A+, cost of living A+, housing A+; Watch: schools D+, employment D+, amenities F.
- Allegan Public Schools (town): math 26% / reading 37% proficiency, ranked #338 of 540 in MI (top 63%) — families likely to look elsewhere, expect single-tenant / working-renter base with shorter leases.
- Market conditions: 183 active listings in the ZIP; 3 comparable units currently listed for rent nearby; rentals at typical pace (median 21d on market — plan ~3-4 weeks tenant-placement turnaround); 419 units permitted in Allegan County in 2024 (0 in 5+ unit buildings).
Forward outlook
- Local home prices are declining (-3.0%/yr); year-one equity from $1k of loan paydown is wiped out by about $6k of value loss. Plan a longer hold.
Negotiation context
- It's been on market 16 days — a 2% lower offer ($207k) is reasonable based on typical stale-listing flexibility.
- 32 sale attempts since 30y ago with the ask held roughly flat each time — persistent listings suggest the price (not the market) is what's stuck; bring a comps-based counter.
- Current owner paid $115k; list at $210k implies a 83% gain — meaningful room to come down on a strong offer.
Risks & watch-outs
- Watch-outs: built in 1920 — expect roof / HVAC / electrical / plumbing capex.
Questions for the listing agent
- Built in 1920 — when were the roof, HVAC, electrical panel, plumbing, and water heater last replaced?
- Is there a deadline driving the sale (1031 exchange, divorce, estate, relocation)? That informs how much negotiation room exists.
- Schools are D-rated, which usually means shorter tenancies and higher turnover. Who's the typical renter profile here, and what's been the actual vacancy rate?
- What's the average days-on-market for RENTAL listings here right now (not sales)? A rising rental-DOM trend means longer vacancies and softer asking-rent achievability than the comps imply.
- What's the recent tenant-quality profile in this submarket — average credit score on applications, eviction rate, late-payment / NSF rate, and stable-employment percentage? A property-management company in the area should have these aggregated.
- How much new for-sale + rental construction is in the pipeline within 1–3 miles? Heavy new supply typically softens prices + rents 12–24 months out; constrained supply supports both.
Investment metrics
- 1% rule
- 1.14% ✓
- Cap rate
- 8.76%
- Cash-on-cash
- 8.83%
- DSCR
- 1.39
- GRM
- 7.3
CMA / ARV
- ARV (on-the-fly)
- $234,360
- Comps found
- 12
Show comp detail 12 sales within ~0.75 mi
| Address | Dist | Beds/Ba | Sqft | Sold | Price | $/sf | Match |
|---|---|---|---|---|---|---|---|
| 143 Ely St | 0.30mi | 2/1.0 (-1) | 1,325 (+2%) | 7mo | $178,000 | $134 | 68 |
| 515 Hubbard St | 0.34mi | 3/2.0 | 1,265 (-3%) | 20mo | $245,000 | $194 | 63 |
| 211 Lincoln St | 0.45mi | 4/2.0 (+1) | 1,320 (+1%) | 11mo | $190,000 | $144 | 62 |
| 208 Robinson St | 0.49mi | 3/1.0 | 1,232 (-5%) | 9mo | $206,500 | $168 | 57 |
| 544 Academy St | 0.13mi | 2/2.0 (-1) | 1,120 (-14%) | 15mo | $241,500 | $216 | 53 |
| 665 Ely St | 0.29mi | 2/1.0 (-1) | 1,140 (-12%) | 9mo | $258,000 | $226 | 50 |
| 416 Cutler St | 0.46mi | 3/1.0 | 1,400 (+8%) | 15mo | $209,914 | $150 | 50 |
| 3331 115th Ave | 0.63mi | 3/2.0 | 1,476 (+13%) | 0mo | $310,000 | $210 | 48 |
| 226 Monroe St | 0.66mi | 3/1.0 | 1,190 (-9%) | 12mo | $148,000 | $124 | 41 |
| 240 Thomas St | 0.42mi | 3/1.0 | 1,112 (-15%) | 14mo | $200,570 | $180 | 40 |
| 403 Davis St | 0.49mi | 2/1.0 (-1) | 1,128 (-13%) | 18mo | $204,500 | $181 | 31 |
| 200 Kalamazoo St | 0.69mi | 3/1.0 | 1,135 (-13%) | 20mo | $178,000 | $157 | 26 |
Match score weights: distance 35% · size 25% · config 20% · recency 20%. Top-matched comps best support the ARV.
Projected returns pro-forma
-3.0% appreciation · 3.0% rent growth · sell at horizon
- IRR
- -2.9%
- Equity multiple
- 0.89×
- Total profit
- $-6,443
- Equity at exit
- $31,312
- IRR
- 6.8%
- Equity multiple
- 1.51×
- Total profit
- $30,011
- Equity at exit
- $18,157
Cash invested: $58,800 (down + closing). Projections, not guarantees.
Landlord ↔ Tenant lean methodology
- Overall (STATE)
- 62 Landlord-Friendly
- State Michigan
- 62 Landlord-Friendly · EVEN
- County
- — inherits STATE
- City
- — inherits STATE
ZIP-level market 49010
- Home prices YoY
- -34.3%
- Active inventory
- 183
- Price-to-rent
- 7.3×
Monthly cashflow live
- Estimated rent
- $2,385 medium interval (Pro) →
- Mortgage (P&I)
- −$1,101
- Tax est. 1.5%
- −$262 /mo · $3,150/yr
- Insurance
- −$88
- HOA
- −$0
- Vacancy / Maint / Mgmt
- −$501
- Net cashflow
- $433
Break-even live
UW: 25.0% down · 7.5% · 30yr · 1.5% tax · 5.0% vac · 8.0% maint · 8.0% mgmt
Financing live
Cash to close
- Down payment
- $52,500
- Closing costs
- $6,300
- Reserves months
- —
- Total cash needed
- —
Loan-product check · same deal, 3 products live
Conventional
25% down · 7.5% · 30yr
- Down + closing
- —
- Monthly P&I
- —
- Monthly cashflow
- —
- DSCR
- —
- Eligible?
- —
Personal DTI + credit; lowest rate.
DSCR
20% down · 8.5% · 30yr
- Down + closing
- —
- Monthly P&I
- —
- Monthly cashflow
- —
- DSCR
- —
- Eligible?
- —
No personal income docs; deal must DSCR.
Hard money
10% down · 12.0% · 12mo
- Down + closing
- —
- Monthly P&I
- —
- Monthly cashflow
- —
- DSCR
- —
- Eligible?
- —
Short-term bridge; refi at stabilization.
Rent comps 3 comps
| Address | Beds | Baths | Sqft | Rent | $/sqft | DOM | Units | Dist |
|---|---|---|---|---|---|---|---|---|
| 201 Monroe St Unit 1 Allegan, MI | 3.0 | 2.0 | 1700 | $2,000 | $1.18 | 21d | 1 | 0.68mi |
| 364 Sherman St Allegan, MI | 3.0 | 2.5 | 1800 | $2,795 | $1.55 | 43d | 1 | 0.87mi |
| 364 Sherman St Allegan, MI | 3.0 | 2.5 | 1800 | $2,495 | $1.39 | 21d | 1 | 0.87mi |
Listing history 12 events
-
2026-06-18days on market $210,000 Active 16 DOM
-
2026-06-17days on market $210,000 Active 15 DOM
-
2026-06-16days on market $210,000 Active 14 DOM
-
2026-06-15days on market $210,000 Active 13 DOM
-
2026-06-13days on market $210,000 Active 11 DOM
-
2026-06-12days on market $210,000 Active 10 DOM
-
2026-06-09days on market $210,000 Active 7 DOM
-
2026-06-08days on market $210,000 Active 6 DOM
-
2026-06-07days on market $210,000 Active 5 DOM
-
2026-06-07days on market $210,000 Active 4 DOM
-
2026-06-03remarks 685-char remark
-
2026-06-03$210,000 Active 1 DOM
ⓘ Source: listings_history table (triggers on properties + properties_extension) + one-shot
backfill from property_details.listing_events for pre-trigger history.
Climate risk First Street
- Flood 1/10 Low FEMA zone X (unshaded) · 0% chance over 30 yrs
- Wildfire 3/10 Moderate
- Heat 2/10 Low 7 d/yr ≥97°F today · 16 d/yr by 30 yrs out
- Wind 2/10 Low
- Air quality 3/10 Moderate 2 unhealthy d/yr today · 3 by 30 yrs out
Nearby sold comps map
Loading sold comps map…
Walkable amenities ~0.75 mi
Loading nearby amenities…
Taxation est. · year 1
- Rental income
- $28,615
- − Mortgage interest
- −$11,763
- − Property taxes
- −$3,150
- − Insurance
- −$1,050
- − Repairs & maintenance
- −$2,289
- − Management
- −$2,289
- − Depreciation
- −$6,109
- Taxable income
- $1,964
- Est. tax owed @ 24.0%
- −$471
- After-tax cash flow
- $4,719/yr
For passive investors: Depreciation is non-cash, so a rental often shows a tax loss while cash-flowing — sheltering income. Rental losses are passive: they offset passive income freely, and up to $25,000/yr can offset ordinary (W-2) income if you actively participate and your MAGI is under $100k (phasing out to $0 by $150k); unused losses carry forward. On sale, claimed depreciation is recaptured at up to 25%, and gains may owe capital-gains tax (a 1031 exchange can defer both). Figures are a year-1 estimate at your 24.0% rate — not tax advice; consult a CPA.
Schools (NCES district)
- District
- Allegan Public Schools
- NCES district ID
- 2602220
- Math proficiency
- 26% ▼ -8.00%
- Reading proficiency
- 37% ▼ -7.00%
- Median HH income
- $48,602
- Composite
- 27.27/100
- National rank
- #7008
- State rank
- #338 of 540 in MI
Livability — Allegan
- Score
- 70/100
- State rank
- #318
- US rank
- #7767
Category grades
Schools grade is shown separately in the Schools card above.
Census & demographics
- Census place
- Allegan, MI
- Population (ZIP)
- 18,394
Population outlook (Allegan County) Hauer SSP2
- Today (2025)
- 120,251 people
- By 2030
- 122,204 · +1.6%
- By 2040
- 123,979 · +3.1%
- By 2050
- 122,340 · +1.7%
- By 2075
- 116,088 · -3.5%
- By 2100
- 98,461 · -18.1%
Race, ethnicity, and origin ACS 2023
- Neighborhood character
- Predominantly White (87%)
- Race & ethnicity
- White 87% Two or more races 8% Hispanic / Latino 5% Black 1%
- Common ancestry
- Iranian 10% Romanian 4% Italian 2%
- Foreign-born
- 2% · Canada, China
- Languages at home
- 98% English-only · Spanish 2%
Political lean MEDSL · Allegan
- 2024 margin
- Strong R (+27.2) · D 35.7% · R 62.9% · Other 1.5%
- 2008→2024 swing
- -16.5pp toward R · 2008: -10.7pp · 2024: -27.2pp
- All cycles
- 2024: R+27.2 2020: R+25.2 2016: R+28.8 2012: R+19.2 2008: R+10.7
Not yet ingested
- Civics
- —
Market trends
- HPI YoY
- ▼ -136.08%
- Current HPI
- 260.4976
- Rent YoY
- —
- Metro
- —
- State GDP YoY
- ▲ 1.37%
- F500 in state
- 28
Industry mix (Fortune 500 HQ in MI)
| Industry | F500 HQs | Revenue |
|---|---|---|
| Automotive Parts | 3 | $48B |
|
||
| Automotive | 2 | $372B |
|
||
| Chemicals | 1 | $45B |
|
||
| Automotive Retail | 1 | $29B |
|
||
| Healthcare / Medical Devices | 1 | $23B |
|
||
| Automotive Technology | 1 | $20B |
|
||
Price history
+297.0% since first listed65 events — show timeline
- 2026-06-02 Listed $210,000 REALCOMP
- 2026-06-02 Listed $210,000 MiRealSource-MiMLS
- 2026-06-02 Listed $210,000 SW Michigan MLS
- 2022-05-25 Listing Removed — REALCOMP
- 2021-05-13 Sold (MLS) $115,000 SW Michigan MLS
- 2021-05-13 Sold (MLS) $115,000 REALCOMP
- 2021-03-20 Pending — REALCOMP
- 2021-03-20 Pending — SW Michigan MLS
- 2021-03-15 Listed $109,000 MiRealSource-MiMLS
- 2021-03-15 Listed $109,000 SW Michigan MLS
- 2021-03-15 Listed $109,000 REALCOMP
- 2020-08-24 Listing Removed — MiRealSource-MiMLS
- 2020-08-24 Listing Removed — REALCOMP
- 2020-07-27 Listing Removed — SW Michigan MLS
- 2020-07-27 Pending — SW Michigan MLS
- 2020-05-11 Listed $109,000 SW Michigan MLS
- 2020-05-11 Listed $109,000 MiRealSource-MiMLS
- 2020-05-11 Listed $109,000 REALCOMP
- 2019-06-06 Sold (Public Records) $75,000 Public Records
- 2019-05-31 Sold (MLS) $75,000 SW Michigan MLS
- 2019-05-31 Sold (MLS) $75,000 REALCOMP
- 2019-05-11 Pending — SW Michigan MLS
- 2019-05-08 Relisted — SW Michigan MLS
- 2019-05-08 Listing Removed — SW Michigan MLS
- 2019-05-05 Listed $78,500 SW Michigan MLS
- 2019-05-05 Listed $78,500 REALCOMP
- 2018-05-07 Listing Removed — REALCOMP
- 2018-05-07 Listing Removed — SW Michigan MLS
- 2018-03-15 Listed $78,500 REALCOMP
- 2018-03-15 Listed $78,500 SW Michigan MLS
- 2018-01-25 Listing Removed — REALCOMP
- 2018-01-25 Listing Removed — SW Michigan MLS
- 2017-11-09 Listed $70,500 SW Michigan MLS
- 2017-11-06 Listed $70,500 REALCOMP
- 2014-12-23 Listing Removed — SW Michigan MLS
- 2014-12-23 Listing Removed — SW Michigan MLS
- 2014-10-19 Listing Removed — SW Michigan MLS
- 2014-10-17 Listing Removed — SW Michigan MLS
- 2014-10-16 Listing Removed — SW Michigan MLS
- 2014-09-28 Listing Removed — SW Michigan MLS
- 2014-09-26 Listing Removed — SW Michigan MLS
- 2014-09-25 Listing Removed — SW Michigan MLS
- 2014-09-25 Listing Removed — SW Michigan MLS
- 2014-09-25 Listing Removed — SW Michigan MLS
- 2009-08-07 Listing Removed — REALCOMP
- 2009-02-07 Listed $78,500 REALCOMP
- 2009-02-07 Listed $78,500 SW Michigan MLS
- 2009-02-07 Listed $78,500 SW Michigan MLS
- 2007-06-18 Listed $99,900 SW Michigan MLS
- 2006-07-12 Listed $110,000 SW Michigan MLS
- 2006-03-14 Listed $115,000 SW Michigan MLS
- 2005-07-15 Listed $115,000 SW Michigan MLS
- 2002-03-13 Listed $96,000 SW Michigan MLS
- 2002-03-13 Listed $96,000 SW Michigan MLS
- 2001-10-22 Listed $94,900 SW Michigan MLS
- 1997-05-30 Listing Removed — REALCOMP
- 1997-04-30 Listing Removed — SW Michigan MLS
- 1997-04-30 Listing Removed — REALCOMP
- 1996-10-02 Listing Removed — SW Michigan MLS
- 1996-10-02 Listed $47,900 REALCOMP
- 1996-10-02 Listed $47,900 SW Michigan MLS
- 1996-09-30 Listed $49,900 SW Michigan MLS
- 1996-09-30 Listed $49,900 REALCOMP
- 1996-06-29 Listed $52,900 SW Michigan MLS
- 1996-06-29 Listed $52,900 REALCOMP
Cash-flow waterfall
monthlySold comps — $/sqft
last 12 mo · ≤1 miLoading sold comps…