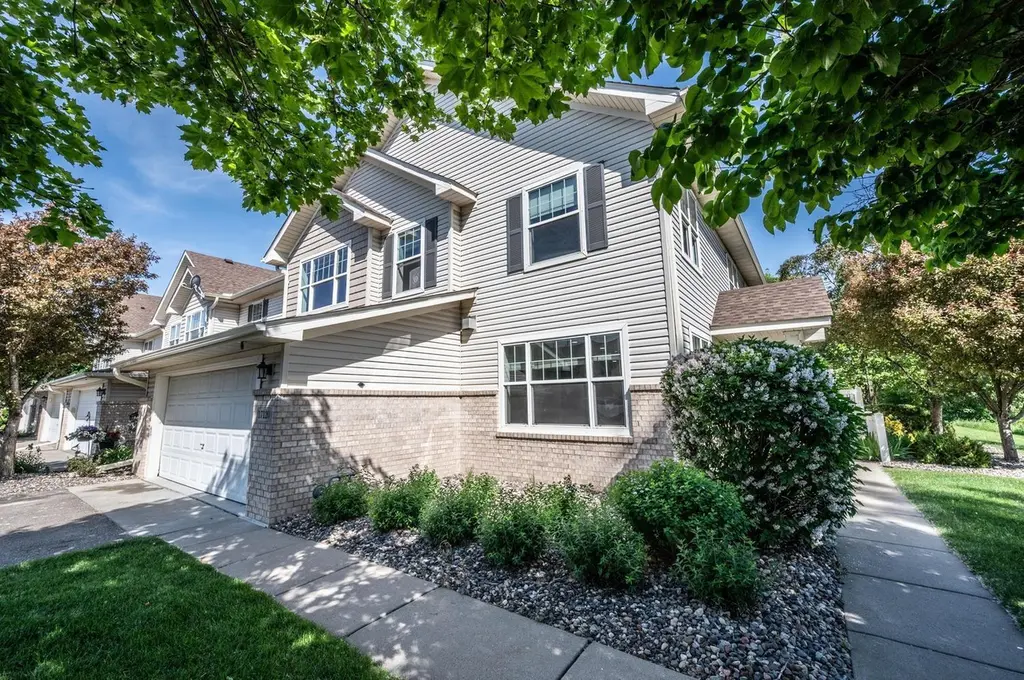
17120 Embers Ave #208 · Lakeville, MN
Flood risk 1/10 · Minimal
- FEMA flood zone
- X (unshaded)
- Chance of flooding over 30 yrs
- 0.0%
- Est. flood insurance / yr
- $507 – $1,088
Fire risk 1/10 · Minimal
- Est. fire insurance / yr
- $888 – $1,650
Heat risk 2/10 · Minimal
- Hot days now (above 100°F)
- 7 days/yr
- Hot days in 30 yrs
- 14 days/yr
Wind risk 2/10 · Minimal
- Chance of severe wind over 30 yrs
- —
Air-quality risk 2/10 · Minimal
- Unhealthy air days now
- 1 days/yr
- Unhealthy air days in 30 yrs
- 1 days/yr
Risk factors via First Street. Map © Google.
Why this score? — see what drove the D grade
The composite is a weighted blend of 9 inputs, each scored 0–100. Each bar is that input's sub-score; the figure is the points it added to the 100-point composite (weight × sub-score).
- Cash flow +11.3/30.0
- ARV discount +7.5/15.0
- Schools +4.4/10.0
- 1% rule +4.3/10.0
- Livability +4.2/5.0
- DSCR +3.3/10.0
- Rent growth +2.5/5.0
- Condition / age +2.5/5.0
- Appreciation +0.0/10.0
$299,900
🖨 Deal sheet (PDF) 📄 Offer letter ✓ Due diligence
Listing remarks
Beautiful end-unit townhome proudly owned by the original owner! This spacious home features 3 large bedrooms upstairs plus an oversized loft offering flexible living space for a home office, playroom, or second family room. Enjoy the huge oversized garage with plenty of room for storage, hobbies, or additional parking. Fresh paint throughout and brand-new carpet to be installed — buyer gets to choose the carpet color! Fantastic location backing to scenic trails that connect East Lake Trail and North Creek Greenway. * New carpet to be installed in upper level; three bedrooms, loft and hallway area.
Key facts
- Oversized loft
- Scenic trails
- North creek greenway
Tags
Property features AI
Finance
- Other: Directions: Pilot to 170th, south on Embers to home
- HOA & community: Community Association Group; Monthly association fee $370; HOA covers hazard insurance, lawn care, grounds maintenance, professional management, and snow removal
Exterior
- Parking: Attached tuckunder, insulated garage; 2-car garage (27x20)
- Utilities: City water connected; City sewer connected; Natural gas; Electric with circuit breakers
- Home design: Attached residential property; Two levels; Vaulted ceiling(s); Above-grade finished area 1,777
- Construction: Slab foundation; Foundation area 1,084
- Exterior features: Patio; Vinyl exterior
Interior
- Kitchen: Range; Dishwasher; Garbage disposal; Refrigerator; Freezer; Breakfast bar / informal dining area (kitchen/dining)
- Bedrooms: 3 bedrooms (primary suite; other bedrooms on upper level); Bedroom dimensions include: 16x12, 10x15, 15x11
- Bathrooms: 2 full bathrooms; 1 half bathroom
- Heating & cooling: Forced air heating; Fireplace heating; Central air conditioning; Gas water heater
- Interior features: Vaulted ceilings; Walk-in closet; 2nd floor laundry; Primary bedroom suite; Main floor half bath; Separate tub and shower; Double sink in primary; Upper level full bath; Walk-in shower stall; Has fireplace (gas, located in family room)
- Laundry & utility: Washer and dryer included; Laundry room on upper level; Washer/dryer hookup
Neighborhood map
What this means for you Summary
Snapshot
- This is a 3-bed/2.0-bath townhouse listed at $300k.
Deal economics
- At list price, monthly cash flow is $-109 ($-1k/yr) — negative.
- To cash-flow at today's rent, offer at most $281k (6.4% below list).
- To meet the 1% rule (rent ≥ 1% of price), the offer needs to be $279k (7.0% below list).
- Recommended offer: $279k (7.0% below list) — sets the bar for 1% rule.
- Cap rate 5.9% vs local median 3.2% in Lakeville — top-decile yield for the area; either an underpriced asset or a hidden risk that comps aren't pricing in. Stress-test before assuming the spread holds.
Location & tenants
- Location reads 84/100 on livability (#25 in MN, #711 nationally) — a professional / high-income tenant draw. Strengths: crime A+, employment A+, housing A+; Watch: amenities D+, commute F, cost of living F.
- Farmington Public School District (suburban): math 43% / reading 52% proficiency, ranked #104 of 301 in MN (top 35%) — families likely to look elsewhere, expect single-tenant / working-renter base with shorter leases; only 12% free/reduced lunch — higher-income household profile.
- Zoned schools: North Trail Elementary (math 57% / reading 57%, grade C+, #265 of 857 statewide, top 35%, 639 students, 34% FRL); Levi P. Dodge Middle School (math 37% / reading 54%, grade D+, #106 of 258 statewide, top 43%, 721 students, 27% FRL); Farmington High School (math 32% / reading 56%, grade F, #210 of 471 statewide, top 44%, 2,201 students, 22% FRL) — zoned schools average 28% FRL vs 12% district-wide (16 pts higher); higher-poverty schools than district average — tighter screening recommended.
- Market conditions: 325 active listings in the ZIP; 10 comparable units currently listed for rent nearby; rentals leasing fast (median 12d on market — plan ~1-2 weeks tenant-placement turnaround); high-income renter base; 2,134 units permitted in Dakota County in 2024 (898 in 5+ unit buildings).
Forward outlook
- Local home prices are declining (-3.0%/yr); year-one equity from $2k of loan paydown is wiped out by about $9k of value loss. Plan a longer hold.
- Dakota County population projected at +11% by 2050 — modest demand growth; plan on rents tracking national, not racing it.
Negotiation context
- It's been on market 23 days — a 2% lower offer ($295k) is reasonable based on typical stale-listing flexibility.
Questions for the listing agent
- What do current leases actually rent for vs. the listed asking? Can we see a recent rent roll and the last 12 months of T-12 income?
- What does the HOA fee cover, when was the last increase, and are there any pending special assessments or reserve-fund shortfalls?
- Is there a deadline driving the sale (1031 exchange, divorce, estate, relocation)? That informs how much negotiation room exists.
- Schools are A-rated — typically a magnet for longer-tenancy family renters. What's the average tenant stay here, and is there a school-zone premium baked into asking?
- The area grade is low — what's the realistic commute time and amenity access for the typical tenant pool here? Any planned neighborhood developments (good or bad) we should know about?
- What's the average days-on-market for RENTAL listings here right now (not sales)? A rising rental-DOM trend means longer vacancies and softer asking-rent achievability than the comps imply.
- What's the recent tenant-quality profile in this submarket — average credit score on applications, eviction rate, late-payment / NSF rate, and stable-employment percentage? A property-management company in the area should have these aggregated.
- How much new for-sale + rental construction is in the pipeline within 1–3 miles? Heavy new supply typically softens prices + rents 12–24 months out; constrained supply supports both.
Investment metrics
- 1% rule
- 0.93% ✗
- Cap rate
- 5.86%
- Cash-on-cash
- -1.55%
- DSCR
- 0.93
- GRM
- 9.0
CMA / ARV
No comps found within radius.
Projected returns pro-forma
-3.0% appreciation · 3.0% rent growth · sell at horizon
- IRR
- -18.8%
- Equity multiple
- 0.34×
- Total profit
- $-55,320
- Equity at exit
- $44,716
- IRR
- -11.1%
- Equity multiple
- 0.33×
- Total profit
- $-56,303
- Equity at exit
- $25,930
Cash invested: $83,972 (down + closing). Projections, not guarantees.
Landlord ↔ Tenant lean methodology
- Overall (STATE)
- 46 Balanced
- State Minnesota
- 46 Balanced · D+2
- County
- — inherits STATE
- City
- — inherits STATE
ZIP-level market 55024
- Home prices YoY
- -31.2%
- Active inventory
- 325
- Price-to-rent
- 9.0×
Monthly cashflow live
- Estimated rent
- $2,789 high interval (Pro) →
- Mortgage (P&I)
- −$1,573
- Tax from tax record
- −$244 /mo · $2,934/yr
- Insurance
- −$125
- HOA
- −$370
- Vacancy / Maint / Mgmt
- −$586
- Net cashflow
- $-109
Break-even live
Sensitivity live
| Price | -10% $61 | -5% $-24 | +0% $-109 | +5% $-193 | +10% $-278 |
|---|---|---|---|---|---|
| Rent | -10% $-329 | -5% $-219 | +0% $-109 | +5% $2 | +10% $112 |
| Rate | -1.0pp $42 | -0.5pp $-32 | base $-109 | +0.5pp $-186 | +1.0pp $-265 |
UW: 25.0% down · 7.5% · 30yr · 1.5% tax · 5.0% vac · 8.0% maint · 8.0% mgmt
Financing live
Cash to close
- Down payment
- $74,975
- Closing costs
- $8,997
- Reserves months
- —
- Total cash needed
- —
Loan-product check · same deal, 3 products live
Conventional
25% down · 7.5% · 30yr
- Down + closing
- —
- Monthly P&I
- —
- Monthly cashflow
- —
- DSCR
- —
- Eligible?
- —
Personal DTI + credit; lowest rate.
DSCR
20% down · 8.5% · 30yr
- Down + closing
- —
- Monthly P&I
- —
- Monthly cashflow
- —
- DSCR
- —
- Eligible?
- —
No personal income docs; deal must DSCR.
Hard money
10% down · 12.0% · 12mo
- Down + closing
- —
- Monthly P&I
- —
- Monthly cashflow
- —
- DSCR
- —
- Eligible?
- —
Short-term bridge; refi at stabilization.
Rent comps 10 comps
| Address | Beds | Baths | Sqft | Rent | $/sqft | DOM | Units | Dist |
|---|---|---|---|---|---|---|---|---|
| 17079 Dysart Pl Lakeville, MN | 3.0 | 3.0 | 1894 | $2,795 | $1.48 | 12d | 1 | 0.33mi |
| 17074 Dysart Pl Unit 17074 Lakeville, MN | 3.0 | 2.5 | 1750 | $2,800 | $1.60 | 12d | 1 | 0.36mi |
| 17066 Dysart Pl Unit 17066 Lakeville, MN | 3.0 | 2.5 | 1894 | $2,895 | $1.53 | 21d | 1 | 0.37mi |
| 17040 Dysart Pl Unit 17040 Lakeville, MN | 3.0 | 2.5 | 1700 | $2,700 | $1.59 | 0d | 1 | 0.38mi |
| 5076 161st St W Lakeville, MN | 1.0–3.0 | 1.0–2.0 | 1186 | $2,702 | $2.28 | 0d | 14 | 1.01mi |
| 5181 161st St W Lakeville, MN | 1.0–3.0 | 1.0–2.0 | 1044 | $2,340 | $2.24 | 0d | 4 | 1.06mi |
| 5017 161st St W Unit 5017 Lakeville, MN | 2.0 | 2.5 | 1895 | $3,350 | $1.77 | 16d | 1 | 1.06mi |
| 16106 Duvane Way Lakeville, MN | 3.0 | 3.0 | 1564 | $3,395 | $2.17 | 23d | 1 | 1.15mi |
| 15899 Elmhurst Ln Saint Paul, MN | 3.0 | 1.0–2.0 | 1031 | $2,667 | $2.59 | 0d | 14 | 1.19mi |
| 18388 English Ave Farmington, MN | 2.0 | 2.0 | 1544 | $1,999 | $1.29 | 45d | 1 | 1.25mi |
HOA detail
- Monthly dues
- $370 · $4,440/yr
Listing history 14 events
-
2026-06-21days on market $299,900 Active 23 DOM
-
2026-06-18days on market $299,900 Active 20 DOM
-
2026-06-17days on market $299,900 Active 19 DOM
-
2026-06-16days on market $299,900 Active 18 DOM
-
2026-06-15days on market $299,900 Active 17 DOM
-
2026-06-13days on market $299,900 Active 15 DOM
-
2026-06-09days on market $299,900 Active 11 DOM
-
2026-06-08days on market $299,900 Active 10 DOM
-
2026-06-07days on market $299,900 Active 9 DOM
-
2026-06-04days on market $299,900 Active 6 DOM
-
2026-06-03days on market $299,900 Active 5 DOM
-
2026-06-02days on market $299,900 Active 4 DOM
-
2026-06-01days on market $299,900 Active 3 DOM
-
2026-05-31days on market $299,900 Active 2 DOM
ⓘ Source: listings_history table (triggers on properties + properties_extension) + one-shot
backfill from property_details.listing_events for pre-trigger history.
Tax reassessment forecast MN · Partial reset (capped growth)
- Current annual tax
- $2,934 · $244/mo
- Projected year-2 tax
- $3,146 · $262/mo
- Expected delta
- +$212/yr (+$18/mo · 7.2%)
ⓘ Screening estimate from a state-policy table — verify with the county assessor before closing.
Climate risk First Street
- Flood 1/10 Low FEMA zone X (unshaded) · 0% chance over 30 yrs
- Wildfire 1/10 Low
- Heat 2/10 Low 7 d/yr ≥100°F today · 14 d/yr by 30 yrs out
- Wind 2/10 Low
- Air quality 2/10 Low 1 unhealthy d/yr today · 1 by 30 yrs out
Nearby sold comps map
Loading sold comps map…
Walkable amenities ~0.75 mi
Loading nearby amenities…
Taxation est. · year 1
- Rental income
- $33,473
- − Mortgage interest
- −$16,799
- − Property taxes
- −$2,934
- − Insurance
- −$1,500
- − Repairs & maintenance
- −$2,678
- − Management
- −$2,678
- − HOA
- −$4,440
- − Depreciation
- −$8,724
- Taxable loss
- −$6,280
- Est. tax savings @ 24.0%
- +$1,507
- After-tax cash flow
- $205/yr
For passive investors: Depreciation is non-cash, so a rental often shows a tax loss while cash-flowing — sheltering income. Rental losses are passive: they offset passive income freely, and up to $25,000/yr can offset ordinary (W-2) income if you actively participate and your MAGI is under $100k (phasing out to $0 by $150k); unused losses carry forward. On sale, claimed depreciation is recaptured at up to 25%, and gains may owe capital-gains tax (a 1031 exchange can defer both). Figures are a year-1 estimate at your 24.0% rate — not tax advice; consult a CPA.
Schools (NCES district)
- District
- Farmington Public School District
- NCES district ID
- 2711820
- Math proficiency
- 43% ▼ -12.00%
- Reading proficiency
- 52% ▼ -7.00%
- Median HH income
- $83,959
- Composite
- 43.93/100
- National rank
- #2905
- State rank
- #104 of 301 in MN
Livability — Lakeville
- Score
- 84/100
- State rank
- #25
- US rank
- #711
Category grades
Schools grade is shown separately in the Schools card above.
Census & demographics
- Census place
- Lakeville, MN
- County
- Dakota County · 417,704 people
- City population
- 64,762
- Metro
- Minneapolis-St. Paul-Bloomington, MN-WI
- Population (ZIP)
- 37,287
- Household income
- $127,280
- Rent vs Own
- Severe rent burden
- 288.0
Population outlook (Dakota County) Hauer SSP2
- Today (2025)
- 450,671 people
- By 2030
- 465,068 · +3.2%
- By 2040
- 486,770 · +8.0%
- By 2050
- 498,743 · +10.7%
- By 2075
- 533,865 · +18.5%
- By 2100
- 550,133 · +22.1%
Race, ethnicity, and origin ACS 2023
- Neighborhood character
- Predominantly White (84%)
- Race & ethnicity
- White 84% Hispanic / Latino 6% Two or more races 4% Black 4% Asian 3%
- Hispanic origin (detail)
- Mexican 3%
- Common ancestry
- Portuguese 14% Scottish 3% Romanian 3%
- Foreign-born
- 5% · Canada, Vietnam
- Languages at home
- 93% English-only · Spanish 3% Other Asian/Pacific 1% Russian/Polish/Slavic 1%
Political lean MEDSL · Dakota
- 2024 margin
- D (+12.9) · D 55.4% · R 42.5% · Other 2.1%
- 2008→2024 swing
- +7.4pp toward D · 2008: 5.5pp · 2024: 12.9pp
- All cycles
- 2024: D+12.9 2020: D+13.9 2016: D+4.7 2012: D+2.9 2008: D+5.5
Not yet ingested
- Civics
- —
Market trends
- HPI YoY
- ▼ -102.47%
- Current HPI
- 225.6882
- Rent YoY
- —
- Metro
- Minneapolis-St. Paul-Bloomington, MN-WI
- State GDP YoY
- ▲ 2.41%
- F500 in state
- 34
Industry mix (Fortune 500 HQ in MN)
| Industry | F500 HQs | Revenue |
|---|---|---|
| Healthcare | 2 | $407B |
|
||
| Retail | 2 | $150B |
|
||
| Consumer Goods | 2 | $32B |
|
||
| Industrial Machinery | 2 | $6B |
|
||
| Agriculture | 1 | $40B |
|
||
| Healthcare / Medical Devices | 1 | $32B |
|
||
Price history
1 event — show timeline
- 2026-05-29 Listed $299,900 NORTHSTARMLS as Distributed by MLS Grid
Property tax history
+4.0%/yrLatest (2025): $2,934 · +5.4% YoY. Source: county tax records.
Cash-flow waterfall
monthlySold comps — $/sqft
last 12 mo · ≤1 miLoading sold comps…