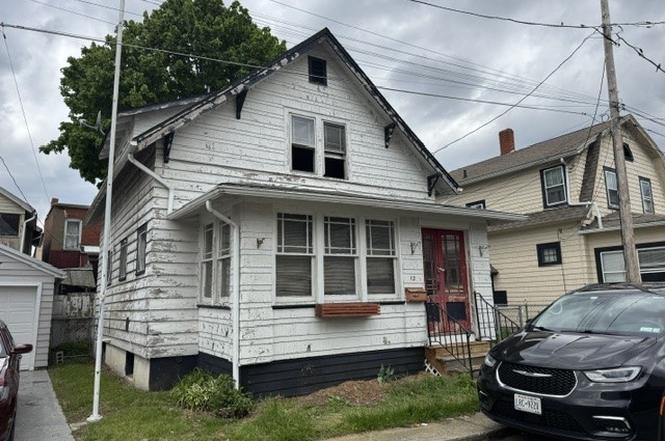
12 Elmwood Pl · Hornell, NY
Flood risk 1/10 · Minimal
- FEMA flood zone
- X (shaded)
- Chance of flooding over 30 yrs
- 0.0%
- Est. flood insurance / yr
- $473 – $860
Fire risk 3/10 · Minor
- Est. fire insurance / yr
- $691 – $1,283
Heat risk 3/10 · Minor
- Hot days now (above 92°F)
- 8 days/yr
- Hot days in 30 yrs
- 18 days/yr
Wind risk 1/10 · Minimal
- Chance of severe wind over 30 yrs
- —
Air-quality risk 1/10 · Minimal
- Unhealthy air days now
- 0 days/yr
- Unhealthy air days in 30 yrs
- 0 days/yr
Risk factors via First Street. Map © Google.
Why this score? — see what drove the B+ grade
The composite is a weighted blend of 9 inputs, each scored 0–100. Each bar is that input's sub-score; the figure is the points it added to the 100-point composite (weight × sub-score).
- Cash flow +30.0/30.0
- 1% rule +10.0/10.0
- DSCR +10.0/10.0
- ARV discount +7.5/15.0
- Appreciation +7.0/10.0
- Livability +3.5/5.0
- Schools +3.4/10.0
- Rent growth +2.5/5.0
- Condition / age +2.5/5.0
$34,900
🖨 Deal sheet 📄 Offer letter ✓ Due diligence
Listing remarks MLS
2-bedroom, 1-bath home offering 1,296 sq ft. Property is being sold AS-IS / WHERE-IS with all personal property remaining. Interior access not available. Opportunity for investors or buyers prepared for a full renovation.
Key facts
- 1,904 sq ft lot
- Built 1925
- Listed 4 days
Property features AI
Exterior
- Parking: No garage; No driveway
- Utilities: Public water connected
- Home design: Single-story; Existing structure; Frame construction
- Construction: Stone foundation
- Exterior features: Rectangular residential lot; 36 x 52 lot dimensions; City street frontage
Interior
- Kitchen: Gas water heater
- Bedrooms: Total rooms: 6
- Bathrooms: 1 full bathroom
- Heating & cooling: Gas forced-air heating
- Interior features: Den; Other features (see remarks); Full basement
- Laundry & utility: Water connected (public)
Neighborhood map
What this means for you Summary
Snapshot
- This is a 2-bed/1.0-bath single-family listed at $35k.
Deal economics
- At list price, monthly cash flow is $781 ($9k/yr) — positive.
- The deal already cash-flows at list — no discount required.
- Meets the 1% rule at list price ($1k rent vs $35k).
- Cap rate 33.2% vs local median 13.3% in Hornell — top-decile yield for the area; either an underpriced asset or a hidden risk that comps aren't pricing in. Stress-test before assuming the spread holds.
Location & tenants
- Location reads 70/100 on livability (#451 in NY) — a middle-class / working-renter tenant base. Strengths: cost of living A+, housing A+, health & safety A+; Watch: amenities C-, schools D, crime F.
- Hornell City School District (town): math 33% / reading 49% proficiency, ranked #519 of 590 in NY (top 88%) — families likely to look elsewhere, expect single-tenant / working-renter base with shorter leases.
- Market conditions: 59 active listings in the ZIP; 196 units permitted in Steuben County in 2024 (0 in 5+ unit buildings).
Forward outlook
- In year one you build about $2k of equity ($241 loan paydown + $1k appreciation (4.0% local appreciation)).
- Steuben County population projected at -20% by 2050 — secular population decline; favor cash flow + early exit over multi-decade hold.
- At projected returns (4.0% appreciation + 3.0% rent growth), your $10k cash investment doubles in ~1 year — after that, you're playing with house money.
Negotiation context
- Only 5 days on market — expect competitive offers; lowballing is unlikely to land.
- 2 sale attempts with the ask held roughly flat each time — persistent listings suggest the price (not the market) is what's stuck; bring a comps-based counter.
- Current owner paid $18k; list at $35k implies a 89% gain — meaningful room to come down on a strong offer.
Risks & watch-outs
- Watch-outs: property tax is 3.1% of price; built in 1925 — expect roof / HVAC / electrical / plumbing capex.
Questions for the listing agent
- Built in 1925 — when were the roof, HVAC, electrical panel, plumbing, and water heater last replaced?
- Property tax is high relative to price — has the assessment been appealed recently, and will the sale trigger a re-assessment?
- Is there a deadline driving the sale (1031 exchange, divorce, estate, relocation)? That informs how much negotiation room exists.
- Schools are D-rated, which usually means shorter tenancies and higher turnover. Who's the typical renter profile here, and what's been the actual vacancy rate?
- Crime grade is F in this area — have there been break-ins, vandalism, or insurance claims at this property in the last 3 years? What carrier currently insures it and at what premium?
- What's the average days-on-market for RENTAL listings here right now (not sales)? A rising rental-DOM trend means longer vacancies and softer asking-rent achievability than the comps imply.
- What's the recent tenant-quality profile in this submarket — average credit score on applications, eviction rate, late-payment / NSF rate, and stable-employment percentage? A property-management company in the area should have these aggregated.
- How much new for-sale + rental construction is in the pipeline within 1–3 miles? Heavy new supply typically softens prices + rents 12–24 months out; constrained supply supports both.
Investment metrics
- 1% rule
- 3.88% ✓
- Cap rate
- 33.16%
- Cash-on-cash
- 95.96%
- DSCR
- 5.27
- GRM
- 2.1
CMA / ARV
- ARV (on-the-fly)
- $104,013
- Comps found
- 12
Show comp detail 12 sales within ~0.75 mi
| Address | Dist | Beds/Ba | Sqft | Sold | Price | $/sf | Match |
|---|---|---|---|---|---|---|---|
| 134 E Elm St | 0.22mi | 3/1.0 (+1) | 1,120 (-2%) | 4mo | $57,000 | $51 | 78 |
| 12 Elmwood Pl | 0.00mi | 2/1.0 | 1,296 (+13%) | 3mo | $18,500 | $14 | 75 |
| 169 Leach Ave | 0.39mi | 2/1.0 | 1,090 (-5%) | 1mo | $105,000 | $96 | 73 |
| 25 E Main St | 0.29mi | 3/1.0 (+1) | 1,164 (+2%) | 8mo | $114,900 | $99 | 72 |
| 68 Catherine St | 0.48mi | 2/1.0 | 1,166 (+2%) | 3mo | $85,000 | $73 | 72 |
| 30 Glen Ave | 0.39mi | 3/1.0 (+1) | 1,152 (+1%) | 9mo | $105,000 | $91 | 68 |
| 48 Bemis Ave | 0.32mi | 3/1.0 (+1) | 1,230 (+8%) | 8mo | $55,000 | $45 | 61 |
| 5 Blaine St | 0.70mi | 3/2.0 (+1) | 1,142 (-0%) | 1mo | $165,000 | $144 | 57 |
| 95-97 Hartshorn St | 0.62mi | 3/1.0 (+1) | 1,084 (-5%) | 2mo | $99,900 | $92 | 56 |
| 175 S Leach Ave | 0.41mi | 3/1.5 (+1) | 1,248 (+9%) | 4mo | $22,501 | $18 | 55 |
| 19 Oconnor Ave | 0.48mi | 3/1.5 (+1) | 1,216 (+6%) | 8mo | $65,000 | $53 | 53 |
| 34 School St | 0.69mi | 3/1.5 (+1) | 1,256 (+10%) | 7mo | $125,000 | $100 | 39 |
Match score weights: distance 35% · size 25% · config 20% · recency 20%. Top-matched comps best support the ARV.
Projected returns pro-forma
3.95% appreciation · 3.0% rent growth · sell at horizon
- IRR
- —
- Equity multiple
- 6.71×
- Total profit
- $55,804
- Equity at exit
- $17,588
- IRR
- 99.8%
- Equity multiple
- 13.98×
- Total profit
- $126,867
- Equity at exit
- $28,683
Cash invested: $9,772 (down + closing). Projections, not guarantees.
Landlord ↔ Tenant lean methodology
- Overall (STATE)
- 15 Strongly Tenant-Friendly
- State New York
- 15 Strongly Tenant-Friendly · D+10
- County
- — inherits STATE
- City
- — inherits STATE
ZIP-level market 14843
- Home prices YoY
- 1.9%
- Active inventory
- 59
- Price-to-rent
- 2.1×
Monthly cashflow live
- Estimated rent
- $1,355 medium interval (Pro) →
- Mortgage (P&I)
- −$183
- Tax from tax record
- −$91 /mo · $1,095/yr
- Insurance
- −$15
- HOA
- −$0
- Vacancy / Maint / Mgmt
- −$284
- Net cashflow
- $781
Break-even live
UW: 25.0% down · 7.5% · 30yr · 1.5% tax · 5.0% vac · 8.0% maint · 8.0% mgmt
Financing live
Cash to close
- Down payment
- $8,725
- Closing costs
- $1,047
- Reserves months
- —
- Total cash needed
- —
Loan-product check · same deal, 3 products live
Conventional
25% down · 7.5% · 30yr
- Down + closing
- —
- Monthly P&I
- —
- Monthly cashflow
- —
- DSCR
- —
- Eligible?
- —
Personal DTI + credit; lowest rate.
DSCR
20% down · 8.5% · 30yr
- Down + closing
- —
- Monthly P&I
- —
- Monthly cashflow
- —
- DSCR
- —
- Eligible?
- —
No personal income docs; deal must DSCR.
Hard money
10% down · 12.0% · 12mo
- Down + closing
- —
- Monthly P&I
- —
- Monthly cashflow
- —
- DSCR
- —
- Eligible?
- —
Short-term bridge; refi at stabilization.
Listing history 6 events
-
2026-06-19days on market $34,900 Active 5 DOM
-
2026-06-18days on market $34,900 Active 4 DOM
-
2026-06-17days on market $34,900 Active 3 DOM
-
2026-06-16days on market $34,900 Active 2 DOM
-
2026-06-15remarks 82-char remark
-
2026-06-15$34,900 Active 1 DOM
ⓘ Source: listings_history table (triggers on properties + properties_extension) + one-shot
backfill from property_details.listing_events for pre-trigger history.
Tax reassessment forecast NY · Partial reset (capped growth)
- Current annual tax
- $1,095 · $91/mo
- Projected year-2 tax
- $1,095 · $91/mo
- Expected delta
- $0/yr ($0/mo · 0.0%)
ⓘ Screening estimate from a state-policy table — verify with the county assessor before closing.
Climate risk First Street
- Flood 1/10 Low FEMA zone X (shaded) · 0% chance over 30 yrs
- Wildfire 3/10 Moderate
- Heat 3/10 Moderate 8 d/yr ≥92°F today · 18 d/yr by 30 yrs out
- Wind 1/10 Low
- Air quality 1/10 Low 0 unhealthy d/yr today · 0 by 30 yrs out
Nearby sold comps map
Loading sold comps map…
Walkable amenities ~0.75 mi
Loading nearby amenities…
Taxation est. · year 1
- Rental income
- $16,256
- − Mortgage interest
- −$1,955
- − Property taxes
- −$1,095
- − Insurance
- −$174
- − Repairs & maintenance
- −$1,300
- − Management
- −$1,300
- − Depreciation
- −$1,015
- Taxable income
- $9,416
- Est. tax owed @ 24.0%
- −$2,260
- After-tax cash flow
- $7,117/yr
For passive investors: Depreciation is non-cash, so a rental often shows a tax loss while cash-flowing — sheltering income. Rental losses are passive: they offset passive income freely, and up to $25,000/yr can offset ordinary (W-2) income if you actively participate and your MAGI is under $100k (phasing out to $0 by $150k); unused losses carry forward. On sale, claimed depreciation is recaptured at up to 25%, and gains may owe capital-gains tax (a 1031 exchange can defer both). Figures are a year-1 estimate at your 24.0% rate — not tax advice; consult a CPA.
Schools (NCES district)
- District
- Hornell City School District
- NCES district ID
- 3614820
- Math proficiency
- 33% ▼ -8.00%
- Reading proficiency
- 49% ▲ 6.00%
- Median HH income
- $40,251
- Composite
- 34.33/100
- National rank
- #5234
- State rank
- #519 of 590 in NY
Livability — Hornell
- Score
- 70/100
- State rank
- #451
- US rank
- #7888
Category grades
Schools grade is shown separately in the Schools card above.
Census & demographics
- Census place
- Hornell, NY
- County
- Steuben County · 41,193 people
- City population
- 12,383
- Metro
- Corning, NY
- Population (ZIP)
- 12,383
- Household income
- $57,874
- Rent vs Own
- Severe rent burden
- 415.0
Population outlook (Steuben County) Hauer SSP2
- Today (2025)
- 93,062 people
- By 2030
- 89,793 · -3.5%
- By 2040
- 82,353 · -11.5%
- By 2050
- 74,286 · -20.2%
- By 2075
- 55,589 · -40.3%
- By 2100
- 37,587 · -59.6%
Race, ethnicity, and origin ACS 2023
- Neighborhood character
- Predominantly White (92%)
- Race & ethnicity
- White 92% Two or more races 3% Hispanic / Latino 3% Black 2%
- Common ancestry
- Lithuanian 3% Romanian 2% Iranian 2%
- Foreign-born
- 4% · Canada
- Languages at home
- 95% English-only · French/Haitian/Cajun 2% Arabic 1% Spanish 1%
Political lean MEDSL · Steuben
- 2024 margin
- Solid R (+31.8) · D 34.1% · R 65.9%
- 2008→2024 swing
- -15.0pp toward R · 2008: -16.8pp · 2024: -31.8pp
- All cycles
- 2024: R+31.8 2020: R+29.6 2016: R+36.2 2012: R+16.4 2008: R+16.8
Not yet ingested
- Civics
- —
Market trends
- HPI YoY
- ▲ 3.95%
- Current HPI
- 210.1986
- Rent YoY
- —
- Metro
- Corning, NY
- State GDP YoY
- ▲ 2.60%
- F500 in state
- 92
Industry mix (Fortune 500 HQ in NY)
| Industry | F500 HQs | Revenue |
|---|---|---|
| Financial Services | 10 | $950B |
|
||
| Consumer Goods | 9 | $162B |
|
||
| Insurance | 4 | $225B |
|
||
| Telecommunications | 2 | $144B |
|
||
| Pharmaceuticals | 2 | $112B |
|
||
| Media / Entertainment | 2 | $69B |
|
||
Price history
+58.6% since first listed7 events — show timeline
- 2026-06-14 Listed $34,900 UNYREIS
- 2026-03-13 Sold (MLS) $18,500 UNYREIS
- 2026-01-30 Pending — UNYREIS
- 2026-01-22 Price Changed $45,900 UNYREIS
- 2026-01-02 Listed $51,000 UNYREIS
- 2007-01-18 Sold (Public Records) $32,000 Public Records
- 2003-09-29 Sold (Public Records) $22,000 Public Records
Property tax history
+0.6%/yrLatest (2025): $1,095 · -0.4% YoY. Source: county tax records.
Cash-flow waterfall
monthlySold comps — $/sqft
last 12 mo · ≤1 miLoading sold comps…