393 Jessica Dr · Victoria, TX
Flood risk 3/10 · Minor
- FEMA flood zone
- X
- Chance of flooding over 30 yrs
- 0.2%
- Est. flood insurance / yr
- $507 – $1,088
Fire risk 7/10 · Major
- Est. fire insurance / yr
- $1,222 – $2,270
Heat risk 9/10 · Severe
- Hot days now (above 111°F)
- 7 days/yr
- Hot days in 30 yrs
- 20 days/yr
Wind risk 9/10 · Severe
- Chance of severe wind over 30 yrs
- 99.0%
Air-quality risk 1/10 · Minimal
- Unhealthy air days now
- 0 days/yr
- Unhealthy air days in 30 yrs
- 0 days/yr
Risk factors via First Street. Map © Google.
Why this score? — see what drove the C+ grade
The composite is a weighted blend of 9 inputs, each scored 0–100. Each bar is that input's sub-score; the figure is the points it added to the 100-point composite (weight × sub-score).
- Cash flow +28.4/30.0
- DSCR +10.0/10.0
- 1% rule +8.0/10.0
- ARV discount +7.5/15.0
- Livability +3.6/5.0
- Rent growth +2.5/5.0
- Schools +2.5/10.0
- Condition / age +2.5/5.0
- Appreciation +0.0/10.0
$129,000
🖨 Deal sheet (PDF) 📄 Offer letter ✓ Due diligence
Listing remarks
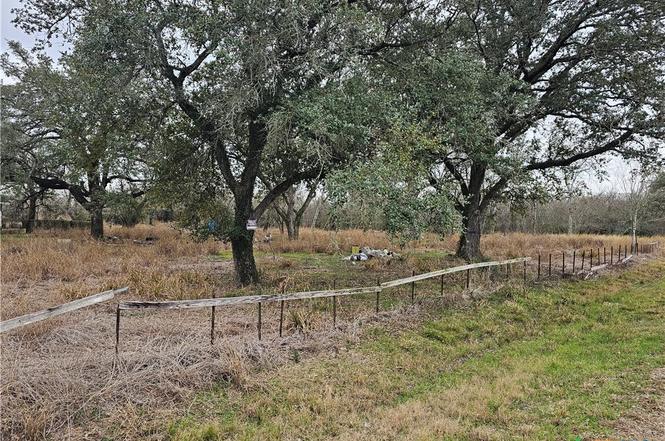
Discover the potential waiting at this 5-acre residential tract offers a rare opportunity for investors, builders, or buyers looking to create their dream property in a peaceful, partially wooded setting. The property features a 2,761 sq ft brick home ready for renovation or redevelopment. While the home is currently abandoned and in need of repairs, it presents a blank canvas full of possibilities — whether you're considering a full remodel, investment project, or starting fresh with new construction.
Key facts
- Brick home
- 5 acre lot
- Built 1960
Tags
Neighborhood map
What this means for you Summary
Snapshot
- This is a 3-bed/2.0-bath single-family listed at $129k.
Deal economics
- At list price, monthly cash flow is $419 ($5k/yr) — positive.
- The deal already cash-flows at list — no discount required.
- Meets the 1% rule at list price ($2k rent vs $129k).
- Recommended offer: $127k (1.5% below list) — sets the bar for market timing.
- Cap rate 10.2% vs local median 3.7% in Victoria — top-decile yield for the area; either an underpriced asset or a hidden risk that comps aren't pricing in. Stress-test before assuming the spread holds.
Location & tenants
- Location reads 71/100 on livability (#309 in TX) — a middle-class / working-renter tenant base. Strengths: cost of living A+, housing A+, health & safety A+; Watch: crime D+, amenities F, commute F.
- Victoria ISD (urban): math 24% / reading 33% proficiency, ranked #645 of 826 in TX (top 78%) — low school quality limits family demand, transient renter base, plan for 1-2y turnover.
- Zoned schools: Vickers El (math 54% / reading 58%, grade C+, #574 of 4,322 statewide, top 14%, 505 students, 50% FRL); Harold Cade Middle (math 39% / reading 45%, grade D-, #572 of 1,662 statewide, top 36%, 740 students, 47% FRL); Victoria West H S (math 18% / reading 39%, grade F, #1,157 of 1,632 statewide, top 72%, 1,766 students, 59% FRL).
- Zoned-school proficiency averages 42% at this address vs 28% district-wide (+14 pts) — the actual schools serving this property are materially stronger than the Victoria ISD average implies; a family-tenant draw the district grade alone would hide.
- Market conditions: 227 active listings in the ZIP; solid renter incomes; 43 units permitted in Victoria County in 2024 (0 in 5+ unit buildings).
Forward outlook
- Local home prices are declining (-3.0%/yr); year-one equity from $892 of loan paydown is wiped out by about $4k of value loss. Plan a longer hold.
- Victoria County population projected at +34% by 2050 — long-run rental-demand tailwind backs the buy-and-hold thesis.
- At projected returns (-3.0% appreciation + 3.0% rent growth), your $36k cash investment doubles in ~9 years — after that, you're playing with house money.
Negotiation context
- It's been on market 18 days — a 2% lower offer ($127k) is reasonable based on typical stale-listing flexibility.
- 3 sale attempts since 21y ago with the ask held roughly flat each time — persistent listings suggest the price (not the market) is what's stuck; bring a comps-based counter.
Risks & watch-outs
- Climate carrying-cost: severe wind risk, 99% chance of damaging wind over 30y; major wildfire risk; extreme-heat days projected 7→20/yr by 2055 (HVAC capex compounding) — expect insurance premiums to compound above CPI over the hold.
Questions for the listing agent
- Built in 1960 — when were the roof, HVAC, electrical panel, plumbing, and water heater last replaced?
- Is there a deadline driving the sale (1031 exchange, divorce, estate, relocation)? That informs how much negotiation room exists.
- Schools are D-rated, which usually means shorter tenancies and higher turnover. Who's the typical renter profile here, and what's been the actual vacancy rate?
- Crime grade is D in this area — have there been break-ins, vandalism, or insurance claims at this property in the last 3 years? What carrier currently insures it and at what premium?
- What's the average days-on-market for RENTAL listings here right now (not sales)? A rising rental-DOM trend means longer vacancies and softer asking-rent achievability than the comps imply.
- What's the recent tenant-quality profile in this submarket — average credit score on applications, eviction rate, late-payment / NSF rate, and stable-employment percentage? A property-management company in the area should have these aggregated.
- How much new for-sale + rental construction is in the pipeline within 1–3 miles? Heavy new supply typically softens prices + rents 12–24 months out; constrained supply supports both.
Investment metrics
- 1% rule
- 1.30% ✓
- Cap rate
- 10.19%
- Cash-on-cash
- 13.93%
- DSCR
- 1.62
- GRM
- 6.4
CMA / ARV
- ARV (on-the-fly)
- $623,986
- Comps found
- 2
Show comp detail 2 sales within ~0.75 mi
| Address | Dist | Beds/Ba | Sqft | Sold | Price | $/sf | Match |
|---|---|---|---|---|---|---|---|
| 135 Wellspring Blvd | 0.44mi | 4/3.0 (+1) | 2,573 (-7%) | 6mo | $520,000 | $202 | 54 |
| 546 Dayspring | 0.62mi | 3/2.5 | 2,547 (-8%) | 7mo | $575,000 | $226 | 50 |
Match score weights: distance 35% · size 25% · config 20% · recency 20%. Top-matched comps best support the ARV.
Projected returns pro-forma
-3.0% appreciation · 3.0% rent growth · sell at horizon
- IRR
- 4.2%
- Equity multiple
- 1.16×
- Total profit
- $5,834
- Equity at exit
- $19,234
- IRR
- 13.7%
- Equity multiple
- 2.10×
- Total profit
- $39,596
- Equity at exit
- $11,154
Cash invested: $36,120 (down + closing). Projections, not guarantees.
Landlord ↔ Tenant lean methodology
- Overall (STATE)
- 87 Strongly Landlord-Friendly
- State Texas
- 87 Strongly Landlord-Friendly · R+5
- County
- — inherits STATE
- City
- — inherits STATE
ZIP-level market 77904
- Home prices YoY
- -34.7%
- Active inventory
- 227
- Price-to-rent
- 6.4×
Monthly cashflow live
- Estimated rent
- $1,672 medium interval (Pro) →
- Mortgage (P&I)
- −$676
- Tax from tax record
- −$171 /mo · $2,054/yr
- Insurance
- −$54
- HOA
- −$0
- Vacancy / Maint / Mgmt
- −$351
- Net cashflow
- $419
Break-even live
Sensitivity live
| Price | -10% $492 | -5% $456 | +0% $419 | +5% $383 | +10% $346 |
|---|---|---|---|---|---|
| Rent | -10% $287 | -5% $353 | +0% $419 | +5% $485 | +10% $551 |
| Rate | -1.0pp $484 | -0.5pp $452 | base $419 | +0.5pp $386 | +1.0pp $352 |
UW: 25.0% down · 7.5% · 30yr · 1.5% tax · 5.0% vac · 8.0% maint · 8.0% mgmt
Financing live
Cash to close
- Down payment
- $32,250
- Closing costs
- $3,870
- Reserves months
- —
- Total cash needed
- —
Loan-product check · same deal, 3 products live
Conventional
25% down · 7.5% · 30yr
- Down + closing
- —
- Monthly P&I
- —
- Monthly cashflow
- —
- DSCR
- —
- Eligible?
- —
Personal DTI + credit; lowest rate.
DSCR
20% down · 8.5% · 30yr
- Down + closing
- —
- Monthly P&I
- —
- Monthly cashflow
- —
- DSCR
- —
- Eligible?
- —
No personal income docs; deal must DSCR.
Hard money
10% down · 12.0% · 12mo
- Down + closing
- —
- Monthly P&I
- —
- Monthly cashflow
- —
- DSCR
- —
- Eligible?
- —
Short-term bridge; refi at stabilization.
Listing history 7 events
-
2026-03-04status Pending
-
2026-02-20historical Active Under Contract
-
2026-02-16historical
-
2026-02-14$129,000 Active
-
2026-02-14$129,000 Active
-
2005-06-08soldstatus
-
2005-04-05$135,850
ⓘ Source: listings_history table (triggers on properties + properties_extension) + one-shot
backfill from property_details.listing_events for pre-trigger history.
Tax reassessment forecast TX · Resets to sale price
- Current annual tax
- $2,054 · $171/mo
- Projected year-2 tax
- $2,361 · $197/mo
- Expected delta
- +$307/yr (+$26/mo · 14.9%)
ⓘ Screening estimate from a state-policy table — verify with the county assessor before closing.
Climate risk First Street
- Flood 3/10 Moderate FEMA zone X · 20% chance over 30 yrs
- Wildfire 7/10 Severe
- Heat 9/10 Extreme 7 d/yr ≥111°F today · 20 d/yr by 30 yrs out
- Wind 9/10 Extreme 99% chance of damaging wind over 30 yrs
- Air quality 1/10 Low 0 unhealthy d/yr today · 0 by 30 yrs out
Nearby sold comps map
Loading sold comps map…
Walkable amenities ~0.75 mi
Loading nearby amenities…
Taxation est. · year 1
- Rental income
- $20,062
- − Mortgage interest
- −$7,226
- − Property taxes
- −$2,054
- − Insurance
- −$645
- − Repairs & maintenance
- −$1,605
- − Management
- −$1,605
- − Depreciation
- −$3,753
- Taxable income
- $3,174
- Est. tax owed @ 24.0%
- −$762
- After-tax cash flow
- $4,270/yr
For passive investors: Depreciation is non-cash, so a rental often shows a tax loss while cash-flowing — sheltering income. Rental losses are passive: they offset passive income freely, and up to $25,000/yr can offset ordinary (W-2) income if you actively participate and your MAGI is under $100k (phasing out to $0 by $150k); unused losses carry forward. On sale, claimed depreciation is recaptured at up to 25%, and gains may owe capital-gains tax (a 1031 exchange can defer both). Figures are a year-1 estimate at your 24.0% rate — not tax advice; consult a CPA.
Schools (NCES district)
- District
- Victoria ISD
- NCES district ID
- 4844150
- Math proficiency
- 24% ▼ -12.00%
- Reading proficiency
- 33% ▼ -2.00%
- Median HH income
- $50,534
- Composite
- 24.98/100
- National rank
- #7562
- State rank
- #645 of 826 in TX
Livability — Victoria
- Score
- 71/100
- State rank
- #309
- US rank
- #6960
Category grades
Schools grade is shown separately in the Schools card above.
Census & demographics
- County
- Victoria County · 69,915 people
- City population
- 69,915
- Metro
- Victoria, TX
- Population (ZIP)
- 30,061
- Household income
- $83,130
- Rent vs Own
- Severe rent burden
- 1133.0
Population outlook (Victoria County) Hauer SSP2
- Today (2025)
- 106,119 people
- By 2030
- 113,161 · +6.6%
- By 2040
- 127,402 · +20.1%
- By 2050
- 141,953 · +33.8%
- By 2075
- 179,410 · +69.1%
- By 2100
- 200,127 · +88.6%
Race, ethnicity, and origin ACS 2023
- Neighborhood character
- Diverse neighborhood (Simpson 0.56)
- Race & ethnicity
- White 56% Hispanic / Latino 35% Two or more races 20% Black 4% Asian 2%
- Hispanic origin (detail)
- Mexican 29%
- Common ancestry
- Lithuanian 2% Romanian 2% Serbian 1%
- Foreign-born
- 5% · Canada, Vietnam
- Languages at home
- 86% English-only · Spanish 12% Other Indo-European 1%
Political lean MEDSL · Victoria
- 2024 margin
- Solid R (+42.6) · D 28.4% · R 71.0%
- 2008→2024 swing
- -9.0pp toward R · 2008: -33.6pp · 2024: -42.6pp
- All cycles
- 2024: R+42.6 2020: R+38.0 2016: R+40.0 2012: R+37.8 2008: R+33.6
Not yet ingested
- Civics
- —
Market trends
- HPI YoY
- ▼ -75.51%
- Current HPI
- 142.2501
- Rent YoY
- —
- Metro
- Victoria, TX
- State GDP YoY
- ▲ 3.95%
- F500 in state
- 110
Industry mix (Fortune 500 HQ in TX)
| Industry | F500 HQs | Revenue |
|---|---|---|
| Energy | 16 | $1,198B |
|
||
| Technology | 5 | $198B |
|
||
| Engineering / Construction | 4 | $72B |
|
||
| Energy Services | 3 | $60B |
|
||
| Utilities | 3 | $41B |
|
||
| Healthcare | 2 | $330B |
|
||
Price history
-5.0% since first listed7 events — show timeline
- 2026-03-04 Pending — CTXMLS
- 2026-02-20 Contingent — CTXMLS
- 2026-02-16 Listing Removed — CTXMLS
- 2026-02-14 Listed $129,000 CTXMLS
- 2026-02-14 Listed $129,000 CTXMLS
- 2005-06-08 Sold (Public Records) — Public Records
- 2005-04-05 Listed $135,850 CTXMLS
Property tax history
-7.5%/yrLatest (2025): $2,054 · -31.0% YoY. Source: county tax records.
Cash-flow waterfall
monthlySold comps — $/sqft
last 12 mo · ≤1 miLoading sold comps…