 🏷️ Likely Rental
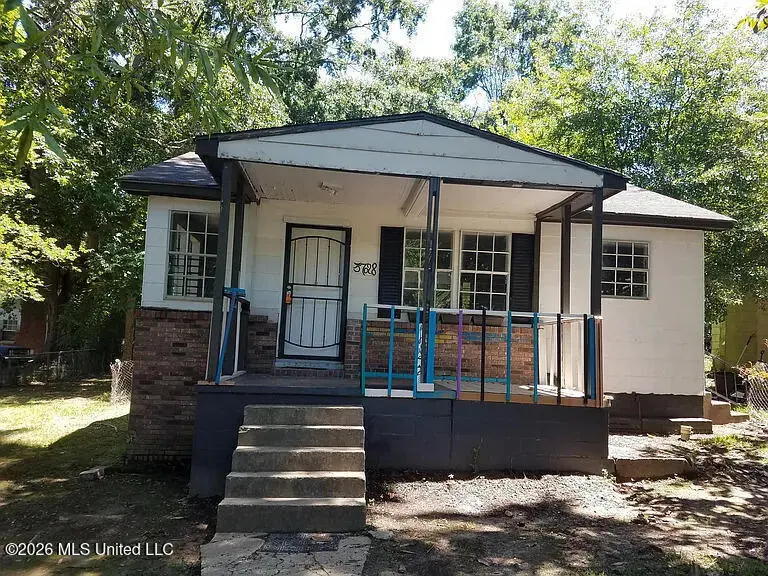
3728 Cromwell St · Jackson, MS
Flood risk 1/10 · Minimal
- FEMA flood zone
- X (unshaded)
- Chance of flooding over 30 yrs
- 0.0%
- Est. flood insurance / yr
- $507 – $1,088
Fire risk 1/10 · Minimal
- Est. fire insurance / yr
- $1,241 – $2,305
Heat risk 7/10 · Major
- Hot days now (above 109°F)
- 7 days/yr
- Hot days in 30 yrs
- 20 days/yr
Wind risk 8/10 · Major
- Chance of severe wind over 30 yrs
- 80.0%
Air-quality risk 1/10 · Minimal
- Unhealthy air days now
- 0 days/yr
- Unhealthy air days in 30 yrs
- 0 days/yr
Risk factors via First Street. Map © Google.
Why this score? — see what drove the C grade
The composite is a weighted blend of 9 inputs, each scored 0–100. Each bar is that input's sub-score; the figure is the points it added to the 100-point composite (weight × sub-score).
- Cash flow +15.0/30.0
- ARV discount +15.0/15.0
- Appreciation +10.0/10.0
- 1% rule +5.0/10.0
- DSCR +5.0/10.0
- Livability +3.4/5.0
- Rent growth +2.5/5.0
- Condition / age +2.5/5.0
- Schools +1.1/10.0
$19,500
🖨 Deal sheet (PDF) 📄 Offer letter ✓ Due diligence
Listing remarks
💰 Deal Snapshot Price: $19,500 Beds/Baths: 2/1 Size: ~699 sqft Your rent estimate: $870 Zillow rent estimate: ~$986/mo Section 8 potential: up to ~$1,200-$1,288 📊 Rent Reality Check (Important) Actual comps nearby: Similar homes rent for: $850-$1,050 in the zip Nearby property: ~$986 estimate for THIS house ~$999-$1,122 for similar nearby homes 👉 Your $870 estimate = conservative (safe) 👉 Realistic range: $900-$1,050 📈 Return Breakdown 💵 Scenario 1: Conservative ($900 rent) Annual rent: $10,800 Expenses (taxes, repairs, vacancy): ~$3,500 Net: ~$7,300 👉 Return: ~37% 🏆 Scenario 2: Section 8 (~$1,200) Annual rent: ~$14,400 Expenses similar
Key facts
- 7,405 sq ft lot
- Built 1942
- Listed 40 days
Neighborhood map
What this means for you Summary
Snapshot
- This is a 2-bed/1.0-bath single-family listed at $20k.
Deal economics
- At list price, monthly cash flow is $540 ($6k/yr) — positive.
- The deal already cash-flows at list — no discount required.
- Meets the 1% rule at list price ($869 rent vs $20k).
- Recommended offer: $19k (3.0% below list) — sets the bar for market timing.
- Cap rate 39.5% vs local median 9.9% in Jackson — top-decile yield for the area; either an underpriced asset or a hidden risk that comps aren't pricing in. Stress-test before assuming the spread holds.
Location & tenants
- Location reads 68/100 on livability (#66 in MS) — a middle-class / working-renter tenant base. Strengths: commute A+, cost of living A+, housing A+; Watch: amenities F, employment F, health & safety F.
- Jackson Public School District (urban): math 9% / reading 18% proficiency, ranked #112 of 130 in MS (top 86%) — low school quality limits family demand, transient renter base, plan for 1-2y turnover; 88% free/reduced lunch — lower-income household profile, screen leases tightly.
- Zoned schools: Dawson Elementary School (math 8% / reading 17%, grade F, #296 of 375 statewide, top 82%, 192 students, 100% FRL); Brinkley Middle School (math 8% / reading 8%, grade F, #165 of 179 statewide, top 93%, 354 students, 100% FRL); Lanier High School (math 3% / reading 2%, grade F, #197 of 197 statewide, top 100%, 603 students, 100% FRL).
- Market conditions: 81 active listings in the ZIP; 4 comparable units currently listed for rent nearby; rentals lingering (median 46d on market — plan ~5-8 weeks vacancy on turnover, expect pricing pressure); 50% of comp listings sitting > 30 days — soft ceiling on asking rent; lower-income renter base — watch delinquency; 167 units permitted in Hinds County in 2024 (0 in 5+ unit buildings).
- This rent runs 35% of the median local income ($30k/yr) — at the standard rent-burdened threshold; future hikes will face affordability resistance.
Forward outlook
- In year one you build about $2k of equity ($135 loan paydown + $2k appreciation (10.0% local appreciation)).
- Hinds County population projected to shrink 6% by 2050 — rents likely to lag national; underwrite the cash flow, not the appreciation.
- At projected returns (10.0% appreciation + 3.0% rent growth), your $5k cash investment doubles in ~1 year — after that, you're playing with house money.
Negotiation context
- It's been on market 40 days — a 3% lower offer ($19k) is reasonable based on typical stale-listing flexibility.
- 5 sale attempts since 18y ago with the ask held roughly flat each time — persistent listings suggest the price (not the market) is what's stuck; bring a comps-based counter.
Risks & watch-outs
- Watch-outs: built in 1942 — expect roof / HVAC / electrical / plumbing capex.
- Climate carrying-cost: severe wind risk, 80% chance of damaging wind over 30y; extreme-heat days projected 7→20/yr by 2055 (HVAC capex compounding) — expect insurance premiums to compound above CPI over the hold.
Questions for the listing agent
- It's been on market 40 days. Have you received any prior offers? Is the seller open to a 3% concession, seller financing, or rate buy-down credit?
- Built in 1942 — when were the roof, HVAC, electrical panel, plumbing, and water heater last replaced?
- Is there a deadline driving the sale (1031 exchange, divorce, estate, relocation)? That informs how much negotiation room exists.
- Schools are F-rated, which usually means shorter tenancies and higher turnover. Who's the typical renter profile here, and what's been the actual vacancy rate?
- What's the average days-on-market for RENTAL listings here right now (not sales)? A rising rental-DOM trend means longer vacancies and softer asking-rent achievability than the comps imply.
- What's the recent tenant-quality profile in this submarket — average credit score on applications, eviction rate, late-payment / NSF rate, and stable-employment percentage? A property-management company in the area should have these aggregated.
- How much new for-sale + rental construction is in the pipeline within 1–3 miles? Heavy new supply typically softens prices + rents 12–24 months out; constrained supply supports both.
Investment metrics
- 1% rule
- 4.46% ✓
- Cap rate
- 39.53%
- Cash-on-cash
- 118.70%
- DSCR
- 6.28
- GRM
- 1.9
CMA / ARV
- ARV (median comp)
- $38,427
- List price
- $19,500
- Delta
- -49.25%
- Verdict
- UNDERPRICED
- Comps
- 9 within 1.0 mi
Projected returns pro-forma
10.0% appreciation · 3.0% rent growth · sell at horizon
- IRR
- —
- Equity multiple
- 9.25×
- Total profit
- $45,038
- Equity at exit
- $17,567
- IRR
- —
- Equity multiple
- 20.34×
- Total profit
- $105,620
- Equity at exit
- $37,884
Cash invested: $5,460 (down + closing). Projections, not guarantees.
Landlord ↔ Tenant lean methodology
- Overall (STATE)
- 90 Strongly Landlord-Friendly
- State Mississippi
- 90 Strongly Landlord-Friendly · R+11
- County
- — inherits STATE
- City
- — inherits STATE
ZIP-level market 39213
- Home prices YoY
- 7.0%
- Active inventory
- 81
- Price-to-rent
- 1.9×
Monthly cashflow live
- Estimated rent
- $869 medium interval (Pro) →
- Mortgage (P&I)
- −$102
- Tax from tax record
- −$36 /mo · $432/yr
- Insurance
- −$8
- HOA
- −$0
- Vacancy / Maint / Mgmt
- −$182
- Net cashflow
- $540
Break-even live
Sensitivity live
| Price | -10% $551 | -5% $546 | +0% $540 | +5% $535 | +10% $529 |
|---|---|---|---|---|---|
| Rent | -10% $471 | -5% $506 | +0% $540 | +5% $574 | +10% $609 |
| Rate | -1.0pp $550 | -0.5pp $545 | base $540 | +0.5pp $535 | +1.0pp $530 |
UW: 25.0% down · 7.5% · 30yr · 1.5% tax · 5.0% vac · 8.0% maint · 8.0% mgmt
Financing live
Cash to close
- Down payment
- $4,875
- Closing costs
- $585
- Reserves months
- —
- Total cash needed
- —
Loan-product check · same deal, 3 products live
Conventional
25% down · 7.5% · 30yr
- Down + closing
- —
- Monthly P&I
- —
- Monthly cashflow
- —
- DSCR
- —
- Eligible?
- —
Personal DTI + credit; lowest rate.
DSCR
20% down · 8.5% · 30yr
- Down + closing
- —
- Monthly P&I
- —
- Monthly cashflow
- —
- DSCR
- —
- Eligible?
- —
No personal income docs; deal must DSCR.
Hard money
10% down · 12.0% · 12mo
- Down + closing
- —
- Monthly P&I
- —
- Monthly cashflow
- —
- DSCR
- —
- Eligible?
- —
Short-term bridge; refi at stabilization.
Rent comps 4 comps
| Address | Beds | Baths | Sqft | Rent | $/sqft | DOM | Units | Dist |
|---|---|---|---|---|---|---|---|---|
| 3380 Shady Oaks St Unit B Jackson, MS | 2.0 | 1.0 | 721 | $871 | $1.21 | 25d | 1 | 0.80mi |
| 3380 Shady Oaks St Unit D Jackson, MS | 2.0 | 1.0 | 721 | $832 | $1.15 | 46d | 1 | 0.80mi |
| 3380 Shady Oaks St Jackson, MS | 2.0 | 1.0 | 721 | $871 | $1.21 | 16d | 1 | 0.80mi |
| 1175 Eminence Row Jackson, MS | 2.0 | 1.0 | 700 | $650 | $0.93 | 46d | 1 | 1.16mi |
Listing history 18 events
-
2026-05-11status Pending
-
2026-04-01$19,500 Active
-
2022-07-01price $695
-
2021-10-02historical
-
2018-05-04soldstatus
-
2018-05-03soldstatus
-
2018-02-13$16,900
-
2018-02-02historical
-
2017-11-18$16,900
-
2014-10-15soldstatus
-
2012-01-10soldstatus
-
2012-01-05soldstatus
-
2010-08-23$13,800
-
2008-08-15soldstatus
-
2008-04-03$6,900
-
2004-01-27soldstatus
-
2001-08-08soldstatus
-
1970-06-11soldstatus
ⓘ Source: listings_history table (triggers on properties + properties_extension) + one-shot
backfill from property_details.listing_events for pre-trigger history.
Tax reassessment forecast MS · Resets to sale price
- Current annual tax
- $432 · $36/mo
- Projected year-2 tax
- $432 · $36/mo
- Expected delta
- $0/yr ($0/mo · 0.0%)
ⓘ Screening estimate from a state-policy table — verify with the county assessor before closing.
Climate risk First Street
- Flood 1/10 Low FEMA zone X (unshaded) · 0% chance over 30 yrs
- Wildfire 1/10 Low
- Heat 7/10 Severe 7 d/yr ≥109°F today · 20 d/yr by 30 yrs out
- Wind 8/10 Severe 80% chance of damaging wind over 30 yrs
- Air quality 1/10 Low 0 unhealthy d/yr today · 0 by 30 yrs out
Nearby sold comps map
Loading sold comps map…
Walkable amenities ~0.75 mi
Loading nearby amenities…
Taxation est. · year 1
- Rental income
- $10,427
- − Mortgage interest
- −$1,092
- − Property taxes
- −$432
- − Insurance
- −$98
- − Repairs & maintenance
- −$834
- − Management
- −$834
- − Depreciation
- −$567
- Taxable income
- $6,570
- Est. tax owed @ 24.0%
- −$1,577
- After-tax cash flow
- $4,904/yr
For passive investors: Depreciation is non-cash, so a rental often shows a tax loss while cash-flowing — sheltering income. Rental losses are passive: they offset passive income freely, and up to $25,000/yr can offset ordinary (W-2) income if you actively participate and your MAGI is under $100k (phasing out to $0 by $150k); unused losses carry forward. On sale, claimed depreciation is recaptured at up to 25%, and gains may owe capital-gains tax (a 1031 exchange can defer both). Figures are a year-1 estimate at your 24.0% rate — not tax advice; consult a CPA.
Schools (NCES district)
- District
- Jackson Public School District
- NCES district ID
- 2802190
- Math proficiency
- 9% ▼ -14.00%
- Reading proficiency
- 18% ▼ -7.00%
- Median HH income
- $33,234
- Composite
- 10.89/100
- National rank
- #9755
- State rank
- #112 of 130 in MS
Livability — Jackson
- Score
- 68/100
- State rank
- #66
- US rank
- #9695
Category grades
Schools grade is shown separately in the Schools card above.
Census & demographics
- Census place
- Jackson, MS
- County
- Hinds County · 167,040 people
- City population
- 140,204
- Metro
- Jackson, MS
- Population (ZIP)
- 18,691
- Household income
- $29,541
- Rent vs Own
- Severe rent burden
- 1138.0
Population outlook (Hinds County) Hauer SSP2
- Today (2025)
- 242,528 people
- By 2030
- 241,113 · -0.6%
- By 2040
- 235,557 · -2.9%
- By 2050
- 226,946 · -6.4%
- By 2075
- 199,995 · -17.5%
- By 2100
- 164,165 · -32.3%
Race, ethnicity, and origin ACS 2023
- Neighborhood character
- Predominantly Black (95%)
- Race & ethnicity
- Black 95% White 2% Two or more races 1% Hispanic / Latino 1%
- Foreign-born
- 0% · Canada
- Languages at home
- 98% English-only · Spanish 2%
Political lean MEDSL · Hinds
- 2024 margin
- Solid D (+46.1) · D 72.4% · R 26.3% · Other 1.4%
- 2008→2024 swing
- +7.1pp toward D · 2008: 39.0pp · 2024: 46.1pp
- All cycles
- 2024: D+46.1 2020: D+48.3 2016: D+43.7 2012: D+45.1 2008: D+39.0
Not yet ingested
- Civics
- —
Market trends
- HPI YoY
- ▲ 21.42%
- Current HPI
- 329.1844
- Rent YoY
- —
- Metro
- Jackson, MS
- State GDP YoY
- —
- F500 in state
- 0
Price history
+182.6% since first listed18 events — show timeline
- 2026-05-11 Pending — MLSU
- 2026-04-01 Listed $19,500 MLSU
- 2022-07-01 Price Changed $695 RENT.
- 2021-10-02 Listing Removed — MLSU
- 2018-05-04 Sold (MLS) — MLSU
- 2018-05-03 Sold (Public Records) — Public Records
- 2018-02-13 Listed $16,900 MLSU
- 2018-02-02 Listing Removed — MLSU
- 2017-11-18 Listed $16,900 MLSU
- 2014-10-15 Sold (Public Records) — Public Records
- 2012-01-10 Sold (MLS) — MLSU
- 2012-01-05 Sold (Public Records) — Public Records
- 2010-08-23 Listed $13,800 MLSU
- 2008-08-15 Sold (Public Records) — Public Records
- 2008-04-03 Listed $6,900 MLSU
- 2004-01-27 Sold (Public Records) — Public Records
- 2001-08-08 Sold (Public Records) — Public Records
- 1970-06-11 Sold (Public Records) — Public Records
Property tax history
+0.9%/yrLatest (2025): $432 · +0.0% YoY. Source: county tax records.
Cash-flow waterfall
monthlySold comps — $/sqft
last 12 mo · ≤1 miLoading sold comps…