6650 Amherst Unit 18c · San Diego, CA
Flood risk 8/10 · Major
- FEMA flood zone
- X (unshaded)
- Chance of flooding over 30 yrs
- 0.78%
- Est. flood insurance / yr
- $507 – $1,088
Fire risk 1/10 · Minimal
- Est. fire insurance / yr
- $659 – $1,223
Heat risk 4/10 · Minor
- Hot days now (above 91°F)
- 7 days/yr
- Hot days in 30 yrs
- 19 days/yr
Wind risk 1/10 · Minimal
- Chance of severe wind over 30 yrs
- —
Air-quality risk 3/10 · Minor
- Unhealthy air days now
- 4 days/yr
- Unhealthy air days in 30 yrs
- 4 days/yr
Risk factors via First Street. Map © Google.
Why this score? — see what drove the D grade
The composite is a weighted blend of 9 inputs, each scored 0–100. Each bar is that input's sub-score; the figure is the points it added to the 100-point composite (weight × sub-score).
- Cash flow +13.3/30.0
- ARV discount +7.5/15.0
- 1% rule +4.1/10.0
- DSCR +4.0/10.0
- Livability +3.8/5.0
- Rent growth +3.4/5.0
- Condition / age +2.5/5.0
- Schools +2.2/10.0
- Appreciation +0.0/10.0
$235,000
🖨 Deal sheet 📄 Offer letter ✓ Due diligence
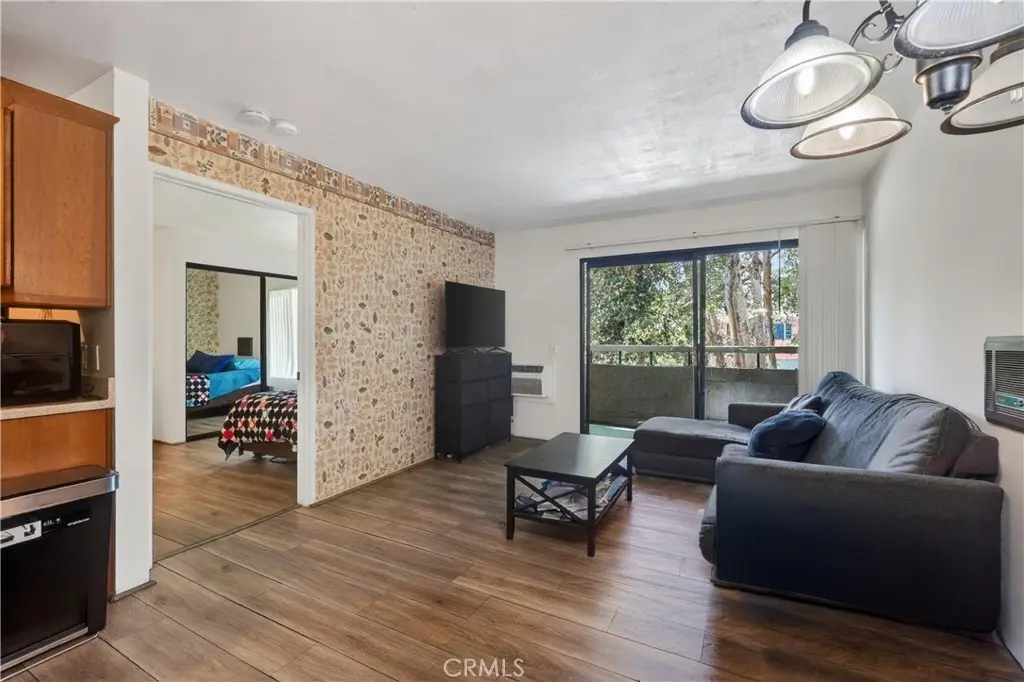
Listing remarks MLS
SENIOR CONDO COMPLEX- ONE OCCUPANT MUST BE 62 > YEARS OLD. PRIVATE BALCONY, SECURE & QUIET, NEAR COLLEGE, SHOPS & SERVICES, BUS, TROLLEY. NEW BERBER CARPET & VINYL. MIRRORED CLOSETS DOORS, FRESH PAINT. LOW MONTHLY HOA FEE. AFFORDABLE HOUSING OPPORTUNITY FOR RETIREE ON A FIXED INCOME. THIS UNIT IS MOVE-IN READY!
Key facts
- La mesa village
- Downtown san diego
- Mission valley
Tags
Property features AI
Finance
- Other: Community of 51 total units
- Financial info: Special assessments
- HOA & community: Part of Amherst Spring association; Monthly association fee of $285; Association covers water, sewer and trash; Senior community; Community features: street lighting, sidewalks, urban setting
Exterior
- Parking: Unassigned parking
- Utilities: 220V electric; Public/district water; Public sewer
- Home design: House-style condominium; Attached property; Single-story; Entry level: 2
- Construction: Year built (per assessor); 1 common wall
- Exterior features: Patio; No pool; No fencing; Has view; Condominium community (51 units)
Interior
- Kitchen: Electric range
- Bedrooms: Main floor bedroom (1 on main level)
- Flooring: Laminated
- Bathrooms: 1 full bathroom with bathtub
- Heating & cooling: Wall/window cooling
- Interior features: Elevator; One level
- Laundry & utility: Community laundry
Neighborhood map
What this means for you Summary
Snapshot
- This is a 1-bed/1.0-bath condo listed at $235k.
Deal economics
- At list price, monthly cash flow is $-68 ($-814/yr) — negative.
- To cash-flow at today's rent, offer at most $223k (5.1% below list).
- To meet the 1% rule (rent ≥ 1% of price), the offer needs to be $213k (9.3% below list).
- Recommended offer: $213k (9.3% below list) — sets the bar for 1% rule.
- Cap rate 6.3% vs local median 2.0% in San Diego — top-decile yield for the area; either an underpriced asset or a hidden risk that comps aren't pricing in. Stress-test before assuming the spread holds.
Location & tenants
- Location reads 75/100 on livability (#123 in CA, #4,206 nationally) — a middle-class / working-renter tenant base. Strengths: amenities A+, commute A+, employment A+; Watch: health & safety C-, crime D+, cost of living F.
- San Diego Unified (urban): math 19% / reading 29% proficiency, ranked #393 of 517 in CA (top 76%) — low school quality limits family demand, transient renter base, plan for 1-2y turnover.
- Market conditions: Rents rising (+3.7%/yr); 181 active listings in the ZIP; 3 comparable units currently listed for rent nearby; rentals leasing fast (median 8d on market — plan ~1-2 weeks tenant-placement turnaround); solid renter incomes; 11,759 units permitted in San Diego County in 2024 (7,244 in 5+ unit buildings).
- This rent runs 32% of the median local income ($79k/yr) — at the standard rent-burdened threshold; future hikes will face affordability resistance.
Forward outlook
- Local home prices are declining (-3.0%/yr); year-one equity from $2k of loan paydown is wiped out by about $7k of value loss. Plan a longer hold.
- San Diego County population projected at +20% by 2050 — long-run rental-demand tailwind backs the buy-and-hold thesis.
Negotiation context
- It's been on market 22 days — a 2% lower offer ($231k) is reasonable based on typical stale-listing flexibility.
- 3 sale attempts since 26y ago with the ask held roughly flat each time — persistent listings suggest the price (not the market) is what's stuck; bring a comps-based counter.
- Current owner paid $136k; list at $235k implies a 73% gain — meaningful room to come down on a strong offer.
Risks & watch-outs
- Watch-outs: flood insurance adds $66/mo.
- Climate carrying-cost: severe flood risk — expect insurance premiums to compound above CPI over the hold.
Questions for the listing agent
- What do current leases actually rent for vs. the listed asking? Can we see a recent rent roll and the last 12 months of T-12 income?
- What's the actual annual flood-insurance premium (NFIP or private), and is the property in a SFHA with mandatory coverage?
- What does the HOA fee cover, when was the last increase, and are there any pending special assessments or reserve-fund shortfalls?
- Any open or pending special assessments — roof, HVAC, plumbing, elevator, façade? What's the per-unit balance and payoff schedule, and is the seller paying it off at close or rolling it to the buyer?
- Is there a deadline driving the sale (1031 exchange, divorce, estate, relocation)? That informs how much negotiation room exists.
- Schools are B-rated — typically a magnet for longer-tenancy family renters. What's the average tenant stay here, and is there a school-zone premium baked into asking?
- Crime grade is D in this area — have there been break-ins, vandalism, or insurance claims at this property in the last 3 years? What carrier currently insures it and at what premium?
- The area grade is low — what's the realistic commute time and amenity access for the typical tenant pool here? Any planned neighborhood developments (good or bad) we should know about?
- What's the average days-on-market for RENTAL listings here right now (not sales)? A rising rental-DOM trend means longer vacancies and softer asking-rent achievability than the comps imply.
- What's the recent tenant-quality profile in this submarket — average credit score on applications, eviction rate, late-payment / NSF rate, and stable-employment percentage? A property-management company in the area should have these aggregated.
- How much new apartment / multifamily construction is in the pipeline within 1–3 miles? Heavy new supply (>2% of stock underway) typically softens rents 12–24 months out; light construction supports rent growth.
Investment metrics
- 1% rule
- 0.91% ✗
- Cap rate
- 6.29%
- Cash-on-cash
- -0.03%
- DSCR
- 1.00
- GRM
- 9.2
CMA / ARV
No comps found within radius.
Projected returns pro-forma
-3.0% appreciation · 3.74% rent growth · sell at horizon
- IRR
- -17.4%
- Equity multiple
- 0.38×
- Total profit
- $-40,692
- Equity at exit
- $35,039
- IRR
- -7.9%
- Equity multiple
- 0.48×
- Total profit
- $-33,889
- Equity at exit
- $20,319
Cash invested: $65,800 (down + closing). Projections, not guarantees.
Landlord ↔ Tenant lean methodology
- Overall (STATE)
- 18 Strongly Tenant-Friendly
- State California
- 18 Strongly Tenant-Friendly · D+13
- County
- — inherits STATE
- City
- — inherits STATE
ZIP-level market 92115
- Rents YoY
- 3.7%
- Active inventory
- 181
- Price-to-rent
- 9.2×
Monthly cashflow live
- Estimated rent
- $2,131 medium interval (Pro) →
- Mortgage (P&I)
- −$1,232
- Tax from tax record
- −$70 /mo · $839/yr
- Insurance
- −$98
- Flood insurance flood zone
- −$66 /mo · $798/yr
- HOA
- −$285
- Vacancy / Maint / Mgmt
- −$448
- Net cashflow
- $-68
Break-even live
UW: 25.0% down · 7.5% · 30yr · 1.5% tax · 5.0% vac · 8.0% maint · 8.0% mgmt
Financing live
Cash to close
- Down payment
- $58,750
- Closing costs
- $7,050
- Reserves months
- —
- Total cash needed
- —
Loan-product check · same deal, 3 products live
Conventional
25% down · 7.5% · 30yr
- Down + closing
- —
- Monthly P&I
- —
- Monthly cashflow
- —
- DSCR
- —
- Eligible?
- —
Personal DTI + credit; lowest rate.
DSCR
20% down · 8.5% · 30yr
- Down + closing
- —
- Monthly P&I
- —
- Monthly cashflow
- —
- DSCR
- —
- Eligible?
- —
No personal income docs; deal must DSCR.
Hard money
10% down · 12.0% · 12mo
- Down + closing
- —
- Monthly P&I
- —
- Monthly cashflow
- —
- DSCR
- —
- Eligible?
- —
Short-term bridge; refi at stabilization.
Rent comps 3 comps
| Address | Beds | Baths | Sqft | Rent | $/sqft | DOM | Units | Dist |
|---|---|---|---|---|---|---|---|---|
| 6440 El Cajon Blvd San Diego, CA | 3.0 | 1.0 | 580 | $2,358 | $4.07 | 1d | 13 | 0.32mi |
| 4546 60th St San Diego, CA | — | 1.0 | 340 | $1,695 | $4.99 | 21d | 1 | 0.94mi |
| 5615 El Cajon Blvd San Diego, CA | — | 1.0 | 350 | $1,475 | $4.21 | 7d | 1 | 1.29mi |
HOA detail condo
- Monthly dues
- $285 · $3,420/yr
- Assessments
- None detected in remarks — confirm with the listing agent.
Listing history 22 events
-
2026-06-18days on market $235,000 Active 22 DOM
-
2026-06-17days on market $235,000 Active 21 DOM
-
2026-06-16days on market $235,000 Active 20 DOM
-
2026-06-15days on market $235,000 Active 19 DOM
-
2026-06-13days on market $235,000 Active 17 DOM
-
2026-06-09days on market $235,000 Active 13 DOM
-
2026-06-08days on market $235,000 Active 12 DOM
-
2026-06-07days on market $235,000 Active 11 DOM
-
2026-06-04days on market $235,000 Active 8 DOM
-
2026-06-03days on market $235,000 Active 7 DOM
-
2026-06-02days on market $235,000 Active 6 DOM
-
2026-06-01days on market $235,000 Active 5 DOM
-
2026-05-31days on market $235,000 Active 4 DOM
-
2026-05-27$235,000 Active
-
2004-08-18soldstatus $136,000 333-char remark
Show marketing remark (333 chars)
SENIOR CONDO COMPLEX- ONE OCCUPANT MUST BE 62 > YEARS OLD. PRIVATE BALCONY, SECURE & QUIET, NEAR COLLEGE, SHOPS & SERVICES, BUS, TROLLEY. NEW BERBER CARPET & VINYL. MIRRORED CLOSETS DOORS, FRESH PAINT. LOW MONTHLY HOA FEE. AFFORDABLE HOUSING OPPORTUNITY FOR RETIREE ON A FIXED INCOME. THIS UNIT IS MOVE-IN READY!
-
2004-08-18soldstatus $136,000
Show marketing remark (333 chars)
SENIOR CONDO COMPLEX- ONE OCCUPANT MUST BE 62 > YEARS OLD. PRIVATE BALCONY, SECURE & QUIET, NEAR COLLEGE, SHOPS & SERVICES, BUS, TROLLEY. NEW BERBER CARPET & VINYL. MIRRORED CLOSETS DOORS, FRESH PAINT. LOW MONTHLY HOA FEE. AFFORDABLE HOUSING OPPORTUNITY FOR RETIREE ON A FIXED INCOME. THIS UNIT IS MOVE-IN READY!
-
2004-06-28$144,900 333-char remark
Show marketing remark (333 chars)
SENIOR CONDO COMPLEX- ONE OCCUPANT MUST BE 62 > YEARS OLD. PRIVATE BALCONY, SECURE & QUIET, NEAR COLLEGE, SHOPS & SERVICES, BUS, TROLLEY. NEW BERBER CARPET & VINYL. MIRRORED CLOSETS DOORS, FRESH PAINT. LOW MONTHLY HOA FEE. AFFORDABLE HOUSING OPPORTUNITY FOR RETIREE ON A FIXED INCOME. THIS UNIT IS MOVE-IN READY!
-
2004-04-23soldstatus $200,000
-
2001-02-05soldstatus $40,000 186-char remark
Show marketing remark (186 chars)
TENANT OCCUPIED UNIT IN A SENIOR AGE RESTRICTED BUILDING (62+) * * SQFT, ZONING, PER ASSESSOR RECORDS * * BUYER TO VERIFY & BUYER TO BE PRE-QUALIFIED * * CALL TENANT TO SHOW.
-
2001-02-02soldstatus $42,000
-
2000-07-27$40,000 186-char remark
Show marketing remark (186 chars)
TENANT OCCUPIED UNIT IN A SENIOR AGE RESTRICTED BUILDING (62+) * * SQFT, ZONING, PER ASSESSOR RECORDS * * BUYER TO VERIFY & BUYER TO BE PRE-QUALIFIED * * CALL TENANT TO SHOW.
-
1990-05-04soldstatus $50,000
ⓘ Source: listings_history table (triggers on properties + properties_extension) + one-shot
backfill from property_details.listing_events for pre-trigger history.
Tax reassessment forecast CA · Resets to sale price
- Current annual tax
- $839 · $70/mo
- Projected year-2 tax
- $1,786 · $149/mo
- Expected delta
- +$947/yr (+$79/mo · 112.9%)
ⓘ Screening estimate from a state-policy table — verify with the county assessor before closing.
Climate risk First Street
- Flood 8/10 Severe FEMA zone X (unshaded) · 78% chance over 30 yrs
- Wildfire 1/10 Low
- Heat 4/10 Moderate 7 d/yr ≥91°F today · 19 d/yr by 30 yrs out
- Wind 1/10 Low
- Air quality 3/10 Moderate 4 unhealthy d/yr today · 4 by 30 yrs out
Nearby sold comps map
Loading sold comps map…
Walkable amenities ~0.75 mi
Loading nearby amenities…
Taxation est. · year 1
- Rental income
- $25,577
- − Mortgage interest
- −$13,164
- − Property taxes
- −$839
- − Insurance
- −$1,972
- − Repairs & maintenance
- −$2,046
- − Management
- −$2,046
- − HOA
- −$3,420
- − Depreciation
- −$6,836
- Taxable loss
- −$4,747
- Est. tax savings @ 24.0%
- +$1,139
- After-tax cash flow
- $325/yr
For passive investors: Depreciation is non-cash, so a rental often shows a tax loss while cash-flowing — sheltering income. Rental losses are passive: they offset passive income freely, and up to $25,000/yr can offset ordinary (W-2) income if you actively participate and your MAGI is under $100k (phasing out to $0 by $150k); unused losses carry forward. On sale, claimed depreciation is recaptured at up to 25%, and gains may owe capital-gains tax (a 1031 exchange can defer both). Figures are a year-1 estimate at your 24.0% rate — not tax advice; consult a CPA.
Schools (NCES district)
- District
- San Diego Unified
- NCES district ID
- 0634320
- Math proficiency
- 19% ▼ -29.00%
- Reading proficiency
- 29% ▼ -28.00%
- Median HH income
- $61,673
- Composite
- 22.31/100
- National rank
- #8135
- State rank
- #393 of 517 in CA
Livability — San Diego
- Score
- 75/100
- State rank
- #123
- US rank
- #4206
Category grades
Schools grade is shown separately in the Schools card above.
Census & demographics
- Census place
- San Diego, CA
- County
- San Diego County · 3,178,799 people
- City population
- 1,397,612
- Metro
- San Diego-Chula Vista-Carlsbad, CA
- Population (ZIP)
- 66,264
- Household income
- $79,199
- Rent vs Own
- Severe rent burden
- 4584.0
Population outlook (San Diego County) Hauer SSP2
- Today (2025)
- 3,678,185 people
- By 2030
- 3,856,546 · +4.8%
- By 2040
- 4,171,407 · +13.4%
- By 2050
- 4,421,607 · +20.2%
- By 2075
- 4,831,599 · +31.4%
- By 2100
- 4,832,502 · +31.4%
Race, ethnicity, and origin ACS 2023
- Neighborhood character
- Highly diverse neighborhood (Simpson 0.72)
- Race & ethnicity
- White 40% Hispanic / Latino 30% Two or more races 15% Asian 13% Black 10%
- Hispanic origin (detail)
- Mexican 26% Puerto Rican 1%
- Common ancestry
- Italian 2% Slovak 1% Romanian 1%
- Foreign-born
- 19% · Canada, Vietnam, China
- Languages at home
- 65% English-only · Spanish 21% Vietnamese 4% Other Asian/Pacific 3%
Political lean MEDSL · San Diego
- 2024 margin
- D (+16.8) · D 56.9% · R 40.1% · Other 2.9%
- 2008→2024 swing
- +6.6pp toward D · 2008: 10.2pp · 2024: 16.8pp
- All cycles
- 2024: D+16.8 2020: D+22.8 2016: D+17.8 2012: D+5.1 2008: D+10.2
Not yet ingested
- Civics
- —
Market trends
- HPI YoY
- ▼ -973.18%
- Current HPI
- 427.2256
- Rent YoY
- ▲ 3.74%
- Metro
- San Diego-Chula Vista-Carlsbad, CA
- State GDP YoY
- ▲ 3.21%
- F500 in state
- 116
Industry mix (Fortune 500 HQ in CA)
| Industry | F500 HQs | Revenue |
|---|---|---|
| Technology | 27 | $1,492B |
|
||
| Financial Services | 3 | $174B |
|
||
| Retail | 3 | $44B |
|
||
| Insurance | 3 | $26B |
|
||
| Media / Entertainment | 2 | $115B |
|
||
| Pharmaceuticals / Biotech | 2 | $62B |
|
||
Price history
+370.0% since first listed9 events — show timeline
- 2026-05-27 Listed $235,000 CRMLS
- 2004-08-18 Sold (Public Records) $136,000 Public Records
- 2004-08-18 Sold (MLS) $136,000 CRMLS
- 2004-06-28 Listed $144,900 CRMLS
- 2004-04-23 Sold (Public Records) $200,000 Public Records
- 2001-02-05 Sold (MLS) $40,000 CRMLS
- 2001-02-02 Sold (Public Records) $42,000 Public Records
- 2000-07-27 Listed $40,000 CRMLS
- 1990-05-04 Sold (Public Records) $50,000 Public Records
Property tax history
+3.1%/yrLatest (2025): $839 · +4.1% YoY. Source: county tax records.
Cash-flow waterfall
monthlySold comps — $/sqft
last 12 mo · ≤1 miLoading sold comps…