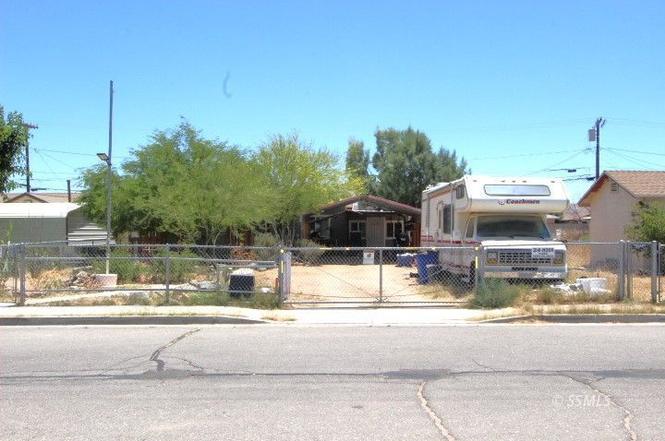
309 W Haloid Ave · Ridgecrest, CA
Flood risk 1/10 · Minimal
- FEMA flood zone
- X (unshaded)
- Chance of flooding over 30 yrs
- 0.0%
- Est. flood insurance / yr
- $507 – $1,088
Fire risk 4/10 · Minor
- Est. fire insurance / yr
- $659 – $1,223
Heat risk 8/10 · Major
- Hot days now (above 105°F)
- 7 days/yr
- Hot days in 30 yrs
- 20 days/yr
Wind risk 1/10 · Minimal
- Chance of severe wind over 30 yrs
- —
Air-quality risk 7/10 · Major
- Unhealthy air days now
- 14 days/yr
- Unhealthy air days in 30 yrs
- 15 days/yr
Risk factors via First Street. Map © Google.
Why this score? — see what drove the B- grade
The composite is a weighted blend of 9 inputs, each scored 0–100. Each bar is that input's sub-score; the figure is the points it added to the 100-point composite (weight × sub-score).
- Cash flow +30.0/30.0
- 1% rule +10.0/10.0
- DSCR +10.0/10.0
- ARV discount +7.5/15.0
- Livability +3.5/5.0
- Rent growth +3.4/5.0
- Schools +2.9/10.0
- Condition / age +1.0/5.0
- Appreciation +0.0/10.0
$90,000
🖨 Deal sheet 📄 Offer letter ✓ Due diligence
Listing remarks
Opportunity awaits at this property! This 3-bedroom, 2-bathroom property offers plenty of potential for an investor or buyer looking to create their own vision. Fully fenced lot and landscaping, covered parking, storage, and a covered backyard patio area. The interior features vinyl flooring, granite countertops, barn-style door, mini-split systems and Tin roof. The RV currently on the property will be included in the sale! Seller left personal property in home and will be included in the sale with no additional cost. Property is being sold strictly AS-IS and will require repairs and updating. Cash offers are preferred due to the condition of the property.
Key facts
- Vinyl flooring
- Covered parking
- Storage
Tags
Property features AI
Finance
- HOA & community: Curbs; Sidewalks
Exterior
- Utilities: Natural gas connected; Sewer connected
- Home design: Single-family residence; Residential property; Zoned R-3
- Construction: Stucco exterior; Metal roof; Slab foundation
- Exterior features: Patio; Fenced yard; Landscaped lot; Shed(s)
Interior
- Kitchen: Dishwasher; Disposal; Microwave; Range / Oven; Refrigerator
- Flooring: Vinyl
- Bathrooms: 2 full bathrooms
- Heating & cooling: Natural gas heating; Evaporative cooling
- Interior features: Dishwasher; Disposal; Microwave; Range / Oven; Refrigerator; Gas water heater; Washer and dryer included; Vinyl flooring
- Laundry & utility: Washer and dryer included
Neighborhood map
What this means for you Summary
Snapshot
- This is a 3-bed/2.0-bath single-family listed at $90k. Condition is rated poor.
Deal economics
- At list price, monthly cash flow is $452 ($5k/yr) — positive.
- The deal already cash-flows at list — no discount required.
- Meets the 1% rule at list price ($1k rent vs $90k).
- Cap rate 12.3% vs local median 4.0% in Ridgecrest — top-decile yield for the area; either an underpriced asset or a hidden risk that comps aren't pricing in. Stress-test before assuming the spread holds.
Location & tenants
- Location reads 70/100 on livability (#243 in CA) — a middle-class / working-renter tenant base. Strengths: commute A+, housing A+; Watch: schools C-, amenities D+, cost of living D+.
- Sierra Sands Unified (town): math 25% / reading 39% proficiency, ranked #294 of 517 in CA (top 57%) — families likely to look elsewhere, expect single-tenant / working-renter base with shorter leases.
- Market conditions: Rents rising (+3.6%/yr); 328 active listings in the ZIP; 40 comparable units currently listed for rent nearby; rentals leasing fast (median 3d on market — plan ~1-2 weeks tenant-placement turnaround); solid renter incomes; 3,244 units permitted in Kern County in 2024 (73 in 5+ unit buildings).
Forward outlook
- Local home prices are declining (-3.0%/yr); year-one equity from $622 of loan paydown is wiped out by about $3k of value loss. Plan a longer hold.
- Kern County population projected at +17% by 2050 — long-run rental-demand tailwind backs the buy-and-hold thesis.
- At projected returns (-3.0% appreciation + 3.6% rent growth), your $25k cash investment doubles in ~6 years — after that, you're playing with house money.
Negotiation context
- Only 1 days on market — expect competitive offers; lowballing is unlikely to land.
Risks & watch-outs
- Watch-outs: built in 1948 — expect roof / HVAC / electrical / plumbing capex.
- Climate carrying-cost: extreme-heat days projected 7→20/yr by 2055 (HVAC capex compounding) — expect insurance premiums to compound above CPI over the hold.
Questions for the listing agent
- Have any recent inspections been done? Can we get a copy of the seller's disclosures and any deferred-maintenance estimates?
- Built in 1948 — when were the roof, HVAC, electrical panel, plumbing, and water heater last replaced?
- Is there a deadline driving the sale (1031 exchange, divorce, estate, relocation)? That informs how much negotiation room exists.
- Crime grade is F in this area — have there been break-ins, vandalism, or insurance claims at this property in the last 3 years? What carrier currently insures it and at what premium?
- What's the average days-on-market for RENTAL listings here right now (not sales)? A rising rental-DOM trend means longer vacancies and softer asking-rent achievability than the comps imply.
- What's the recent tenant-quality profile in this submarket — average credit score on applications, eviction rate, late-payment / NSF rate, and stable-employment percentage? A property-management company in the area should have these aggregated.
- How much new for-sale + rental construction is in the pipeline within 1–3 miles? Heavy new supply typically softens prices + rents 12–24 months out; constrained supply supports both.
Investment metrics
- 1% rule
- 1.51% ✓
- Cap rate
- 12.32%
- Cash-on-cash
- 21.52%
- DSCR
- 1.96
- GRM
- 5.5
CMA / ARV
- ARV (on-the-fly)
- $213,836
- Comps found
- 12
Show comp detail 12 sales within ~0.75 mi
| Address | Dist | Beds/Ba | Sqft | Sold | Price | $/sf | Match |
|---|---|---|---|---|---|---|---|
| 238 W Church Ave | 0.23mi | 3/1.0 | 998 (-8%) | 8mo | $75,000 | $75 | 65 |
| 612 Heather Ct | 0.53mi | 3/2.0 | 1,204 (+10%) | 2mo | $245,000 | $203 | 57 |
| 429 W Church Ave | 0.25mi | 2/1.5 (-1) | 946 (-13%) | 5mo | $154,400 | $163 | 55 |
| 805 Victoria Ct | 0.67mi | 3/2.0 | 1,170 (+7%) | 4mo | $244,000 | $209 | 54 |
| 224 N Florence St | 0.61mi | 3/2.0 | 1,005 (-8%) | 8mo | $250,000 | $249 | 52 |
| 225 N Alvord St | 0.63mi | 3/2.0 | 1,210 (+11%) | 4mo | $227,250 | $188 | 49 |
| 417 Argus Ave | 0.71mi | 3/2.0 | 1,017 (-7%) | 8mo | $172,500 | $170 | 49 |
| 221 N Florence St | 0.61mi | 3/2.0 | 1,239 (+14%) | 2mo | $200,000 | $161 | 47 |
| 241 W French Ave | 0.61mi | 3/2.0 | 960 (-12%) | 5mo | $209,000 | $218 | 47 |
| 801 S Sunset St | 0.56mi | 3/1.0 | 936 (-14%) | 6mo | $229,000 | $245 | 41 |
| 233 N Alvord St | 0.65mi | 3/1.0 | 960 (-12%) | 7mo | $188,500 | $196 | 40 |
| 304 N Helena St | 0.74mi | 3/1.0 | 960 (-12%) | 3mo | $175,000 | $182 | 39 |
Match score weights: distance 35% · size 25% · config 20% · recency 20%. Top-matched comps best support the ARV.
Projected returns pro-forma
-3.0% appreciation · 3.58% rent growth · sell at horizon
- IRR
- 14.8%
- Equity multiple
- 1.60×
- Total profit
- $15,017
- Equity at exit
- $13,419
- IRR
- 23.9%
- Equity multiple
- 3.12×
- Total profit
- $53,534
- Equity at exit
- $7,782
Cash invested: $25,200 (down + closing). Projections, not guarantees.
Landlord ↔ Tenant lean methodology
- Overall (STATE)
- 18 Strongly Tenant-Friendly
- State California
- 18 Strongly Tenant-Friendly · D+13
- County
- — inherits STATE
- City
- — inherits STATE
ZIP-level market 93555
- Home prices YoY
- -24.0%
- Rents YoY
- 3.6%
- Active inventory
- 328
- Price-to-rent
- 5.5×
Monthly cashflow live
- Estimated rent
- $1,359 high interval (Pro) →
- Mortgage (P&I)
- −$472
- Tax est. 1.5%
- −$112 /mo · $1,350/yr
- Insurance
- −$38
- HOA
- −$0
- Vacancy / Maint / Mgmt
- −$285
- Net cashflow
- $452
Break-even live
UW: 25.0% down · 7.5% · 30yr · 1.5% tax · 5.0% vac · 8.0% maint · 8.0% mgmt
Financing live
Cash to close
- Down payment
- $22,500
- Closing costs
- $2,700
- Reserves months
- —
- Total cash needed
- —
Loan-product check · same deal, 3 products live
Conventional
25% down · 7.5% · 30yr
- Down + closing
- —
- Monthly P&I
- —
- Monthly cashflow
- —
- DSCR
- —
- Eligible?
- —
Personal DTI + credit; lowest rate.
DSCR
20% down · 8.5% · 30yr
- Down + closing
- —
- Monthly P&I
- —
- Monthly cashflow
- —
- DSCR
- —
- Eligible?
- —
No personal income docs; deal must DSCR.
Hard money
10% down · 12.0% · 12mo
- Down + closing
- —
- Monthly P&I
- —
- Monthly cashflow
- —
- DSCR
- —
- Eligible?
- —
Short-term bridge; refi at stabilization.
Rent comps 40 comps
| Address | Beds | Baths | Sqft | Rent | $/sqft | DOM | Units | Dist |
|---|---|---|---|---|---|---|---|---|
| 327 W Haloid Ave Ridgecrest, CA | 2.0 | 1.5 | 800 | $1,100 | $1.38 | 2d | 1 | 0.06mi |
| 308 W Wilson Ave Apt B Ridgecrest, CA | 2.0 | 1.0 | 880 | $1,275 | $1.45 | 2d | 1 | 0.10mi |
| 235 W Robertson Rd Ridgecrest, CA | 2.0 | 1.0 | 725 | $1,250 | $1.72 | 2d | 1 | 0.13mi |
| 219 W Robertson Rd Ridgecrest, CA | 3.0 | 1.0 | 955 | $1,200 | $1.26 | 19d | 1 | 0.15mi |
| 311 W Church Ave Unit B Ridgecrest, CA | 2.0 | 1.0 | 780 | $1,475 | $1.89 | 2d | 1 | 0.18mi |
| 141 W Upjohn Ave Unit 109 Ridgecrest, CA | 2.0 | 2.0 | 1000 | $1,100 | $1.10 | 2d | 1 | 0.19mi |
| 424 W Wilson Ave Unit A Ridgecrest, CA | 2.0 | 1.0 | 900 | $995 | $1.11 | 2d | 1 | 0.19mi |
| 430 W Wilson Ave Ridgecrest, CA | 3.0 | 1.0 | 1080 | $1,350 | $1.25 | 2d | 1 | 0.21mi |
| 204 W Robertson Rd Apt C Ridgecrest, CA | 2.0 | 1.0 | 1215 | $1,150 | $0.95 | 44d | 1 | 0.21mi |
| 413 S Sunset St Unit C Ridgecrest, CA | 2.0 | 1.0 | 900 | $1,050 | $1.17 | 2d | 1 | 0.37mi |
| 707 S Norma St Ridgecrest, CA | 2.0 | 1.0 | 950 | $1,000 | $1.05 | 2d | 1 | 0.41mi |
| 139 S Norma St Unit B Ridgecrest, CA | 2.0 | 1.0 | 810 | $950 | $1.17 | 2d | 1 | 0.44mi |
| 135 S Norma St Apt A Ridgecrest, CA | 2.0 | 1.0 | 810 | $975 | $1.20 | 2d | 1 | 0.45mi |
| 205 E Upjohn Ave Ridgecrest, CA | 2.0 | 2.5 | 1288 | $1,225 | $0.95 | 44d | 1 | 0.46mi |
| 736 S Norma St Unit C Ridgecrest, CA | 2.0 | 1.0 | 800 | $1,000 | $1.25 | 2d | 1 | 0.46mi |
| 228 S Gemstone St Unit B Ridgecrest, CA | 2.0 | 1.0 | 891 | $1,000 | $1.12 | 2d | 1 | 0.47mi |
| 247 E Upjohn Ave Ridgecrest, CA | 3.0 | 2.5 | 1305 | $1,425 | $1.09 | 2d | 1 | 0.49mi |
| 824 S Norma St Unit 832A Ridgecrest, CA | 3.0 | 2.0 | 925 | $1,650 | $1.78 | 2d | 1 | 0.49mi |
| 824 S Norma St Unit 848B Ridgecrest, CA | 2.0 | 1.0 | 800 | $1,350 | $1.69 | 23d | 1 | 0.49mi |
| 824 S Norma St Unit 848A Ridgecrest, CA | 2.0 | 1.0 | 800 | $1,350 | $1.69 | 2d | 1 | 0.49mi |
| 824 S Norma St Unit 804B Ridgecrest, CA | 2.0 | 2.0 | 850 | $1,550 | $1.82 | 2d | 1 | 0.49mi |
| 255 E Upjohn Ave Ridgecrest, CA | 2.0 | 2.5 | 1258 | $1,350 | $1.07 | 2d | 1 | 0.50mi |
| 741 S Allen St Unit B Ridgecrest, CA | 2.0 | 1.0 | 700 | $950 | $1.36 | 44d | 1 | 0.53mi |
| 520 Silveridge St Ridgecrest, CA | 3.0 | 2.0 | 1471 | $2,000 | $1.36 | 44d | 1 | 0.56mi |
| 201 N Alvord St Apt E Ridgecrest, CA | 2.0 | 1.0 | 768 | $925 | $1.20 | 2d | 1 | 0.56mi |
| 740 W Church Ave Ridgecrest, CA | 4.0 | 2.0 | 1500 | $1,800 | $1.20 | 19d | 1 | 0.61mi |
| 117 S Silver Ridge St Ridgecrest, CA | 3.0 | 2.0 | 1144 | $1,500 | $1.31 | 44d | 1 | 0.65mi |
| 332 N Alvord St Unit A Ridgecrest, CA | 2.0 | 2.0 | 1000 | $950 | $0.95 | 23d | 1 | 0.80mi |
| 332 N Alvord St Unit 332 Ridgecrest, CA | 3.0 | 2.0 | 1100 | $1,100 | $1.00 | 44d | 1 | 0.80mi |
| 401 N Norma St Ridgecrest, CA | 3.0 | 2.0 | 1360 | $1,500 | $1.10 | 2d | 1 | 0.87mi |
| 528 Heatherglen Dr Ridgecrest, CA | 3.0 | 2.0 | 1370 | $1,725 | $1.26 | 2d | 1 | 0.87mi |
| 238 N Gold Canyon St Unit C537A Ridgecrest, CA | 3.0 | 1.0 | 1030 | $1,445 | $1.40 | 2d | 1 | 0.89mi |
| 238 N Gold Canyon St Unit C533 Ridgecrest, CA | 2.0 | 1.0 | 825 | $1,245 | $1.51 | 2d | 1 | 0.89mi |
| 804 S Nevada St Ridgecrest, CA | 4.0 | 2.0 | 1470 | $1,900 | $1.29 | 44d | 1 | 0.90mi |
| 1140 College Heights Blvd Ridgecrest, CA | 2.0 | 1.0 | 950 | $1,050 | $1.11 | 2d | 1 | 0.91mi |
| 519 E Ridgecrest Blvd Unit A Ridgecrest, CA | 2.0 | 1.5 | 832 | $1,400 | $1.68 | 2d | 1 | 0.95mi |
| 1000 W Coronado Ave Ridgecrest, CA | 3.0 | 2.0 | 1161 | $1,600 | $1.38 | 44d | 1 | 0.99mi |
| 236 S American St Ridgecrest, CA | 3.0 | 2.0 | 1407 | $1,650 | $1.17 | 44d | 1 | 0.99mi |
| 922 W Vulcan Ave Ridgecrest, CA | 3.0 | 2.0 | 1458 | $2,100 | $1.44 | 44d | 1 | 1.00mi |
| 624 Yellow Astor Ave Ridgecrest, CA | 2.0 | 2.0 | 1441 | $1,800 | $1.25 | 21d | 1 | 1.00mi |
Listing history 2 events
-
2026-06-18remarks 664-char remark
-
2026-06-18$90,000 Active 1 DOM
ⓘ Source: listings_history table (triggers on properties + properties_extension) + one-shot
backfill from property_details.listing_events for pre-trigger history.
Climate risk First Street
- Flood 1/10 Low FEMA zone X (unshaded) · 0% chance over 30 yrs
- Wildfire 4/10 Moderate
- Heat 8/10 Severe 7 d/yr ≥105°F today · 20 d/yr by 30 yrs out
- Wind 1/10 Low
- Air quality 7/10 Severe 14 unhealthy d/yr today · 15 by 30 yrs out
Nearby sold comps map
Loading sold comps map…
Walkable amenities ~0.75 mi
Loading nearby amenities…
Taxation est. · year 1
- Rental income
- $16,312
- − Mortgage interest
- −$5,041
- − Property taxes
- −$1,350
- − Insurance
- −$450
- − Repairs & maintenance
- −$1,305
- − Management
- −$1,305
- − Depreciation
- −$2,618
- Taxable income
- $4,243
- Est. tax owed @ 24.0%
- −$1,018
- After-tax cash flow
- $4,405/yr
For passive investors: Depreciation is non-cash, so a rental often shows a tax loss while cash-flowing — sheltering income. Rental losses are passive: they offset passive income freely, and up to $25,000/yr can offset ordinary (W-2) income if you actively participate and your MAGI is under $100k (phasing out to $0 by $150k); unused losses carry forward. On sale, claimed depreciation is recaptured at up to 25%, and gains may owe capital-gains tax (a 1031 exchange can defer both). Figures are a year-1 estimate at your 24.0% rate — not tax advice; consult a CPA.
Condition & rehab AI · 12 photos
This property requires extensive repairs and updates, including roof, exterior, interior walls, HVAC, and landscaping. It presents significant potential for value increase through these improvements.
Repairs flagged
- Major roof — No photos of roof
- Major exterior — RV parked on property
- Major interior walls/paint — Painted walls in living areas
- Major HVAC/mechanicals — No photos of HVAC
- Major landscaping — No photos of landscaping
Value-add opportunities
- Both paint interior walls — Improves appearance and value
- Both replace HVAC system — Enhances comfort and energy efficiency
- Both landscaping and curb appeal — Enhances property's visual appeal and value
Renovation cost estimate screening
| Repair item | Severity | Est. cost |
|---|---|---|
| roof · No photos of roof | Major | $15,000–50,000 |
| exterior · RV parked on property | Major | $15,000–50,000 |
| interior walls/paint · Painted walls in living areas | Major | $15,000–50,000 |
| HVAC/mechanicals · No photos of HVAC | Major | $15,000–50,000 |
| landscaping · No photos of landscaping | Major | $15,000–50,000 |
| Total estimated repair cost · 5 items | $75,000–250,000 |
Value-add ROI direction
- Both paint interior walls — Improves appearance and value ↑
- Both replace HVAC system — Enhances comfort and energy efficiency ↑
- Both landscaping and curb appeal — Enhances property's visual appeal and value ↑
ⓘ Cost ranges are severity-bucket heuristics (US national rule-of-thumb). Get contractor quotes + a written scope before underwriting a rehab budget.
Schools (NCES district)
- District
- Sierra Sands Unified
- NCES district ID
- 0636800
- Math proficiency
- 25% ▼ -11.00%
- Reading proficiency
- 39% ▼ -11.00%
- Median HH income
- $58,937
- Composite
- 28.66/100
- National rank
- #6699
- State rank
- #294 of 517 in CA
Livability — Ridgecrest
- Score
- 70/100
- State rank
- #243
- US rank
- #8014
Category grades
Schools grade is shown separately in the Schools card above.
Census & demographics
- Census place
- Ridgecrest, CA
- County
- Kern County · 710,371 people
- City population
- 33,845
- Metro
- Bakersfield, CA
- Population (ZIP)
- 33,845
- Household income
- $86,700
- Rent vs Own
- Severe rent burden
- 975.0
Population outlook (Kern County) Hauer SSP2
- Today (2025)
- 947,286 people
- By 2030
- 978,984 · +3.3%
- By 2040
- 1,045,018 · +10.3%
- By 2050
- 1,105,232 · +16.7%
- By 2075
- 1,229,538 · +29.8%
- By 2100
- 1,238,059 · +30.7%
Race, ethnicity, and origin ACS 2023
- Neighborhood character
- Majority White (65%)
- Race & ethnicity
- White 65% Hispanic / Latino 20% Two or more races 12% Black 4% Asian 4% Native American 1%
- Hispanic origin (detail)
- Mexican 15%
- Common ancestry
- Italian 4% Lithuanian 2% Slovak 2%
- Foreign-born
- 7% · Canada
- Languages at home
- 84% English-only · Spanish 11% Other Indo-European 1% Other Asian/Pacific 1%
Political lean MEDSL · Kern
- 2024 margin
- Strong R (+21.1) · D 38.2% · R 59.3% · Other 2.5%
- 2008→2024 swing
- -3.3pp toward R · 2008: -17.8pp · 2024: -21.1pp
- All cycles
- 2024: R+21.1 2020: R+10.2 2016: R+15.0 2012: R+20.9 2008: R+17.8
Not yet ingested
- Civics
- —
Market trends
- HPI YoY
- ▼ -120.17%
- Current HPI
- 380.5208
- Rent YoY
- ▲ 3.58%
- Metro
- Bakersfield, CA
- State GDP YoY
- ▲ 3.21%
- F500 in state
- 116
Industry mix (Fortune 500 HQ in CA)
| Industry | F500 HQs | Revenue |
|---|---|---|
| Technology | 27 | $1,492B |
|
||
| Financial Services | 3 | $174B |
|
||
| Retail | 3 | $44B |
|
||
| Insurance | 3 | $26B |
|
||
| Media / Entertainment | 2 | $115B |
|
||
| Pharmaceuticals / Biotech | 2 | $62B |
|
||
Price history
1 event — show timeline
- 2026-06-17 Listed $90,000 SSMLS
Cash-flow waterfall
monthlySold comps — $/sqft
last 12 mo · ≤1 miLoading sold comps…