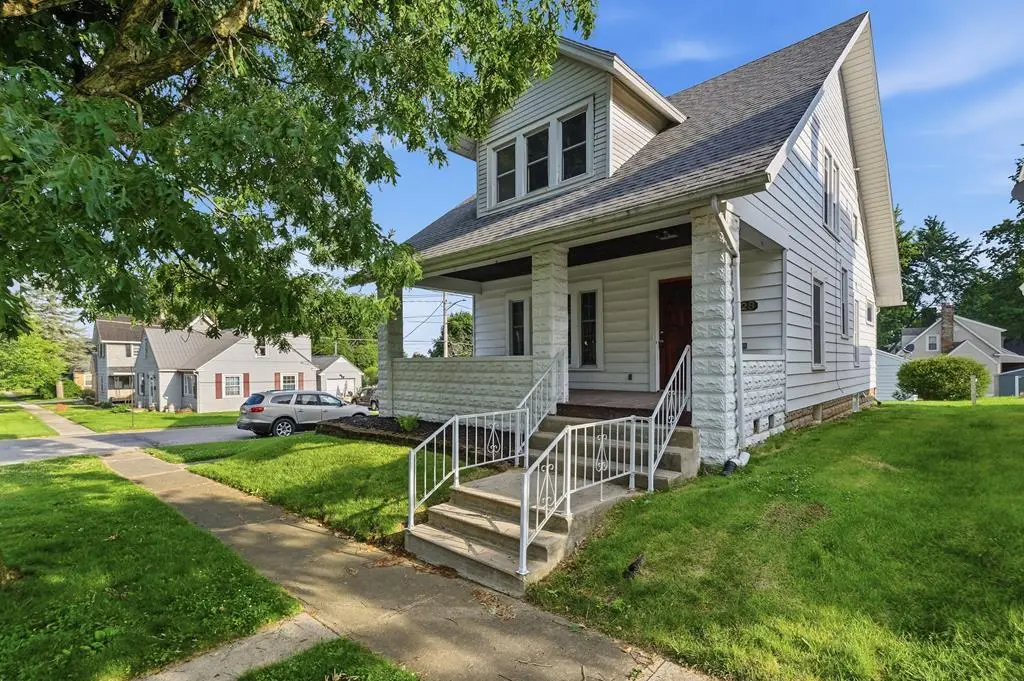
528 Grove Ave · Galion, OH
Flood risk 1/10 · Minimal
- FEMA flood zone
- X (unshaded)
- Chance of flooding over 30 yrs
- 0.0%
- Est. flood insurance / yr
- $473 – $860
Fire risk 1/10 · Minimal
- Est. fire insurance / yr
- $713 – $1,323
Heat risk 3/10 · Minor
- Hot days now (above 98°F)
- 7 days/yr
- Hot days in 30 yrs
- 17 days/yr
Wind risk 2/10 · Minimal
- Chance of severe wind over 30 yrs
- —
Air-quality risk 2/10 · Minimal
- Unhealthy air days now
- 1 days/yr
- Unhealthy air days in 30 yrs
- 1 days/yr
Risk factors via First Street. Map © Google.
Why this score? — see what drove the D- grade
The composite is a weighted blend of 9 inputs, each scored 0–100. Each bar is that input's sub-score; the figure is the points it added to the 100-point composite (weight × sub-score).
- Cash flow +14.6/30.0
- DSCR +4.5/10.0
- Schools +3.8/10.0
- 1% rule +3.2/10.0
- Livability +3.2/5.0
- ARV discount +2.8/15.0
- Rent growth +2.5/5.0
- Condition / age +2.5/5.0
- Appreciation +0.0/10.0
$159,900
🖨 Deal sheet 📄 Offer letter ✓ Due diligence
Listing remarks MLS
Spacious home with beautiful hardwood floors in most rooms. Oak trim, formal dining room, mostly new Thermopane windows, large covered front porch and corner lot. 3 bedrooms, 2 baths. Full dry basement with family room. Large living room with original decorative fireplace. Detached 22x28 garage with concrete floor and electric. Playhouse and more.
Key facts
- Covered front porch
- Fresh paint
- New flooring
Tags
Property features AI
Exterior
- Parking: 2-car garage; Concrete and gravel parking surfaces
- Utilities: Public water; Public sewer
- Home design: Residential single-family home
- Construction: Vinyl siding construction; Composition roof
- Exterior features: Composition roof; Vinyl siding
Interior
- Kitchen: Refrigerator; Range
- Bathrooms: 1 full bathroom; 1 half bathroom
- Heating & cooling: Central air conditioning; Hot water heating; Natural gas heating
- Interior features: Eat-in kitchen; Living room fireplace (1)
Neighborhood map
What this means for you Summary
Snapshot
- This is a 3-bed/2.0-bath single-family listed at $160k.
Deal economics
- At list price, monthly cash flow is $39 ($470/yr) — positive.
- The deal already cash-flows at list — no discount required.
- To meet the 1% rule (rent ≥ 1% of price), the offer needs to be $131k (18.3% below list).
- Recommended offer: $131k (18.3% below list) — sets the bar for 1% rule.
- Cap rate 6.6% vs local median 4.8% in Galion — top-decile yield for the area; either an underpriced asset or a hidden risk that comps aren't pricing in. Stress-test before assuming the spread holds.
Location & tenants
- Location reads 63/100 on livability (#833 in OH) — a middle-class / working-renter tenant base. Strengths: cost of living A+, housing A+, crime A-; Watch: schools C-, amenities F, commute F.
- Galion City (town): math 36% / reading 56% proficiency, ranked #499 of 656 in OH (top 76%) — families likely to look elsewhere, expect single-tenant / working-renter base with shorter leases.
- Market conditions: 76 active listings in the ZIP; 8 units permitted in Crawford County in 2024 (0 in 5+ unit buildings).
Forward outlook
- Local home prices are declining (-3.0%/yr); year-one equity from $1k of loan paydown is wiped out by about $5k of value loss. Plan a longer hold.
- Crawford County population projected at -22% by 2050 — secular population decline; favor cash flow + early exit over multi-decade hold.
Negotiation context
- Only 10 days on market — expect competitive offers; lowballing is unlikely to land.
- 6 sale attempts since 15y ago; this cycle's ask has dropped $10k (6%) from the opening price — seller is motivated, your offer sets the floor, not the list.
- Current owner paid $79k; list at $160k implies a 102% gain — meaningful room to come down on a strong offer.
Risks & watch-outs
- Watch-outs: built in 1930 — expect roof / HVAC / electrical / plumbing capex.
Questions for the listing agent
- Built in 1930 — when were the roof, HVAC, electrical panel, plumbing, and water heater last replaced?
- Is there a deadline driving the sale (1031 exchange, divorce, estate, relocation)? That informs how much negotiation room exists.
- The area grade is low — what's the realistic commute time and amenity access for the typical tenant pool here? Any planned neighborhood developments (good or bad) we should know about?
- What's the average days-on-market for RENTAL listings here right now (not sales)? A rising rental-DOM trend means longer vacancies and softer asking-rent achievability than the comps imply.
- What's the recent tenant-quality profile in this submarket — average credit score on applications, eviction rate, late-payment / NSF rate, and stable-employment percentage? A property-management company in the area should have these aggregated.
- How much new for-sale + rental construction is in the pipeline within 1–3 miles? Heavy new supply typically softens prices + rents 12–24 months out; constrained supply supports both.
Investment metrics
- 1% rule
- 0.82% ✗
- Cap rate
- 6.59%
- Cash-on-cash
- 1.05%
- DSCR
- 1.05
- GRM
- 10.2
CMA / ARV
- ARV (on-the-fly)
- $144,652
- Comps found
- 12
Show comp detail 12 sales within ~0.75 mi
| Address | Dist | Beds/Ba | Sqft | Sold | Price | $/sf | Match |
|---|---|---|---|---|---|---|---|
| 240 Clymer Ave | 0.17mi | 3/2.0 | 1,668 (-1%) | 1mo | $225,000 | $135 | 90 |
| 216 Orange St | 0.12mi | 3/2.0 | 1,586 (-6%) | 2mo | $140,000 | $88 | 83 |
| 632 Westwood Ave | 0.10mi | 4/1.5 (+1) | 1,696 (+1%) | 5mo | $124,000 | $73 | 83 |
| 325 Cherry St | 0.25mi | 4/2.0 (+1) | 1,632 (-3%) | 6mo | $156,000 | $96 | 73 |
| 512 Cherry St | 0.16mi | 4/1.5 (+1) | 1,568 (-7%) | 4mo | $129,900 | $83 | 71 |
| 337 Grove Ave | 0.20mi | 3/1.0 | 1,494 (-11%) | 0mo | $118,000 | $79 | 68 |
| 638 S Boston St | 0.42mi | 3/2.0 | 1,560 (-7%) | 1mo | $196,900 | $126 | 67 |
| 322 Cherry St | 0.27mi | 2/1.0 (-1) | 1,606 (-4%) | 6mo | $138,500 | $86 | 66 |
| 315 E Atwood St | 0.67mi | 3/1.0 | 1,650 (-2%) | 2mo | $26,000 | $16 | 60 |
| 281 N Union St | 0.63mi | 3/1.0 | 1,536 (-9%) | 2mo | $105,000 | $68 | 51 |
| 359 S Market St | 0.45mi | 4/1.0 (+1) | 1,500 (-11%) | 1mo | $112,700 | $75 | 51 |
| 239 Hessenauer Dr | 0.72mi | 4/2.0 (+1) | 1,550 (-8%) | 6mo | $283,000 | $183 | 43 |
Match score weights: distance 35% · size 25% · config 20% · recency 20%. Top-matched comps best support the ARV.
Projected returns pro-forma
-3.0% appreciation · 3.0% rent growth · sell at horizon
- IRR
- -14.7%
- Equity multiple
- 0.48×
- Total profit
- $-23,464
- Equity at exit
- $23,842
- IRR
- -6.0%
- Equity multiple
- 0.61×
- Total profit
- $-17,420
- Equity at exit
- $13,825
Cash invested: $44,772 (down + closing). Projections, not guarantees.
Landlord ↔ Tenant lean methodology
- Overall (STATE)
- 73 Landlord-Friendly
- State Ohio
- 73 Landlord-Friendly · R+6
- County
- — inherits STATE
- City
- — inherits STATE
ZIP-level market 44833
- Home prices YoY
- -27.9%
- Active inventory
- 76
- Price-to-rent
- 10.2×
Monthly cashflow live
- Estimated rent
- $1,306 medium interval (Pro) →
- Mortgage (P&I)
- −$839
- Tax from tax record
- −$87 /mo · $1,045/yr
- Insurance
- −$67
- HOA
- −$0
- Vacancy / Maint / Mgmt
- −$274
- Net cashflow
- $39
Break-even live
UW: 25.0% down · 7.5% · 30yr · 1.5% tax · 5.0% vac · 8.0% maint · 8.0% mgmt
Financing live
Cash to close
- Down payment
- $39,975
- Closing costs
- $4,797
- Reserves months
- —
- Total cash needed
- —
Loan-product check · same deal, 3 products live
Conventional
25% down · 7.5% · 30yr
- Down + closing
- —
- Monthly P&I
- —
- Monthly cashflow
- —
- DSCR
- —
- Eligible?
- —
Personal DTI + credit; lowest rate.
DSCR
20% down · 8.5% · 30yr
- Down + closing
- —
- Monthly P&I
- —
- Monthly cashflow
- —
- DSCR
- —
- Eligible?
- —
No personal income docs; deal must DSCR.
Hard money
10% down · 12.0% · 12mo
- Down + closing
- —
- Monthly P&I
- —
- Monthly cashflow
- —
- DSCR
- —
- Eligible?
- —
Short-term bridge; refi at stabilization.
Listing history 8 events
-
2026-06-19days on market $159,900 Active 10 DOM
-
2026-06-18days on market $159,900 Active 9 DOM
-
2026-06-17days on market $159,900 Active 8 DOM
-
2026-06-16days on market $159,900 Active 7 DOM
-
2026-06-15days on market $159,900 Active 6 DOM
-
2026-06-14days on market $159,900 Active 4 DOM
-
2026-06-12remarks 699-char remark
-
2026-06-12$159,900 Active 3 DOM
ⓘ Source: listings_history table (triggers on properties + properties_extension) + one-shot
backfill from property_details.listing_events for pre-trigger history.
Tax reassessment forecast OH · Partial reset (capped growth)
- Current annual tax
- $1,045 · $87/mo
- Projected year-2 tax
- $1,770 · $147/mo
- Expected delta
- +$725/yr (+$60/mo · 69.3%)
ⓘ Screening estimate from a state-policy table — verify with the county assessor before closing.
Climate risk First Street
- Flood 1/10 Low FEMA zone X (unshaded) · 0% chance over 30 yrs
- Wildfire 1/10 Low
- Heat 3/10 Moderate 7 d/yr ≥98°F today · 17 d/yr by 30 yrs out
- Wind 2/10 Low
- Air quality 2/10 Low 1 unhealthy d/yr today · 1 by 30 yrs out
Nearby sold comps map
Loading sold comps map…
Walkable amenities ~0.75 mi
Loading nearby amenities…
Taxation est. · year 1
- Rental income
- $15,668
- − Mortgage interest
- −$8,957
- − Property taxes
- −$1,045
- − Insurance
- −$800
- − Repairs & maintenance
- −$1,253
- − Management
- −$1,253
- − Depreciation
- −$4,652
- Taxable loss
- −$2,292
- Est. tax savings @ 24.0%
- +$550
- After-tax cash flow
- $1,020/yr
For passive investors: Depreciation is non-cash, so a rental often shows a tax loss while cash-flowing — sheltering income. Rental losses are passive: they offset passive income freely, and up to $25,000/yr can offset ordinary (W-2) income if you actively participate and your MAGI is under $100k (phasing out to $0 by $150k); unused losses carry forward. On sale, claimed depreciation is recaptured at up to 25%, and gains may owe capital-gains tax (a 1031 exchange can defer both). Figures are a year-1 estimate at your 24.0% rate — not tax advice; consult a CPA.
Schools (NCES district)
- District
- Galion City
- NCES district ID
- 3904402
- Math proficiency
- 36% ▼ -12.00%
- Reading proficiency
- 56% ▬ 0.00%
- Median HH income
- $36,331
- Composite
- 38.08/100
- National rank
- #4279
- State rank
- #499 of 656 in OH
Livability — Galion
- Score
- 63/100
- State rank
- #833
- US rank
- #15587
Category grades
Schools grade is shown separately in the Schools card above.
Census & demographics
- Census place
- Galion, OH
- County
- Morrow · 41,908 people
- City population
- 16,641
- Metro
- Columbus, OH
- Population (ZIP)
- 16,641
- Household income
- $57,234
- Rent vs Own
- Severe rent burden
- 3.8
Population outlook (Crawford County) Hauer SSP2
- Today (2025)
- 39,421 people
- By 2030
- 37,656 · -4.5%
- By 2040
- 34,043 · -13.6%
- By 2050
- 30,617 · -22.3%
- By 2075
- 23,652 · -40.0%
- By 2100
- 17,786 · -54.9%
Race, ethnicity, and origin ACS 2023
- Neighborhood character
- Predominantly White (96%)
- Race & ethnicity
- White 96% Two or more races 2% Hispanic / Latino 2%
- Common ancestry
- Slovak 2% Romanian 2% Lithuanian 2%
- Foreign-born
- 1% · Canada
- Languages at home
- 98% English-only · Spanish 1% German/W. Germanic 1%
Political lean MEDSL · Crawford
- 2024 margin
- Solid R (+53.0) · D 23.1% · R 76.1%
- 2008→2024 swing
- -33.9pp toward R · 2008: -19.0pp · 2024: -53.0pp
- All cycles
- 2024: R+53.0 2020: R+50.9 2016: R+46.8 2012: R+22.7 2008: R+19.0
Not yet ingested
- Civics
- —
Market trends
- HPI YoY
- ▼ -84.57%
- Current HPI
- 218.195
- Rent YoY
- —
- Metro
- —
- State GDP YoY
- ▲ 1.98%
- F500 in state
- 48
Industry mix (Fortune 500 HQ in OH)
| Industry | F500 HQs | Revenue |
|---|---|---|
| Insurance | 3 | $145B |
|
||
| Industrial Machinery | 3 | $49B |
|
||
| Financial Services | 3 | $24B |
|
||
| Consumer Goods | 2 | $93B |
|
||
| Aerospace / Defense | 2 | $47B |
|
||
| Utilities | 2 | $33B |
|
||
Price history
+130.1% since first listed14 events — show timeline
- 2026-06-09 Price Changed $159,900 MARMLS
- 2026-06-09 Listed $169,900 MARMLS
- 2024-11-12 Listing Removed — CBRMLS
- 2024-10-14 Listed $105,000 CBRMLS
- 2018-05-30 Sold (Public Records) $79,000 Public Records
- 2018-04-26 Sold (MLS) $79,000 CBRMLS
- 2018-04-26 Sold (MLS) $79,000 MARMLS
- 2018-03-01 Listed $79,700 MARMLS
- 2017-10-31 Listed $79,700 CBRMLS
- 2011-10-26 Listing Removed — MLSNOW
- 2011-08-30 Listing Removed — MLSNOW
- 2011-05-29 Listed $74,195 MLSNOW
- 2011-05-23 Listed $74,195 MLSNOW
- 2000-01-26 Sold (Public Records) $69,500 Public Records
Property tax history
+0.9%/yrLatest (2025): $1,045 · -0.3% YoY. Source: county tax records.
Cash-flow waterfall
monthlySold comps — $/sqft
last 12 mo · ≤1 miLoading sold comps…