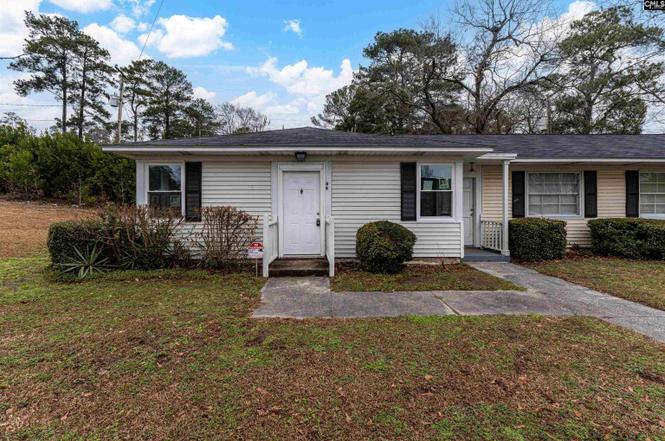
320 S Beltline Unit 4A · Columbia, SC
Flood risk 1/10 · Minimal
- FEMA flood zone
- X (unshaded)
- Chance of flooding over 30 yrs
- 0.0%
- Est. flood insurance / yr
- $507 – $1,088
Fire risk 3/10 · Minor
- Est. fire insurance / yr
- $783 – $1,453
Heat risk 7/10 · Major
- Hot days now (above 109°F)
- 7 days/yr
- Hot days in 30 yrs
- 16 days/yr
Wind risk 6/10 · Moderate
- Chance of severe wind over 30 yrs
- 66.0%
Air-quality risk 3/10 · Minor
- Unhealthy air days now
- 2 days/yr
- Unhealthy air days in 30 yrs
- 2 days/yr
Risk factors via First Street. Map © Google.
Why this score? — see what drove the C- grade
The composite is a weighted blend of 9 inputs, each scored 0–100. Each bar is that input's sub-score; the figure is the points it added to the 100-point composite (weight × sub-score).
- Cash flow +20.2/30.0
- ARV discount +7.5/15.0
- 1% rule +7.4/10.0
- DSCR +6.4/10.0
- Rent growth +4.2/5.0
- Livability +3.9/5.0
- Schools +2.6/10.0
- Condition / age +2.5/5.0
- Appreciation +0.0/10.0
$105,000
🖨 Deal sheet 📄 Offer letter ✓ Due diligence
Listing remarks
Move-in ready and renovated, this property is perfect first-time homebuyer, students, or anyone seeking a stylish low-maintenance home close to everything Columbia provide. Discover comfort and convenience in this fully renovated 2 bedroom, 1-bath condo ideally situated on a spacious corner lot. Located just minutes from Interstate access, Midlands Technical College, Williams Brice Stadium, and downtown Columbia, this home blends modern upgrades with an unbeatable location. Step inside to find brand-new stainless-steel appliances, sleek new LVP throughout, new HVAC, new water heater, washer and dryer connections, fresh paint, energy-efficient windows, new cabinets throughout, new faucets th
Key facts
- Fully renovated
- New hvac
- New water heater
Tags
Property features AI
Finance
- Other: Directions: Please use GPS
- HOA & community: Property is part of an association
Exterior
- Parking: Two parking spaces
- Utilities: Public sewer; Public water
- Home design: Unit in a multi-unit building
- Construction: Slab foundation
- Exterior features: Vinyl exterior; Paved road access; Public water
Interior
- Bedrooms: Master bedroom on the main level; Second bedroom on the main level
- Bathrooms: One full bathroom
- Heating & cooling: Central heat; Central air
- Interior features: Central heating and central cooling
Neighborhood map
What this means for you Summary
Snapshot
- This is a 2-bed/1.0-bath condo listed at $105k.
Deal economics
- At list price, monthly cash flow is $132 ($2k/yr) — positive.
- The deal already cash-flows at list — no discount required.
- Meets the 1% rule at list price ($1k rent vs $105k).
- Recommended offer: $92k (12.0% below list) — sets the bar for market timing.
Location & tenants
- Location reads 78/100 on livability (#18 in SC, #2,436 nationally) — a middle-class / working-renter tenant base. Strengths: amenities A+, commute A+, cost of living A+; Watch: employment D, crime F.
- Richland 01 (urban): math 26% / reading 36% proficiency, ranked #54 of 80 in SC (top 68%) — families likely to look elsewhere, expect single-tenant / working-renter base with shorter leases; 64% free/reduced lunch — lower-income household profile, screen leases tightly.
- Zoned schools: Brennen Elementary (math 61% / reading 63%, grade B, #73 of 597 statewide, top 12%, 806 students, 100% FRL); A. C. Flora High (math 42% / reading 92%, grade B, #73 of 196 statewide, top 41%, 1,352 students, 100% FRL) — zoned schools average 100% FRL vs 64% district-wide (36 pts higher); higher-poverty schools than district average — tighter screening recommended.
- Zoned-school proficiency averages 64% at this address vs 31% district-wide (+34 pts) — the actual schools serving this property are materially stronger than the Richland 01 average implies; a family-tenant draw the district grade alone would hide.
- Market conditions: Rents rising fast (+7.0%/yr); 145 active listings in the ZIP; 40 comparable units currently listed for rent nearby; rentals at typical pace (median 24d on market — plan ~3-4 weeks tenant-placement turnaround); 3,472 units permitted in Richland County in 2024 (1,096 in 5+ unit buildings).
Forward outlook
- Local home prices are declining (-3.0%/yr); year-one equity from $726 of loan paydown is wiped out by about $3k of value loss. Plan a longer hold.
- Richland County population projected at +30% by 2050 — long-run rental-demand tailwind backs the buy-and-hold thesis.
- At projected returns (-3.0% appreciation + 7.0% rent growth), your $29k cash investment doubles in ~9 years — after that, you're playing with house money.
Negotiation context
- It's been on market 122 days — a 12% lower offer ($92k) is reasonable based on typical stale-listing flexibility.
- 2 sale attempts since 2y ago with the ask held roughly flat each time — persistent listings suggest the price (not the market) is what's stuck; bring a comps-based counter.
- Current owner paid $20k; list at $105k implies a 425% gain — meaningful room to come down on a strong offer.
Risks & watch-outs
- Watch-outs: built in 1949 — expect roof / HVAC / electrical / plumbing capex.
- Climate carrying-cost: major wind risk, 66% chance of damaging wind over 30y; extreme-heat days projected 7→16/yr by 2055 (HVAC capex compounding) — expect insurance premiums to compound above CPI over the hold.
Questions for the listing agent
- It's been on market 122 days. Have you received any prior offers? Is the seller open to a 12% concession, seller financing, or rate buy-down credit?
- Built in 1949 — when were the roof, HVAC, electrical panel, plumbing, and water heater last replaced?
- What does the HOA fee cover, when was the last increase, and are there any pending special assessments or reserve-fund shortfalls?
- Any open or pending special assessments — roof, HVAC, plumbing, elevator, façade? What's the per-unit balance and payoff schedule, and is the seller paying it off at close or rolling it to the buyer?
- Why hasn't it sold? Are there any deal-killer items the seller is aware of (foundation, flood, title, zoning, code violations)?
- Is there a deadline driving the sale (1031 exchange, divorce, estate, relocation)? That informs how much negotiation room exists.
- Schools are D-rated, which usually means shorter tenancies and higher turnover. Who's the typical renter profile here, and what's been the actual vacancy rate?
- Crime grade is F in this area — have there been break-ins, vandalism, or insurance claims at this property in the last 3 years? What carrier currently insures it and at what premium?
- What's the average days-on-market for RENTAL listings here right now (not sales)? A rising rental-DOM trend means longer vacancies and softer asking-rent achievability than the comps imply.
- What's the recent tenant-quality profile in this submarket — average credit score on applications, eviction rate, late-payment / NSF rate, and stable-employment percentage? A property-management company in the area should have these aggregated.
- How much new apartment / multifamily construction is in the pipeline within 1–3 miles? Heavy new supply (>2% of stock underway) typically softens rents 12–24 months out; light construction supports rent growth.
Investment metrics
- 1% rule
- 1.24% ✓
- Cap rate
- 7.81%
- Cash-on-cash
- 5.40%
- DSCR
- 1.24
- GRM
- 6.7
CMA / ARV
No comps found within radius.
Projected returns pro-forma
-3.0% appreciation · 6.95% rent growth · sell at horizon
- IRR
- -2.6%
- Equity multiple
- 0.90×
- Total profit
- $-3,066
- Equity at exit
- $15,656
- IRR
- 11.6%
- Equity multiple
- 2.11×
- Total profit
- $32,709
- Equity at exit
- $9,078
Cash invested: $29,400 (down + closing). Projections, not guarantees.
Landlord ↔ Tenant lean methodology
- Overall (STATE)
- 90 Strongly Landlord-Friendly
- State South Carolina
- 90 Strongly Landlord-Friendly · R+6
- County
- — inherits STATE
- City
- — inherits STATE
ZIP-level market 29205
- Rents YoY
- 7.0%
- Active inventory
- 145
- Price-to-rent
- 6.7×
Monthly cashflow live
- Estimated rent
- $1,305 high interval (Pro) →
- Mortgage (P&I)
- −$551
- Tax from tax record
- −$47 /mo · $559/yr
- Insurance
- −$44
- HOA
- −$258
- Vacancy / Maint / Mgmt
- −$274
- Net cashflow
- $132
Break-even live
UW: 25.0% down · 7.5% · 30yr · 1.5% tax · 5.0% vac · 8.0% maint · 8.0% mgmt
Financing live
Cash to close
- Down payment
- $26,250
- Closing costs
- $3,150
- Reserves months
- —
- Total cash needed
- —
Loan-product check · same deal, 3 products live
Conventional
25% down · 7.5% · 30yr
- Down + closing
- —
- Monthly P&I
- —
- Monthly cashflow
- —
- DSCR
- —
- Eligible?
- —
Personal DTI + credit; lowest rate.
DSCR
20% down · 8.5% · 30yr
- Down + closing
- —
- Monthly P&I
- —
- Monthly cashflow
- —
- DSCR
- —
- Eligible?
- —
No personal income docs; deal must DSCR.
Hard money
10% down · 12.0% · 12mo
- Down + closing
- —
- Monthly P&I
- —
- Monthly cashflow
- —
- DSCR
- —
- Eligible?
- —
Short-term bridge; refi at stabilization.
Rent comps 40 comps
| Address | Beds | Baths | Sqft | Rent | $/sqft | DOM | Units | Dist |
|---|---|---|---|---|---|---|---|---|
| 320 S Beltline Blvd Columbia, SC | 2.0 | 1.0 | 800 | $1,048 | $1.31 | 23d | 5 | 0.09mi |
| 524 S Beltline Blvd Columbia, SC | 2.0 | 1.0 | 1050 | $1,300 | $1.24 | 23d | 1 | 0.15mi |
| 508 Deerwood St Unit 516 Columbia, SC | 1.0 | 1.0 | 600 | $995 | $1.66 | 23d | 1 | 0.22mi |
| 4425 E Chapel Rd Columbia, SC | 1.0 | 1.0 | 607 | $1,025 | $1.69 | 23d | 2 | 0.30mi |
| 500 Gills Creek Pkwy Columbia, SC | 1.0–2.0 | 1.0–2.0 | 807 | $1,375 | $1.70 | 11d | 27 | 0.35mi |
| 721 Deerwood St Columbia, SC | 2.0 | 1.0 | 1000 | $1,150 | $1.15 | 14d | 1 | 0.35mi |
| 4319 Wilmot Ave Columbia, SC | 3.0 | 1.0 | 1000 | $1,650 | $1.65 | 23d | 1 | 0.38mi |
| 3840 Overbrook Dr Columbia, SC | 2.0 | 2.0 | 900 | $1,595 | $1.77 | 23d | 1 | 0.42mi |
| 3901 Bright Ave Columbia, SC | 3.0 | 1.0 | 1047 | $1,380 | $1.32 | 14d | 1 | 0.45mi |
| 828 Suber St Unit E Columbia, SC | 2.0 | 1.0 | 1100 | $995 | $0.90 | 11d | 1 | 0.52mi |
| 715 Montague Rd Columbia, SC | 2.0 | 1.0 | 1000 | $1,180 | $1.18 | 23d | 1 | 0.53mi |
| 501 Pelham Dr Columbia, SC | 1.0–2.0 | 1.0–2.0 | 805 | $1,625 | $2.02 | 2d | 24 | 0.53mi |
| 108 Kilbourne Rd Unit 110 Columbia, SC | 2.0 | 1.0 | 680 | $1,300 | $1.91 | 23d | 1 | 0.59mi |
| 23 Cavalier Ct Unit A Columbia, SC | 2.0 | 1.0 | 871 | $1,300 | $1.49 | 23d | 1 | 0.60mi |
| 823 S Kilbourne Rd Columbia, SC | 2.0 | 1.0 | 743 | $1,100 | $1.48 | 23d | 1 | 0.65mi |
| 4103 Devine St Columbia, SC | 1.0 | 1.0 | 785 | $1,072 | $1.37 | 23d | 1 | 0.68mi |
| 3800 Wilmot Ave Columbia, SC | 2.0 | 1.0 | 720 | $1,500 | $2.08 | 23d | 1 | 0.69mi |
| 222 Prospect St Unit 224 Columbia, SC | 2.0 | 1.0 | 750 | $1,250 | $1.67 | 23d | 1 | 0.71mi |
| 3732 Hickory St Columbia, SC | 2.0 | 1.5 | 840 | $1,350 | $1.61 | 23d | 1 | 0.77mi |
| 21 Tempo Ct Columbia, SC | 3.0 | 1.5 | 1032 | $1,498 | $1.45 | 11d | 1 | 0.78mi |
| 1 Tempo Ct Columbia, SC | 3.0 | 1.5 | 1032 | $1,745 | $1.69 | 23d | 1 | 0.79mi |
| 1324 Deerwood St Unit 1 Columbia, SC | 2.0 | 2.0 | 1030 | $1,350 | $1.31 | 23d | 1 | 0.87mi |
| 3610 Timberlane Dr Unit 3605-B4 Ed Columbia, SC | 1.0 | 1.0 | 695 | $900 | $1.29 | 23d | 1 | 0.94mi |
| 3610 Timberlane Dr Unit 3610-E4 Ti Columbia, SC | 1.0 | 1.0 | 695 | $915 | $1.32 | 19d | 1 | 0.94mi |
| 3605 Edmond Dr Columbia, SC | 1.0 | 1.0 | 695 | $900 | $1.29 | 23d | 1 | 0.95mi |
| 4600 Fort Jackson Blvd Columbia, SC | 2.0 | 1.0 | 940 | $965 | $1.03 | 14d | 2 | 0.99mi |
| 4600 Fort Jackson Blvd Columbia, SC | 2.0 | 1.0 | 895 | $955 | $1.07 | 23d | 3 | 0.99mi |
| 712 Brandon Ave Unit 712 Brand Columbia, SC | 1.0 | 1.0 | 800 | $1,095 | $1.37 | 23d | 1 | 1.05mi |
| 3125 Heyward St Unit B Columbia, SC | 2.0 | 1.0 | 1100 | $1,600 | $1.45 | 23d | 1 | 1.09mi |
| 225 Myron Cir Unit 225 Columbia, SC | 2.0 | 1.0 | 850 | $905 | $1.06 | 14d | 1 | 1.09mi |
| 807 Cedar Ter Columbia, SC | 2.0 | 1.0 | 937 | $1,200 | $1.28 | 14d | 1 | 1.10mi |
| 4600 Fort Jackson Blvd Columbia, SC | 2.0 | 1.0 | 940 | $995 | $1.06 | 11d | 1 | 1.12mi |
| 822 Cedar Ter Unit 824 Columbia, SC | 1.0 | 1.0 | 775 | $895 | $1.15 | 14d | 1 | 1.14mi |
| 3626 Hydrangea St Columbia, SC | 2.0 | 1.0 | 800 | $1,040 | $1.30 | 21d | 1 | 1.18mi |
| 3800 Plowden Rd Unit D6 Columbia, SC | 1.0 | 1.0 | 668 | $800 | $1.20 | 21d | 1 | 1.24mi |
| 1649 S Beltline Blvd Columbia, SC | 2.0 | 1.0 | 900 | $1,250 | $1.39 | 23d | 1 | 1.31mi |
| 2748 Montgomery Ave Unit 2748 Columbia, SC | 1.0 | 1.0 | 612 | $1,590 | $2.60 | 14d | 1 | 1.37mi |
| 2746 Montgomery Ave Unit 2746 Columbia, SC | 1.0 | 1.0 | 612 | $1,590 | $2.60 | 14d | 1 | 1.37mi |
| 1840 Tall Pines Cir Columbia, SC | 3.0 | 1.5 | 1021 | $1,350 | $1.32 | 14d | 1 | 1.39mi |
| 1908 Tall Pines Cir Unit 4 Columbia, SC | 1.0 | 1.0 | 750 | $900 | $1.20 | 23d | 1 | 1.41mi |
HOA detail condo
- Monthly dues
- $258 · $3,096/yr
- Likely covers
- water
- Assessments
- None detected in remarks — confirm with the listing agent.
Listing history 21 events
-
2026-06-18days on market $105,000 Active 122 DOM
-
2026-06-17days on market $105,000 Active 121 DOM
-
2026-06-16days on market $105,000 Active 120 DOM
-
2026-06-15days on market $105,000 Active 119 DOM
-
2026-06-14days on market $105,000 Active 117 DOM
-
2026-06-10days on market $105,000 Active 114 DOM
-
2026-06-09days on market $105,000 Active 113 DOM
-
2026-06-08days on market $105,000 Active 112 DOM
-
2026-06-07days on market $105,000 Active 111 DOM
-
2026-06-03days on market $105,000 Active 107 DOM
-
2026-06-03days on market $105,000 Active 106 DOM
-
2026-06-01days on market $105,000 Active 105 DOM
-
2026-05-31days on market $105,000 Active 104 DOM
-
2026-02-16$105,000 Active
-
2024-10-22soldstatus $20,000
-
2024-10-10status Pending
-
2024-09-25historical Active - Contingent
-
2024-09-18$9,900 Active
-
2024-07-19soldstatus $2,500
-
2005-11-14soldstatus $59,200
-
1998-09-01soldstatus $70,000
ⓘ Source: listings_history table (triggers on properties + properties_extension) + one-shot
backfill from property_details.listing_events for pre-trigger history.
Tax reassessment forecast SC · Resets to sale price
- Current annual tax
- $559 · $47/mo
- Projected year-2 tax
- $598 · $50/mo
- Expected delta
- +$40/yr (+$3/mo · 7.1%)
ⓘ Screening estimate from a state-policy table — verify with the county assessor before closing.
Climate risk First Street
- Flood 1/10 Low FEMA zone X (unshaded) · 0% chance over 30 yrs
- Wildfire 3/10 Moderate
- Heat 7/10 Severe 7 d/yr ≥109°F today · 16 d/yr by 30 yrs out
- Wind 6/10 Major 66% chance of damaging wind over 30 yrs
- Air quality 3/10 Moderate 2 unhealthy d/yr today · 2 by 30 yrs out
Nearby sold comps map
Loading sold comps map…
Walkable amenities ~0.75 mi
Loading nearby amenities…
Taxation est. · year 1
- Rental income
- $15,665
- − Mortgage interest
- −$5,882
- − Property taxes
- −$559
- − Insurance
- −$525
- − Repairs & maintenance
- −$1,253
- − Management
- −$1,253
- − HOA
- −$3,096
- − Depreciation
- −$3,055
- Taxable income
- $43
- Est. tax owed @ 24.0%
- −$10
- After-tax cash flow
- $1,578/yr
For passive investors: Depreciation is non-cash, so a rental often shows a tax loss while cash-flowing — sheltering income. Rental losses are passive: they offset passive income freely, and up to $25,000/yr can offset ordinary (W-2) income if you actively participate and your MAGI is under $100k (phasing out to $0 by $150k); unused losses carry forward. On sale, claimed depreciation is recaptured at up to 25%, and gains may owe capital-gains tax (a 1031 exchange can defer both). Figures are a year-1 estimate at your 24.0% rate — not tax advice; consult a CPA.
Schools (NCES district)
- District
- Richland 01
- NCES district ID
- 4503360
- Math proficiency
- 26% ▼ -7.00%
- Reading proficiency
- 36% ▼ -5.00%
- Median HH income
- $38,931
- Composite
- 25.94/100
- National rank
- #7335
- State rank
- #54 of 80 in SC
Livability — Columbia
- Score
- 78/100
- State rank
- #18
- US rank
- #2436
Category grades
Schools grade is shown separately in the Schools card above.
Census & demographics
- Census place
- Columbia, SC
- County
- Richland County · 389,530 people
- City population
- 335,994
- Metro
- Columbia, SC
- Population (ZIP)
- 22,223
- Household income
- $64,231
- Rent vs Own
- Severe rent burden
- 1372.0
Population outlook (Richland County) Hauer SSP2
- Today (2025)
- 459,667 people
- By 2030
- 487,524 · +6.1%
- By 2040
- 542,035 · +17.9%
- By 2050
- 595,371 · +29.5%
- By 2075
- 732,998 · +59.5%
- By 2100
- 820,415 · +78.5%
Race, ethnicity, and origin ACS 2023
- Neighborhood character
- Predominantly White (73%)
- Race & ethnicity
- White 73% Black 16% Two or more races 6% Hispanic / Latino 5% Asian 3%
- Common ancestry
- Serbian 6% Slovak 4% Lithuanian 3%
- Foreign-born
- 4% · Canada, China
- Languages at home
- 93% English-only · Spanish 3% German/W. Germanic 1% Chinese 1%
Political lean MEDSL · Richland
- 2024 margin
- Solid D (+34.6) · D 66.4% · R 31.8% · Other 1.8%
- 2008→2024 swing
- +5.7pp toward D · 2008: 28.9pp · 2024: 34.6pp
- All cycles
- 2024: D+34.6 2020: D+38.3 2016: D+32.9 2012: D+33.3 2008: D+28.9
Not yet ingested
- Civics
- —
Market trends
- HPI YoY
- ▼ -457.47%
- Current HPI
- 230.5538
- Rent YoY
- ▲ 6.95%
- Metro
- Columbia, SC
- State GDP YoY
- ▲ 4.51%
- F500 in state
- 2
Industry mix (Fortune 500 HQ in SC)
| Industry | F500 HQs | Revenue |
|---|---|---|
| Packaging | 1 | $7B |
|
||
Price history
+50.0% since first listed8 events — show timeline
- 2026-02-16 Listed $105,000 Consolidated MLS
- 2024-10-22 Sold (Public Records) $20,000 Public Records
- 2024-10-10 Pending — Consolidated MLS
- 2024-09-25 Contingent — Consolidated MLS
- 2024-09-18 Listed $9,900 Consolidated MLS
- 2024-07-19 Sold (Public Records) $2,500 Public Records
- 2005-11-14 Sold (Public Records) $59,200 Public Records
- 1998-09-01 Sold (Public Records) $70,000 Public Records
Property tax history
+3.0%/yrLatest (2025): $559 · +12.5% YoY. Source: county tax records.
Cash-flow waterfall
monthlySold comps — $/sqft
last 12 mo · ≤1 miLoading sold comps…