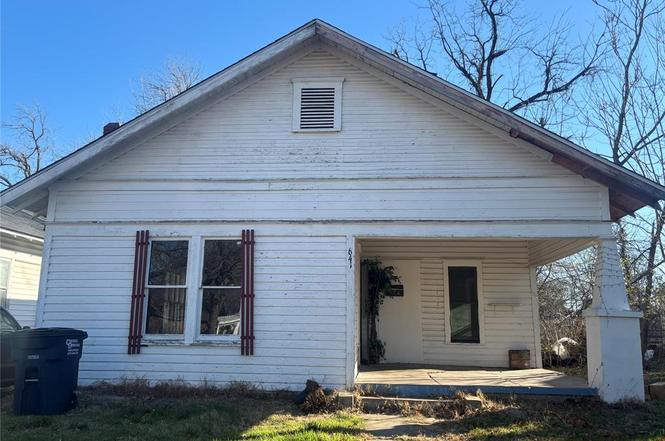
641 N Broadway · Shawnee, OK
Flood risk 1/10 · Minimal
- FEMA flood zone
- X (unshaded)
- Chance of flooding over 30 yrs
- 0.0%
- Est. flood insurance / yr
- $507 – $1,088
Fire risk 4/10 · Minor
- Est. fire insurance / yr
- $2,463 – $4,575
Heat risk 5/10 · Moderate
- Hot days now (above 109°F)
- 7 days/yr
- Hot days in 30 yrs
- 18 days/yr
Wind risk 3/10 · Minor
- Chance of severe wind over 30 yrs
- 5.0%
Air-quality risk 2/10 · Minimal
- Unhealthy air days now
- 1 days/yr
- Unhealthy air days in 30 yrs
- 1 days/yr
Risk factors via First Street. Map © Google.
Why this score? — see what drove the B+ grade
The composite is a weighted blend of 9 inputs, each scored 0–100. Each bar is that input's sub-score; the figure is the points it added to the 100-point composite (weight × sub-score).
- Cash flow +30.0/30.0
- ARV discount +15.0/15.0
- DSCR +10.0/10.0
- 1% rule +8.4/10.0
- Rent growth +3.2/5.0
- Livability +3.2/5.0
- Appreciation +2.7/10.0
- Condition / age +2.5/5.0
- Schools +1.1/10.0
$80,000
🖨 Deal sheet 📄 Offer letter ✓ Due diligence
Listing remarks
Charming Craftsman Investment Opportunity Near Downtown Adorable 3-bedroom, 1-bath Craftsman-style home just minutes from downtown! Full of character and charm, this property offers classic architectural details paired with fresh updates, including brand-new carpet throughout. The inviting layout features a cozy living area, functional kitchen, and three comfortably sized bedrooms. Ideal as a rental investment or starter home, this property offers strong income potential in a convenient location close to shopping, dining, and entertainment. Whether you're expanding your investment portfolio or looking for a home with timeless charm near the heart of the city, this one checks all the boxes.
Key facts
- Functional kitchen
- Cozy living area
- Fresh updates
Tags
Property features AI
Finance
- Other: Located in Estes W J addition; Homestead not indicated; Directions: From MacArthur go south on Broadway; the property is on the left
- Financial info: Assumable loans: No; Loan qualification: Unknown; Property listed as active and vacant
- HOA & community: No mandatory association dues
Exterior
- Utilities: No flood insurance indicated
- Home design: Single-family residence; One-level property; Residential property
- Construction: Frame construction; Composition roof; Conventional foundation; Built as existing property
- Exterior features: Covered porch; Lot includes other features
Interior
- Bedrooms: 3 bedrooms
- Bathrooms: 1 full bathroom
- Heating & cooling: Central electric heating
- Interior features: Mock fireplace; One living area
Neighborhood map
What this means for you Summary
Snapshot
- This is a 3-bed/1.0-bath single-family listed at $80k.
Deal economics
- At list price, monthly cash flow is $375 ($5k/yr) — positive.
- The deal already cash-flows at list — no discount required.
- Meets the 1% rule at list price ($1k rent vs $80k).
- Recommended offer: $73k (9.0% below list) — sets the bar for market timing.
- Cap rate 11.9% vs local median 3.9% in Shawnee — top-decile yield for the area; either an underpriced asset or a hidden risk that comps aren't pricing in. Stress-test before assuming the spread holds.
Location & tenants
- Location reads 63/100 on livability (#217 in OK) — a middle-class / working-renter tenant base. Strengths: cost of living A+, housing A+; Watch: crime F, amenities F, commute F.
- Shawnee (town): math 11% / reading 17% proficiency, ranked #238 of 270 in OK (top 88%) — low school quality limits family demand, transient renter base, plan for 1-2y turnover; 70% free/reduced lunch — lower-income household profile, screen leases tightly.
- Zoned schools: Jefferson Es (math 7% / reading 9%, grade F, #740 of 845 statewide, top 88%, 293 students, 0% FRL); Shawnee Hs (math 16% / reading 35%, grade F, #142 of 447 statewide, top 32%, 987 students, 0% FRL) — zoned schools average 0% FRL vs 70% district-wide (70 pts lower); this property's tenant base skews higher-income than the district average.
- Market conditions: Rents rising (+2.8%/yr); 192 active listings in the ZIP; 4 comparable units currently listed for rent nearby; rentals at typical pace (median 20d on market — plan ~3-4 weeks tenant-placement turnaround); 183 units permitted in Pottawatomie County in 2024 (16 in 5+ unit buildings).
Forward outlook
- Local home prices are declining (-3.0%/yr); year-one equity from $553 of loan paydown is wiped out by about $2k of value loss. Plan a longer hold.
- Pottawatomie County population projected at +12% by 2050 — modest demand growth; plan on rents tracking national, not racing it.
- At projected returns (-3.0% appreciation + 2.8% rent growth), your $22k cash investment doubles in ~7 years — after that, you're playing with house money.
Negotiation context
- It's been on market 115 days — a 9% lower offer ($73k) is reasonable based on typical stale-listing flexibility.
- 8 sale attempts since 3y ago; this cycle's ask is 9312% above the opening price — seller raised mid-cycle; expect resistance to lowballs.
Risks & watch-outs
- Watch-outs: built in 1940 — expect roof / HVAC / electrical / plumbing capex.
- Climate carrying-cost: extreme-heat days projected 7→18/yr by 2055 (HVAC capex compounding) — expect insurance premiums to compound above CPI over the hold.
Questions for the listing agent
- It's been on market 115 days. Have you received any prior offers? Is the seller open to a 9% concession, seller financing, or rate buy-down credit?
- Built in 1940 — when were the roof, HVAC, electrical panel, plumbing, and water heater last replaced?
- Why hasn't it sold? Are there any deal-killer items the seller is aware of (foundation, flood, title, zoning, code violations)?
- Is there a deadline driving the sale (1031 exchange, divorce, estate, relocation)? That informs how much negotiation room exists.
- Schools are F-rated, which usually means shorter tenancies and higher turnover. Who's the typical renter profile here, and what's been the actual vacancy rate?
- Crime grade is F in this area — have there been break-ins, vandalism, or insurance claims at this property in the last 3 years? What carrier currently insures it and at what premium?
- What's the average days-on-market for RENTAL listings here right now (not sales)? A rising rental-DOM trend means longer vacancies and softer asking-rent achievability than the comps imply.
- What's the recent tenant-quality profile in this submarket — average credit score on applications, eviction rate, late-payment / NSF rate, and stable-employment percentage? A property-management company in the area should have these aggregated.
- How much new for-sale + rental construction is in the pipeline within 1–3 miles? Heavy new supply typically softens prices + rents 12–24 months out; constrained supply supports both.
Investment metrics
- 1% rule
- 1.34% ✓
- Cap rate
- 11.92%
- Cash-on-cash
- 20.11%
- DSCR
- 1.89
- GRM
- 6.2
CMA / ARV
- ARV (on-the-fly)
- $119,505
- Comps found
- 12
Show comp detail 12 sales within ~0.75 mi
| Address | Dist | Beds/Ba | Sqft | Sold | Price | $/sf | Match |
|---|---|---|---|---|---|---|---|
| 542 W Wood St | 0.51mi | 3/1.0 | 1,288 (+0%) | 4mo | $125,000 | $97 | 72 |
| 706 N Louisa Ave | 0.34mi | 2/1.0 (-1) | 1,229 (-4%) | 3mo | $43,500 | $35 | 70 |
| 607 W Dewey St | 0.56mi | 3/1.0 | 1,306 (+2%) | 3mo | $129,000 | $99 | 69 |
| 508 E Wallace St | 0.37mi | 3/1.5 | 1,145 (-11%) | 3mo | $107,000 | $93 | 60 |
| 513 N Dorothy Ave | 0.68mi | 2/2.0 (-1) | 1,294 (+1%) | 2mo | $136,900 | $106 | 56 |
| 222 W Highland St | 0.33mi | 3/2.0 | 1,464 (+14%) | 2mo | $106,000 | $72 | 56 |
| 220 N Aydelotte Ave | 0.66mi | 3/1.5 | 1,186 (-8%) | 3mo | $43,500 | $37 | 52 |
| 619 N Chapman Ave | 0.51mi | 2/2.0 (-1) | 1,182 (-8%) | 3mo | $81,500 | $69 | 52 |
| 1207 N Beard Ave | 0.56mi | 3/1.5 | 1,428 (+11%) | 3mo | $110,000 | $77 | 51 |
| 1028 E Chandler St | 0.74mi | 3/1.5 | 1,180 (-8%) | 2mo | $129,000 | $109 | 48 |
| 515 W 10th St | 0.62mi | 3/2.0 | 1,131 (-12%) | 3mo | $43,500 | $38 | 45 |
| 531 N Ione Ave | 0.73mi | 2/1.0 (-1) | 1,161 (-10%) | 3mo | $115,000 | $99 | 42 |
Match score weights: distance 35% · size 25% · config 20% · recency 20%. Top-matched comps best support the ARV.
Projected returns pro-forma
-3.0% appreciation · 2.82% rent growth · sell at horizon
- IRR
- 12.1%
- Equity multiple
- 1.48×
- Total profit
- $10,716
- Equity at exit
- $11,928
- IRR
- 20.9%
- Equity multiple
- 2.75×
- Total profit
- $39,187
- Equity at exit
- $6,917
Cash invested: $22,400 (down + closing). Projections, not guarantees.
Landlord ↔ Tenant lean methodology
- Overall (STATE)
- 83 Strongly Landlord-Friendly
- State Oklahoma
- 83 Strongly Landlord-Friendly · R+20
- County
- — inherits STATE
- City
- — inherits STATE
ZIP-level market 74801
- Home prices YoY
- -1.7%
- Rents YoY
- 2.8%
- Active inventory
- 192
- Price-to-rent
- 6.2×
Monthly cashflow live
- Estimated rent
- $1,073 medium interval (Pro) →
- Mortgage (P&I)
- −$420
- Tax from tax record
- −$20 /mo · $235/yr
- Insurance
- −$33
- HOA
- −$0
- Vacancy / Maint / Mgmt
- −$225
- Net cashflow
- $375
Break-even live
UW: 25.0% down · 7.5% · 30yr · 1.5% tax · 5.0% vac · 8.0% maint · 8.0% mgmt
Financing live
Cash to close
- Down payment
- $20,000
- Closing costs
- $2,400
- Reserves months
- —
- Total cash needed
- —
Loan-product check · same deal, 3 products live
Conventional
25% down · 7.5% · 30yr
- Down + closing
- —
- Monthly P&I
- —
- Monthly cashflow
- —
- DSCR
- —
- Eligible?
- —
Personal DTI + credit; lowest rate.
DSCR
20% down · 8.5% · 30yr
- Down + closing
- —
- Monthly P&I
- —
- Monthly cashflow
- —
- DSCR
- —
- Eligible?
- —
No personal income docs; deal must DSCR.
Hard money
10% down · 12.0% · 12mo
- Down + closing
- —
- Monthly P&I
- —
- Monthly cashflow
- —
- DSCR
- —
- Eligible?
- —
Short-term bridge; refi at stabilization.
Rent comps 4 comps
| Address | Beds | Baths | Sqft | Rent | $/sqft | DOM | Units | Dist |
|---|---|---|---|---|---|---|---|---|
| 721 E Wallace St Shawnee, OK | 2.0 | 1.0 | 1176 | $850 | $0.72 | 4d | 1 | 0.54mi |
| 515 W 10th St Shawnee, OK | 3.0 | 1.0 | 1131 | $825 | $0.73 | 20d | 1 | 0.61mi |
| 319 S Center Ave Shawnee, OK | 3.0 | 2.0 | 1243 | $1,245 | $1.00 | 4d | 1 | 0.96mi |
| 315 S Kennedy Ave Shawnee, OK | 2.0–3.0 | 1.0–2.0 | 979 | $898 | $0.92 | 23d | 5 | 1.20mi |
Listing history 30 events
-
2026-06-19days on market $80,000 Active 115 DOM
-
2026-06-18days on market $80,000 Active 114 DOM
-
2026-06-17days on market $80,000 Active 113 DOM
-
2026-06-16days on market $80,000 Active 112 DOM
-
2026-06-15days on market $80,000 Active 111 DOM
-
2026-06-14days on market $80,000 Active 109 DOM
-
2026-06-12days on market $80,000 Active 108 DOM
-
2026-06-09days on market $80,000 Active 105 DOM
-
2026-06-08days on market $80,000 Active 104 DOM
-
2026-06-07days on market $80,000 Active 103 DOM
-
2026-06-05days on market $80,000 Active 100 DOM
-
2026-06-02days on market $80,000 Active 98 DOM
-
2026-06-01pricedays on market $80,000 Active 97 DOM
-
2026-05-31days on market $89,900 Active 96 DOM
-
2026-05-30pricedays on market $89,900 Active 95 DOM
-
2026-05-22$850
-
2026-05-04price $105,000
-
2026-04-25historical $850
-
2026-03-25$850
-
2026-02-22$115,000 Active
-
2026-02-06historical $850
-
2026-01-22$850
-
2025-12-29historical $850
-
2025-11-28$850
-
2025-06-19historical $850
-
2025-05-31$850
-
2023-10-17historical $850
-
2023-09-15$850
-
2023-09-15historical
-
2023-09-14
ⓘ Source: listings_history table (triggers on properties + properties_extension) + one-shot
backfill from property_details.listing_events for pre-trigger history.
Tax reassessment forecast OK · Resets to sale price
- Current annual tax
- $235 · $20/mo
- Projected year-2 tax
- $720 · $60/mo
- Expected delta
- +$485/yr (+$40/mo · 206.4%)
ⓘ Screening estimate from a state-policy table — verify with the county assessor before closing.
Climate risk First Street
- Flood 1/10 Low FEMA zone X (unshaded) · 0% chance over 30 yrs
- Wildfire 4/10 Moderate
- Heat 5/10 Major 7 d/yr ≥109°F today · 18 d/yr by 30 yrs out
- Wind 3/10 Moderate 5% chance of damaging wind over 30 yrs
- Air quality 2/10 Low 1 unhealthy d/yr today · 1 by 30 yrs out
Nearby sold comps map
Loading sold comps map…
Walkable amenities ~0.75 mi
Loading nearby amenities…
Taxation est. · year 1
- Rental income
- $12,878
- − Mortgage interest
- −$4,481
- − Property taxes
- −$235
- − Insurance
- −$400
- − Repairs & maintenance
- −$1,030
- − Management
- −$1,030
- − Depreciation
- −$2,327
- Taxable income
- $3,374
- Est. tax owed @ 24.0%
- −$810
- After-tax cash flow
- $3,695/yr
For passive investors: Depreciation is non-cash, so a rental often shows a tax loss while cash-flowing — sheltering income. Rental losses are passive: they offset passive income freely, and up to $25,000/yr can offset ordinary (W-2) income if you actively participate and your MAGI is under $100k (phasing out to $0 by $150k); unused losses carry forward. On sale, claimed depreciation is recaptured at up to 25%, and gains may owe capital-gains tax (a 1031 exchange can defer both). Figures are a year-1 estimate at your 24.0% rate — not tax advice; consult a CPA.
Schools (NCES district)
- District
- Shawnee
- NCES district ID
- 4027570
- Math proficiency
- 11% ▼ -10.00%
- Reading proficiency
- 17% ▼ -10.00%
- Median HH income
- $32,128
- Composite
- 11.21/100
- National rank
- #9724
- State rank
- #238 of 270 in OK
Livability — Shawnee
- Score
- 63/100
- State rank
- #217
- US rank
- #15593
Category grades
Schools grade is shown separately in the Schools card above.
Census & demographics
- Census place
- Shawnee, OK
- County
- Pottawatomie County · 45,194 people
- City population
- 45,194
- Metro
- Shawnee, OK
- Population (ZIP)
- 21,967
- Household income
- $55,077
- Rent vs Own
- Severe rent burden
- 594.0
Population outlook (Pottawatomie County) Hauer SSP2
- Today (2025)
- 76,622 people
- By 2030
- 78,816 · +2.9%
- By 2040
- 82,766 · +8.0%
- By 2050
- 86,031 · +12.3%
- By 2075
- 93,316 · +21.8%
- By 2100
- 95,820 · +25.1%
Race, ethnicity, and origin ACS 2023
- Neighborhood character
- Predominantly White (67%)
- Race & ethnicity
- White 67% Native American 15% Two or more races 10% Hispanic / Latino 7% Black 3%
- Hispanic origin (detail)
- Mexican 6%
- Common ancestry
- Lithuanian 1% Slovak 1% Italian 1%
- Foreign-born
- 2% · Canada
- Languages at home
- 96% English-only · Spanish 2% Other Asian/Pacific 1%
Political lean MEDSL · Pottawatomie
- 2024 margin
- Solid R (+47.4) · D 25.2% · R 72.7% · Other 2.1%
- 2008→2024 swing
- -9.1pp toward R · 2008: -38.4pp · 2024: -47.4pp
- All cycles
- 2024: R+47.4 2020: R+46.0 2016: R+46.5 2012: R+38.7 2008: R+38.4
Not yet ingested
- Civics
- —
Market trends
- HPI YoY
- ▼ -4.66%
- Current HPI
- 266.7965
- Rent YoY
- ▲ 2.82%
- Metro
- Shawnee, OK
- State GDP YoY
- ▲ 1.55%
- F500 in state
- 6
Industry mix (Fortune 500 HQ in OK)
| Industry | F500 HQs | Revenue |
|---|---|---|
| Energy | 3 | $48B |
|
||
Price history
-8.7% since first listed15 events — show timeline
- 2026-05-22 Listed for Rent $850 TURBOTENANT
- 2026-05-04 Price Changed $105,000 MLSOK
- 2026-04-25 Rental Removed $850 TURBOTENANT
- 2026-03-25 Listed for Rent $850 TURBOTENANT
- 2026-02-22 Listed $115,000 MLSOK
- 2026-02-06 Rental Removed $850 TURBOTENANT
- 2026-01-22 Listed for Rent $850 TURBOTENANT
- 2025-12-29 Rental Removed $850 TURBOTENANT
- 2025-11-28 Listed for Rent $850 TURBOTENANT
- 2025-06-19 Rental Removed $850 TURBOTENANT
- 2025-05-31 Listed for Rent $850 TURBOTENANT
- 2023-10-17 Rental Removed $850 APPFOLIO
- 2023-09-15 Listed for Rent $850 APPFOLIO
- 2023-09-15 Rental Removed — TURBOTENANT
- 2023-09-14 Listed for Rent — TURBOTENANT
Property tax history
-4.3%/yrLatest (2025): $235 · +4.4% YoY. Source: county tax records.
Cash-flow waterfall
monthlySold comps — $/sqft
last 12 mo · ≤1 miLoading sold comps…