2303 N Congress Ave #27 · Boynton Beach, FL
Flood risk 4/10 · Minor
- FEMA flood zone
- X (unshaded)
- Chance of flooding over 30 yrs
- 0.22%
- Est. flood insurance / yr
- $507 – $1,088
Fire risk 1/10 · Minimal
- Est. fire insurance / yr
- $947 – $1,759
Heat risk 9/10 · Severe
- Hot days now (above 105°F)
- 7 days/yr
- Hot days in 30 yrs
- 26 days/yr
Wind risk 10/10 · Severe
- Chance of severe wind over 30 yrs
- 99.0%
Air-quality risk 2/10 · Minimal
- Unhealthy air days now
- 1 days/yr
- Unhealthy air days in 30 yrs
- 2 days/yr
Risk factors via First Street. Map © Google.
Why this score? — see what drove the D grade
The composite is a weighted blend of 9 inputs, each scored 0–100. Each bar is that input's sub-score; the figure is the points it added to the 100-point composite (weight × sub-score).
- Cash flow +10.9/30.0
- ARV discount +7.5/15.0
- 1% rule +7.0/10.0
- Schools +4.3/10.0
- Livability +3.6/5.0
- DSCR +3.2/10.0
- Rent growth +2.7/5.0
- Condition / age +2.5/5.0
- Appreciation +0.0/10.0
$168,000
🖨 Deal sheet 📄 Offer letter ✓ Due diligence
Listing remarks
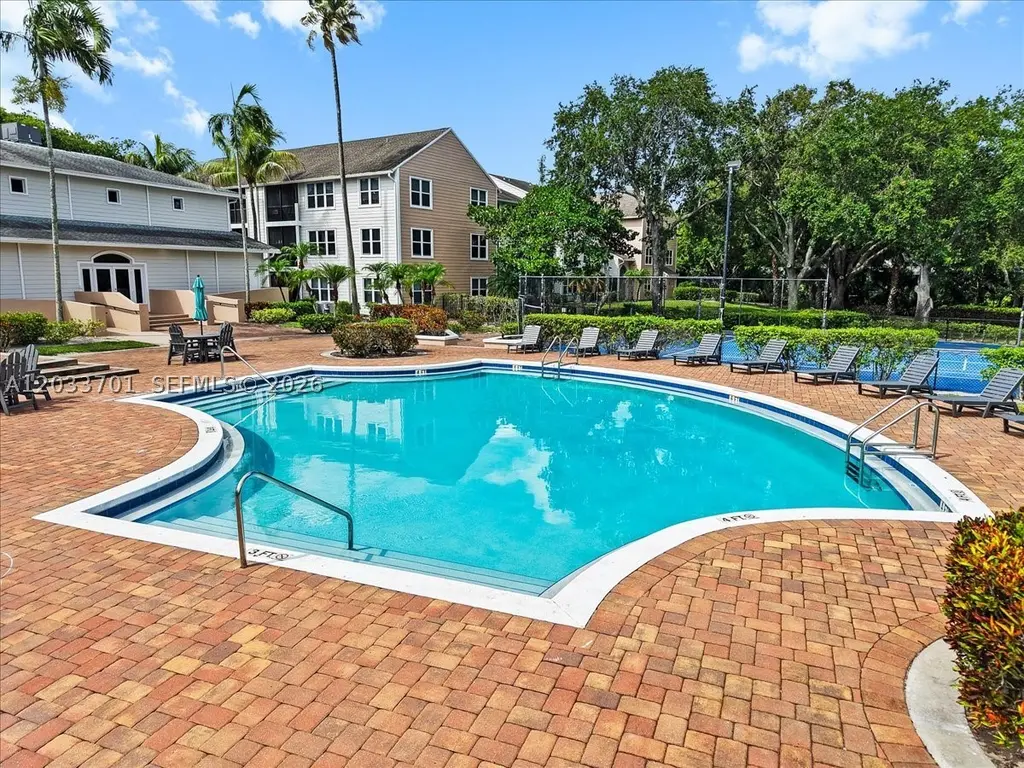
Beautifully maintained 2-bed, 1-bath condo in Boynton Landings featuring a split-bedroom layout, ceramic tile flooring, bright living and dining area, and peaceful lake views. Located on the second floor, this home includes a full-size washer and dryer, refrigerator, microwave, electric range, ample storage, assigned parking, and guest parking. Community amenities include a clubhouse, fitness center, and well-kept grounds. Conveniently located near major highways, shopping, dining, entertainment, and South Florida beaches. Also available for rent.
Key facts
- Guest parking
- Split-bedroom layout
- Assigned parking
Tags
Property features AI
Finance
- Financial info: Lease considered; Pets allowed
- HOA & community: Monthly association fee; Association fee covers amenities, pools, recreation facilities, roof, and security; Community amenities include basketball court, clubhouse, and fitness center
Exterior
- Parking: Detached 1-car garage; One covered parking space
- Security: Key card entry
- Utilities: Electric water heater
- Home design: 3 stories; Entry on level 2
- Construction: Frame and stucco construction; Year built unknown
- Exterior features: Storm/security shutters; Has a view; Property is attached
Interior
- Kitchen: Electric range; Microwave; Refrigerator
- Bedrooms: Bedroom on main level
- Flooring: Ceramic tile
- Bathrooms: 1 full bathroom
- Heating & cooling: Central heating; Central air conditioning (electric)
- Interior features: Bedroom on main level; Second floor entry; Living/dining room; Ceramic tile flooring
- Laundry & utility: Washer; Dryer; Electric water heater
Neighborhood map
What this means for you Summary
Snapshot
- This is a 1-bed/1.0-bath condo listed at $168k.
Deal economics
- At list price, monthly cash flow is $-74 ($-893/yr) — negative.
- To cash-flow at today's rent, offer at most $155k (7.8% below list).
- Meets the 1% rule at list price ($2k rent vs $168k).
- Recommended offer: $155k (7.8% below list) — sets the bar for cash-flow.
- Cap rate 5.8% vs local median 4.3% in Boynton Beach — top-decile yield for the area; either an underpriced asset or a hidden risk that comps aren't pricing in. Stress-test before assuming the spread holds.
Location & tenants
- Location reads 72/100 on livability (#351 in FL) — a middle-class / working-renter tenant base. Strengths: housing A+, health & safety B+, cost of living B; Watch: amenities D+, crime D-, commute F.
- Palm Beach (suburban): math 46% / reading 53% proficiency, ranked #34 of 73 in FL (top 47%) — families likely to look elsewhere, expect single-tenant / working-renter base with shorter leases.
- Market conditions: Rents flat; 227 active listings in the ZIP; 40 comparable units currently listed for rent nearby; rentals at typical pace (median 15d on market — plan ~3-4 weeks tenant-placement turnaround); 3,974 units permitted in Palm Beach County in 2024 (1,012 in 5+ unit buildings).
- This rent runs 33% of the median local income ($74k/yr) — at the standard rent-burdened threshold; future hikes will face affordability resistance.
Forward outlook
- Local home prices are declining (-3.0%/yr); year-one equity from $1k of loan paydown is wiped out by about $5k of value loss. Plan a longer hold.
- Palm Beach County population projected at +30% by 2050 — long-run rental-demand tailwind backs the buy-and-hold thesis.
Negotiation context
- Only 5 days on market — expect competitive offers; lowballing is unlikely to land.
- 9 sale attempts since 20y ago with the ask held roughly flat each time — persistent listings suggest the price (not the market) is what's stuck; bring a comps-based counter.
Risks & watch-outs
- Watch-outs: HOA is 23% of rent.
- Climate carrying-cost: severe wind risk, 99% chance of damaging wind over 30y; extreme-heat days projected 7→26/yr by 2055 (HVAC capex compounding) — expect insurance premiums to compound above CPI over the hold.
Questions for the listing agent
- What do current leases actually rent for vs. the listed asking? Can we see a recent rent roll and the last 12 months of T-12 income?
- What does the HOA fee cover, when was the last increase, and are there any pending special assessments or reserve-fund shortfalls?
- Any open or pending special assessments — roof, HVAC, plumbing, elevator, façade? What's the per-unit balance and payoff schedule, and is the seller paying it off at close or rolling it to the buyer?
- Is there a deadline driving the sale (1031 exchange, divorce, estate, relocation)? That informs how much negotiation room exists.
- Crime grade is D in this area — have there been break-ins, vandalism, or insurance claims at this property in the last 3 years? What carrier currently insures it and at what premium?
- The area grade is low — what's the realistic commute time and amenity access for the typical tenant pool here? Any planned neighborhood developments (good or bad) we should know about?
- What's the average days-on-market for RENTAL listings here right now (not sales)? A rising rental-DOM trend means longer vacancies and softer asking-rent achievability than the comps imply.
- What's the recent tenant-quality profile in this submarket — average credit score on applications, eviction rate, late-payment / NSF rate, and stable-employment percentage? A property-management company in the area should have these aggregated.
- How much new apartment / multifamily construction is in the pipeline within 1–3 miles? Heavy new supply (>2% of stock underway) typically softens rents 12–24 months out; light construction supports rent growth.
Investment metrics
- 1% rule
- 1.20% ✓
- Cap rate
- 5.76%
- Cash-on-cash
- -1.90%
- DSCR
- 0.92
- GRM
- 7.0
CMA / ARV
No comps found within radius.
Projected returns pro-forma
-3.0% appreciation · 0.93% rent growth · sell at horizon
- IRR
- -22.6%
- Equity multiple
- 0.24×
- Total profit
- $-35,730
- Equity at exit
- $25,049
- IRR
- -26.6%
- Equity multiple
- -0.11×
- Total profit
- $-52,002
- Equity at exit
- $14,526
Cash invested: $47,040 (down + closing). Projections, not guarantees.
Landlord ↔ Tenant lean methodology
- Overall (STATE)
- 87 Strongly Landlord-Friendly
- State Florida
- 87 Strongly Landlord-Friendly · R+3
- County
- — inherits STATE
- City
- — inherits STATE
ZIP-level market 33426
- Rents YoY
- 0.9%
- Active inventory
- 227
- Price-to-rent
- 7.0×
Monthly cashflow live
- Estimated rent
- $2,012 high interval (Pro) →
- Mortgage (P&I)
- −$881
- Tax from tax record
- −$243 /mo · $2,919/yr
- Insurance
- −$70
- HOA
- −$470
- Vacancy / Maint / Mgmt
- −$423
- Net cashflow
- $-74
Break-even live
UW: 25.0% down · 7.5% · 30yr · 1.5% tax · 5.0% vac · 8.0% maint · 8.0% mgmt
Financing live
Cash to close
- Down payment
- $42,000
- Closing costs
- $5,040
- Reserves months
- —
- Total cash needed
- —
Loan-product check · same deal, 3 products live
Conventional
25% down · 7.5% · 30yr
- Down + closing
- —
- Monthly P&I
- —
- Monthly cashflow
- —
- DSCR
- —
- Eligible?
- —
Personal DTI + credit; lowest rate.
DSCR
20% down · 8.5% · 30yr
- Down + closing
- —
- Monthly P&I
- —
- Monthly cashflow
- —
- DSCR
- —
- Eligible?
- —
No personal income docs; deal must DSCR.
Hard money
10% down · 12.0% · 12mo
- Down + closing
- —
- Monthly P&I
- —
- Monthly cashflow
- —
- DSCR
- —
- Eligible?
- —
Short-term bridge; refi at stabilization.
Rent comps 40 comps
| Address | Beds | Baths | Sqft | Rent | $/sqft | DOM | Units | Dist |
|---|---|---|---|---|---|---|---|---|
| 2303 N Congress Ave #15 Boynton Beach, FL | 2.0 | 1.0 | 925 | $1,950 | $2.11 | 24d | 1 | 0.01mi |
| 2307 N Congress Ave #24 Boynton Beach, FL | 2.0 | 1.0 | 902 | $1,700 | $1.88 | 3d | 1 | 0.04mi |
| 2301 N Congress Ave #25 Boynton Beach, FL | 2.0 | 1.0 | 758 | $2,000 | $2.64 | 24d | 1 | 0.05mi |
| 4101 Mahogany Dr Boynton Beach, FL | 1.0–2.0 | 1.0–2.0 | 950 | $1,584 | $1.67 | 3d | 11 | 0.07mi |
| 2313 N Congress Ave #18 Boynton Beach, FL | 2.0 | 1.0 | 758 | $1,950 | $2.57 | 15d | 1 | 0.08mi |
| 2317 N Congress Ave #24 Boynton Beach, FL | 2.0 | 1.0 | 902 | $2,300 | $2.55 | 5d | 1 | 0.13mi |
| 1831 Renaissance Commons Blvd Boynton Beach, FL | 2.0 | 2.0 | 975 | $2,230 | $2.29 | 5d | 1 | 0.30mi |
| 1831 Renaissance Commons Blvd Boynton Beach, FL | 1.0 | 1.0 | 840 | $1,840 | $2.19 | 15d | 1 | 0.30mi |
| 1831 Renaissance Commons Blvd Boynton Beach, FL | 2.0 | 2.0 | 975 | $2,210 | $2.27 | 24d | 1 | 0.30mi |
| 6 Via de Casas Sur #104 Boynton Beach, FL | 2.0 | 2.0 | 996 | $2,195 | $2.20 | 24d | 1 | 0.37mi |
| 220 Savannah Lakes Dr Boynton Beach, FL | 2.0 | 2.0 | 1098 | $2,365 | $2.15 | 3d | 1 | 0.38mi |
| 1605 Renaissance Commons Blvd Boynton Beach, FL | 1.0–3.0 | 1.0–2.0 | 1148 | $1,951 | $1.70 | 2d | 12 | 0.40mi |
| 1690 Renaissance Commons Blvd Boynton Beach, FL | 2.0 | 2.0 | 1074 | $2,275 | $2.12 | 19d | 3 | 0.42mi |
| 1690 Renaissance Commons Blvd Boynton Beach, FL | 1.0–2.0 | 1.0–2.0 | 977 | $1,975 | $2.02 | 21d | 3 | 0.42mi |
| 1660 Renaissance Commons Blvd Boynton Beach, FL | 1.0–2.0 | 1.0–2.0 | 932 | $1,975 | $2.12 | 17d | 2 | 0.43mi |
| 1660 Renaissance Commons Blvd #2329 Boynton Beach, FL | 1.0 | 1.0 | 852 | $1,975 | $2.32 | 3d | 1 | 0.44mi |
| 1660 Renaissance Commons Blvd #2122 Boynton Beach, FL | 2.0 | 2.0 | 1012 | $2,450 | $2.42 | 24d | 1 | 0.44mi |
| 1645 Renaissance Commons Blvd Boynton Beach, FL | 1.0 | 1.0 | 817 | $2,114 | $2.59 | 22d | 1 | 0.44mi |
| 15 Via de Casas Sur #204 Boynton Beach, FL | 2.0 | 2.0 | 996 | $2,400 | $2.41 | 24d | 1 | 0.45mi |
| 1701 Renaissance Commons Blvd Boynton Beach, FL | 2.0 | 2.0 | 922 | $2,629 | $2.85 | 11d | 1 | 0.45mi |
| 1701 Renaissance Commons Blvd Boynton Beach, FL | 1.0–2.0 | 1.0–2.0 | 846 | $2,057 | $2.43 | 2d | 1 | 0.45mi |
| 4408 Renaissance Way Unit 408 Boynton Beach, FL | 2.0 | 2.0 | 1048 | $2,350 | $2.24 | 17d | 1 | 0.46mi |
| 4408 Renaissance Way Boynton Beach, FL | 2.0 | 2.0 | 1048 | $2,350 | $2.24 | 12d | 1 | 0.46mi |
| 2407 Renaissance Way Boynton Beach, FL | 1.0 | 1.0 | 744 | $1,950 | $2.62 | 8d | 1 | 0.46mi |
| 3308 Renaissance Way Boynton Beach, FL | 2.0 | 2.0 | 1119 | $2,300 | $2.06 | 5d | 1 | 0.46mi |
| 2401 Renaissance Way Boynton Beach, FL | 2.0 | 2.0 | 1048 | $2,400 | $2.29 | 24d | 1 | 0.46mi |
| 3500 Sandpiper Dr Boynton Beach, FL | 1.0–2.0 | 1.0–2.0 | 1147 | $1,894 | $1.65 | 22d | 22 | 0.52mi |
| 4 Renaissance Way #302 Boynton Beach, FL | 1.0 | 1.0 | 747 | $1,945 | $2.60 | 11d | 1 | 0.53mi |
| 3 Renaissance Way #210 Boynton Beach, FL | 1.0 | 1.0 | 912 | $1,850 | $2.03 | 5d | 1 | 0.54mi |
| 3930 Max Pl Boynton Beach, FL | 1.0 | 1.0 | 925 | $2,550 | $2.76 | 22d | 1 | 0.59mi |
| 1100 Audace Ave Boynton Beach, FL | 1.0–3.0 | 1.0–2.0 | 1063 | $2,442 | $2.30 | 2d | 24 | 0.76mi |
| 1000 Audace Ave Boynton Beach, FL | 1.0 | 1.0 | 800 | $2,180 | $2.73 | 17d | 1 | 0.77mi |
| 1000 Audace Ave Boynton Beach, FL | 1.0 | 1.0 | 800 | $2,180 | $2.73 | 22d | 1 | 0.77mi |
| 2700 Quantum Lakes Dr Boynton Beach, FL | 1.0–3.0 | 1.0–2.0 | 1328 | $1,800 | $1.35 | 2d | 164 | 0.82mi |
| 600 Sealofts Dr Boynton Beach, FL | 1.0 | 1.0 | 882 | $2,476 | $2.81 | 4d | 1 | 1.10mi |
| 600 Sealofts Dr Boynton Beach, FL | 1.0 | 1.0 | 882 | $2,360 | $2.68 | 2d | 1 | 1.10mi |
| 600 Sealofts Dr Boynton Beach, FL | 1.0–3.0 | 1.0–2.5 | 1217 | $2,170 | $1.78 | 1d | 17 | 1.10mi |
| 600 Sealofts Dr Boynton Beach, FL | 2.0 | 2.0 | 1066 | $2,716 | $2.55 | 3d | 1 | 1.10mi |
| 8949 Oak St Boynton Beach, FL | 2.0 | 2.0 | 1040 | $1,300 | $1.25 | 24d | 1 | 1.14mi |
| 3601 High Ridge Rd Unit 206 Boynton Beach, FL | 1.0 | 1.0 | 833 | $1,950 | $2.34 | 15d | 1 | 1.20mi |
HOA detail condo
- Monthly dues
- $470 · $5,640/yr
- Likely covers
- electriclandscapinggymparking
- Assessments
- None detected in remarks — confirm with the listing agent.
Listing history 6 events
-
2026-06-18days on market $168,000 Active 5 DOM
-
2026-06-17days on market $168,000 Active 4 DOM
-
2026-06-16days on market $168,000 Active 3 DOM
-
2026-06-15days on market $168,000 Active 2 DOM
-
2026-06-13remarks 553-char remark
-
2026-06-13$168,000 Active 1 DOM
ⓘ Source: listings_history table (triggers on properties + properties_extension) + one-shot
backfill from property_details.listing_events for pre-trigger history.
Tax reassessment forecast FL · Resets to sale price
- Current annual tax
- $2,919 · $243/mo
- Projected year-2 tax
- $2,919 · $243/mo
- Expected delta
- $0/yr ($0/mo · -0.0%)
ⓘ Screening estimate from a state-policy table — verify with the county assessor before closing.
Climate risk First Street
- Flood 4/10 Moderate FEMA zone X (unshaded) · 22% chance over 30 yrs
- Wildfire 1/10 Low
- Heat 9/10 Extreme 7 d/yr ≥105°F today · 26 d/yr by 30 yrs out
- Wind 10/10 Extreme 99% chance of damaging wind over 30 yrs
- Air quality 2/10 Low 1 unhealthy d/yr today · 2 by 30 yrs out
Nearby sold comps map
Loading sold comps map…
Walkable amenities ~0.75 mi
Loading nearby amenities…
Taxation est. · year 1
- Rental income
- $24,149
- − Mortgage interest
- −$9,411
- − Property taxes
- −$2,919
- − Insurance
- −$840
- − Repairs & maintenance
- −$1,932
- − Management
- −$1,932
- − HOA
- −$5,640
- − Depreciation
- −$4,887
- Taxable loss
- −$3,411
- Est. tax savings @ 24.0%
- +$819
- After-tax cash flow
- $-74/yr
For passive investors: Depreciation is non-cash, so a rental often shows a tax loss while cash-flowing — sheltering income. Rental losses are passive: they offset passive income freely, and up to $25,000/yr can offset ordinary (W-2) income if you actively participate and your MAGI is under $100k (phasing out to $0 by $150k); unused losses carry forward. On sale, claimed depreciation is recaptured at up to 25%, and gains may owe capital-gains tax (a 1031 exchange can defer both). Figures are a year-1 estimate at your 24.0% rate — not tax advice; consult a CPA.
Schools (NCES district)
- District
- Palm Beach
- NCES district ID
- 1201500
- Math proficiency
- 46% ▼ -16.00%
- Reading proficiency
- 53% ▼ -4.00%
- Median HH income
- $53,943
- Composite
- 42.72/100
- National rank
- #3160
- State rank
- #34 of 73 in FL
Livability — Boynton Beach
- Score
- 72/100
- State rank
- #351
- US rank
- #6098
Category grades
Schools grade is shown separately in the Schools card above.
Census & demographics
- Census place
- Boynton Beach, FL
- County
- Palm Beach County · 1,438,312 people
- City population
- 148,060
- Metro
- Miami-Fort Lauderdale-Pompano Beach, FL
- Population (ZIP)
- 24,255
- Household income
- $74,223
- Rent vs Own
- Severe rent burden
- 1417.0
Population outlook (Palm Beach County) Hauer SSP2
- Today (2025)
- 1,637,487 people
- By 2030
- 1,743,255 · +6.5%
- By 2040
- 1,948,712 · +19.0%
- By 2050
- 2,132,979 · +30.3%
- By 2075
- 2,530,027 · +54.5%
- By 2100
- 2,706,979 · +65.3%
Race, ethnicity, and origin ACS 2023
- Neighborhood character
- Diverse neighborhood (Simpson 0.66)
- Race & ethnicity
- White 51% Black 23% Hispanic / Latino 17% Two or more races 14% Asian 4%
- Hispanic origin (detail)
- Puerto Rican 3% Cuban 2%
- Common ancestry
- Hispanic 9% Romanian 2% Lithuanian 2%
- Foreign-born
- 29% · Canada, Jamaica, Vietnam
- Languages at home
- 66% English-only · Spanish 16% French/Haitian/Cajun 11% Other Indo-European 5%
Political lean MEDSL · Palm Beach
- 2024 margin
- Toss-up / Even · D 50.0% · R 49.2%
- 2008→2024 swing
- -22.1pp toward R · 2008: 22.9pp · 2024: 0.8pp
- All cycles
- 2024: D+0.8 2020: D+12.8 2016: D+15.3 2012: D+17.0 2008: D+22.9
Not yet ingested
- Civics
- —
Market trends
- HPI YoY
- ▼ -205.96%
- Current HPI
- 335.3805
- Rent YoY
- ▲ 0.93%
- Metro
- Miami-Fort Lauderdale-Pompano Beach, FL
- State GDP YoY
- ▲ 3.28%
- F500 in state
- 36
Industry mix (Fortune 500 HQ in FL)
| Industry | F500 HQs | Revenue |
|---|---|---|
| Industrial Technology | 2 | $29B |
|
||
| Insurance | 2 | $17B |
|
||
| Retail | 1 | $60B |
|
||
| Technology Distribution | 1 | $58B |
|
||
| Homebuilding | 1 | $35B |
|
||
| Technology Manufacturing | 1 | $35B |
|
||
Price history
-11.1% since first listed26 events — show timeline
- 2026-06-13 Listed $168,000 MARMLS
- 2024-04-09 Listing Removed — MARMLS
- 2024-02-12 Listed $195,000 MARMLS
- 2024-01-05 Listing Removed — Beaches MLS
- 2023-11-09 Price Changed $210,000 Beaches MLS
- 2023-10-28 Price Changed $225,000 Beaches MLS
- 2023-08-29 Relisted — Beaches MLS
- 2023-08-28 Listing Removed — Beaches MLS
- 2023-08-28 Price Changed $235,000 Beaches MLS
- 2023-08-04 Price Changed $205,000 Beaches MLS
- 2023-07-28 Listed $220,000 Beaches MLS
- 2023-04-20 Sold (Public Records) $163,000 Public Records
- 2023-04-20 Sold (Public Records) $163,000 Public Records
- 2014-05-27 Listing Removed — Beaches MLS
- 2013-12-02 Listing Removed — Beaches MLS
- 2013-10-21 Sold (Public Records) $65,000 Public Records
- 2013-10-20 Pending — Beaches MLS
- 2013-10-15 Sold (MLS) $65,000 Beaches MLS
- 2013-09-13 Price Changed $73,900 Beaches MLS
- 2013-09-13 Listed $74,900 Beaches MLS
- 2009-01-01 Listing Removed — Beaches MLS
- 2008-01-02 Listed $139,900 Beaches MLS
- 2007-08-17 Listing Removed — Beaches MLS
- 2007-08-17 Listed $139,900 Beaches MLS
- 2007-06-29 Listed $142,000 Beaches MLS
- 2006-08-09 Listed $189,000 Beaches MLS
Property tax history
+8.9%/yrLatest (2025): $2,919 · -9.3% YoY. Source: county tax records.
Cash-flow waterfall
monthlySold comps — $/sqft
last 12 mo · ≤1 miLoading sold comps…