2 Lilac Dr · Rochester, NH
Flood risk 1/10 · Minimal
- FEMA flood zone
- X
- Chance of flooding over 30 yrs
- 0.0%
- Est. flood insurance / yr
- $435 – $905
Fire risk 1/10 · Minimal
- Est. fire insurance / yr
- $507 – $941
Heat risk 4/10 · Minor
- Hot days now (above threshold)
- 7 days/yr
- Hot days in 30 yrs
- 15 days/yr
Wind risk No data
- Chance of severe wind over 30 yrs
- —
Air-quality risk 2/10 · Minimal
- Unhealthy air days now
- 1 days/yr
- Unhealthy air days in 30 yrs
- 1 days/yr
Risk factors via First Street. Map © Google.
Why this score? — see what drove the D+ grade
The composite is a weighted blend of 9 inputs, each scored 0–100. Each bar is that input's sub-score; the figure is the points it added to the 100-point composite (weight × sub-score).
- Cash flow +19.8/30.0
- DSCR +6.3/10.0
- 1% rule +4.9/10.0
- Livability +4.2/5.0
- Rent growth +3.6/5.0
- Schools +2.7/10.0
- Condition / age +2.5/5.0
- ARV discount +2.2/15.0
- Appreciation +0.0/10.0
$247,900
🖨 Deal sheet 📄 Offer letter ✓ Due diligence
Listing remarks MLS
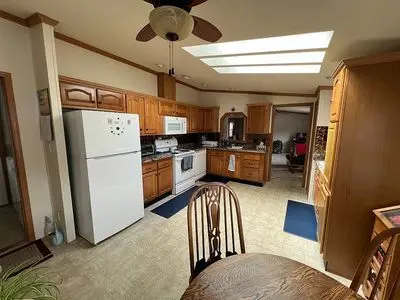
2004 DOUBLE WIDE WITH 10X27 FARMER'S PORCH, OUTBUILDING, CORNER LOT. 3 BR, 2 FULL BATHS, AND AMPLE CABINETS/COUNTER SPACE & APPLIANCES. SKYLIGHT REPLACED IN JAN 2011. CENTRAL AIR, VINYL TILT WINDOWS, VAULTED CEILINGS AND PRIVATE BATH OFF MASTER WITH A JET TUB. GOOD CLOSET & STORAGE SPACE. FHA HEAT.
Key facts
- New furnace
- Outbuilding
- New washer and dryer
Tags
Neighborhood map
What this means for you Summary
Snapshot
- This is a 3-bed/1.5-bath manufactured listed at $248k.
Deal economics
- At list price, monthly cash flow is $297 ($4k/yr) — positive.
- The deal already cash-flows at list — no discount required.
- To meet the 1% rule (rent ≥ 1% of price), the offer needs to be $246k (0.7% below list).
- Recommended offer: $246k (0.7% below list) — sets the bar for 1% rule.
- Cap rate 7.7% vs local median 3.6% in Rochester — top-decile yield for the area; either an underpriced asset or a hidden risk that comps aren't pricing in. Stress-test before assuming the spread holds.
Location & tenants
- Location reads 84/100 on livability (#8 in NH, #698 nationally) — a professional / high-income tenant draw. Strengths: crime A+, commute A+, cost of living A+; Watch: amenities C-.
- Rochester School District (suburban): math 27% / reading 35% proficiency, ranked #83 of 98 in NH (top 85%) — families likely to look elsewhere, expect single-tenant / working-renter base with shorter leases.
- Market conditions: Rents rising fast (+4.2%/yr); 108 active listings in the ZIP; 1 comparable units currently listed for rent nearby; solid renter incomes; 951 units permitted in Strafford County in 2024 (551 in 5+ unit buildings).
- This rent runs 38% of the median local income ($79k/yr) — at the standard rent-burdened threshold; future hikes will face affordability resistance.
Forward outlook
- Local home prices are declining (-3.0%/yr); year-one equity from $2k of loan paydown is wiped out by about $7k of value loss. Plan a longer hold.
- Strafford County population projected at +7% by 2050 — modest demand growth; plan on rents tracking national, not racing it.
Negotiation context
- Only 10 days on market — expect competitive offers; lowballing is unlikely to land.
- 2 sale attempts since 16y ago; this cycle's ask is 68% above the opening price — seller raised mid-cycle; expect resistance to lowballs.
- Current owner paid $60k; list at $248k implies a 313% gain — meaningful room to come down on a strong offer.
Questions for the listing agent
- Is there a deadline driving the sale (1031 exchange, divorce, estate, relocation)? That informs how much negotiation room exists.
- The area grade is low — what's the realistic commute time and amenity access for the typical tenant pool here? Any planned neighborhood developments (good or bad) we should know about?
- What's the average days-on-market for RENTAL listings here right now (not sales)? A rising rental-DOM trend means longer vacancies and softer asking-rent achievability than the comps imply.
- What's the recent tenant-quality profile in this submarket — average credit score on applications, eviction rate, late-payment / NSF rate, and stable-employment percentage? A property-management company in the area should have these aggregated.
- How much new for-sale + rental construction is in the pipeline within 1–3 miles? Heavy new supply typically softens prices + rents 12–24 months out; constrained supply supports both.
Investment metrics
- 1% rule
- 0.99% ✗
- Cap rate
- 7.73%
- Cash-on-cash
- 5.13%
- DSCR
- 1.23
- GRM
- 8.4
CMA / ARV
- ARV (on-the-fly)
- $221,616
- Comps found
- 12
Show comp detail 12 sales within ~0.75 mi
| Address | Dist | Beds/Ba | Sqft | Sold | Price | $/sf | Match |
|---|---|---|---|---|---|---|---|
| 5 N Fuchsia Dr | 0.29mi | 3/1.5 | 1,296 (0%) | 6mo | $157,500 | $122 | 81 |
| 9 S Blueberry Ln | 0.16mi | 2/1.5 (-1) | 1,257 (-3%) | 6mo | $90,000 | $72 | 78 |
| 4 Lilac Dr | 0.10mi | 2/2.0 (-1) | 1,333 (+3%) | 8mo | $265,000 | $199 | 77 |
| 5 Easter Ln | 0.31mi | 3/2.0 | 1,333 (+3%) | 9mo | $299,900 | $225 | 71 |
| 6 Dockside Ln | 0.37mi | 3/2.0 | 1,333 (+3%) | 9mo | $295,000 | $221 | 69 |
| 2 N Blueberry Ln | 0.16mi | 3/2.0 | 1,404 (+8%) | 10mo | $240,000 | $171 | 68 |
| 10 Roseberry Ln | 0.26mi | 2/2.0 (-1) | 1,392 (+7%) | 7mo | $195,000 | $140 | 62 |
| 23 S Cranberry Ln | 0.31mi | 3/2.0 | 1,400 (+8%) | 10mo | $245,000 | $175 | 62 |
| 12 Caribbean Ln | 0.33mi | 2/2.0 (-1) | 1,238 (-4%) | 12mo | $169,000 | $137 | 60 |
| 4 S Blueberry Ln | 0.19mi | 2/2.0 (-1) | 1,380 (+6%) | 17mo | $160,200 | $116 | 59 |
| 22 S Blueberry Ln | 0.30mi | 3/2.0 | 1,152 (-11%) | 8mo | $224,900 | $195 | 59 |
| 20 S Blueberry Ln | 0.28mi | 2/1.5 (-1) | 1,106 (-15%) | 12mo | $130,000 | $118 | 48 |
Match score weights: distance 35% · size 25% · config 20% · recency 20%. Top-matched comps best support the ARV.
Projected returns pro-forma
-3.0% appreciation · 4.22% rent growth · sell at horizon
- IRR
- -7.0%
- Equity multiple
- 0.74×
- Total profit
- $-18,226
- Equity at exit
- $36,963
- IRR
- 4.0%
- Equity multiple
- 1.31×
- Total profit
- $21,300
- Equity at exit
- $21,434
Cash invested: $69,412 (down + closing). Projections, not guarantees.
Landlord ↔ Tenant lean methodology
- Overall (STATE)
- 56 Moderately Landlord-Leaning
- State New Hampshire
- 56 Moderately Landlord-Leaning · D+1
- County
- — inherits STATE
- City
- — inherits STATE
ZIP-level market 03867
- Home prices YoY
- -22.0%
- Rents YoY
- 4.2%
- Active inventory
- 108
- Price-to-rent
- 8.4×
Monthly cashflow live
- Estimated rent
- $2,461 medium interval (Pro) →
- Mortgage (P&I)
- −$1,300
- Tax from tax record
- −$244 /mo · $2,928/yr
- Insurance
- −$103
- HOA
- −$0
- Vacancy / Maint / Mgmt
- −$517
- Net cashflow
- $297
Break-even live
UW: 25.0% down · 7.5% · 30yr · 1.5% tax · 5.0% vac · 8.0% maint · 8.0% mgmt
Financing live
Cash to close
- Down payment
- $61,975
- Closing costs
- $7,437
- Reserves months
- —
- Total cash needed
- —
Loan-product check · same deal, 3 products live
Conventional
25% down · 7.5% · 30yr
- Down + closing
- —
- Monthly P&I
- —
- Monthly cashflow
- —
- DSCR
- —
- Eligible?
- —
Personal DTI + credit; lowest rate.
DSCR
20% down · 8.5% · 30yr
- Down + closing
- —
- Monthly P&I
- —
- Monthly cashflow
- —
- DSCR
- —
- Eligible?
- —
No personal income docs; deal must DSCR.
Hard money
10% down · 12.0% · 12mo
- Down + closing
- —
- Monthly P&I
- —
- Monthly cashflow
- —
- DSCR
- —
- Eligible?
- —
Short-term bridge; refi at stabilization.
Rent comps 1 comps
| Address | Beds | Baths | Sqft | Rent | $/sqft | DOM | Units | Dist |
|---|---|---|---|---|---|---|---|---|
| 122 Asteria Ln Rochester, NH | 1.0–2.0 | 1.0 | 868 | $2,300 | $2.65 | 2d | 11 | 1.08mi |
Listing history 20 events
-
2026-06-18days on market $247,900 Active 10 DOM
-
2026-06-17days on market $247,900 Active 9 DOM
-
2026-06-16days on market $247,900 Active 8 DOM
-
2026-06-15days on market $247,900 Active 7 DOM
-
2026-06-13days on market $247,900 Active 5 DOM
-
2026-06-13days on market $247,900 Active 4 DOM
-
2026-06-08remarks 410-char remark
-
2026-06-08pricedays on market $247,900 Active 1 DOM
-
2026-06-07days on market $147,900 Active 15 DOM
-
2026-06-04days on market $147,900 Active 12 DOM
-
2026-06-03days on market $147,900 Active 11 DOM
-
2026-06-02days on market $147,900 Active 10 DOM
-
2026-06-01days on market $147,900 Active 9 DOM
-
2026-05-31days on market $147,900 Active 8 DOM
-
2026-05-24$147,900 Active
-
2017-10-20soldstatus $60,000
-
2011-05-10soldstatus $60,000 311-char remark
Show marketing remark (311 chars)
2004 DOUBLE WIDE WITH 10X27 FARMER'S PORCH, OUTBUILDING, CORNER LOT. 3 BR, 2 FULL BATHS, AND AMPLE CABINETS/COUNTER SPACE & APPLIANCES. SKYLIGHT REPLACED IN JAN 2011. CENTRAL AIR, VINYL TILT WINDOWS, VAULTED CEILINGS AND PRIVATE BATH OFF MASTER WITH A JET TUB. GOOD CLOSET & STORAGE SPACE. FHA HEAT.
-
2010-09-24$69,900 311-char remark
Show marketing remark (311 chars)
2004 DOUBLE WIDE WITH 10X27 FARMER'S PORCH, OUTBUILDING, CORNER LOT. 3 BR, 2 FULL BATHS, AND AMPLE CABINETS/COUNTER SPACE & APPLIANCES. SKYLIGHT REPLACED IN JAN 2011. CENTRAL AIR, VINYL TILT WINDOWS, VAULTED CEILINGS AND PRIVATE BATH OFF MASTER WITH A JET TUB. GOOD CLOSET & STORAGE SPACE. FHA HEAT.
-
2004-06-16soldstatus $89,900
-
2004-04-05soldstatus $35,000
ⓘ Source: listings_history table (triggers on properties + properties_extension) + one-shot
backfill from property_details.listing_events for pre-trigger history.
Tax reassessment forecast NH · Partial reset (capped growth)
- Current annual tax
- $2,928 · $244/mo
- Projected year-2 tax
- $4,166 · $347/mo
- Expected delta
- +$1,238/yr (+$103/mo · 42.3%)
ⓘ Screening estimate from a state-policy table — verify with the county assessor before closing.
Climate risk First Street
- Flood 1/10 Low FEMA zone X · 0% chance over 30 yrs
- Wildfire 1/10 Low
- Heat 4/10 Moderate
- Air quality 2/10 Low 1 unhealthy d/yr today · 1 by 30 yrs out
Nearby sold comps map
Loading sold comps map…
Walkable amenities ~0.75 mi
Loading nearby amenities…
Taxation est. · year 1
- Rental income
- $29,528
- − Mortgage interest
- −$13,886
- − Property taxes
- −$2,928
- − Insurance
- −$1,240
- − Repairs & maintenance
- −$2,362
- − Management
- −$2,362
- − Depreciation
- −$7,212
- Taxable loss
- −$462
- Est. tax savings @ 24.0%
- +$111
- After-tax cash flow
- $3,670/yr
For passive investors: Depreciation is non-cash, so a rental often shows a tax loss while cash-flowing — sheltering income. Rental losses are passive: they offset passive income freely, and up to $25,000/yr can offset ordinary (W-2) income if you actively participate and your MAGI is under $100k (phasing out to $0 by $150k); unused losses carry forward. On sale, claimed depreciation is recaptured at up to 25%, and gains may owe capital-gains tax (a 1031 exchange can defer both). Figures are a year-1 estimate at your 24.0% rate — not tax advice; consult a CPA.
Schools (NCES district)
- District
- Rochester School District
- NCES district ID
- 3305940
- Math proficiency
- 27% ▼ -15.00%
- Reading proficiency
- 35% ▼ -14.00%
- Median HH income
- $51,080
- Composite
- 27.11/100
- National rank
- #7039
- State rank
- #83 of 98 in NH
Livability — Rochester
- Score
- 84/100
- State rank
- #8
- US rank
- #698
Category grades
Schools grade is shown separately in the Schools card above.
Census & demographics
- Census place
- Rochester, NH
- County
- Strafford County · 75,181 people
- City population
- 22,732
- Metro
- Boston-Cambridge-Newton, MA-NH
- Population (ZIP)
- 22,732
- Household income
- $78,674
- Rent vs Own
- Severe rent burden
- 663.0
Population outlook (Strafford County) Hauer SSP2
- Today (2025)
- 132,503 people
- By 2030
- 135,377 · +2.2%
- By 2040
- 139,609 · +5.4%
- By 2050
- 141,803 · +7.0%
- By 2075
- 149,280 · +12.7%
- By 2100
- 148,667 · +12.2%
Race, ethnicity, and origin ACS 2023
- Neighborhood character
- Predominantly White (93%)
- Race & ethnicity
- White 93% Two or more races 4% Hispanic / Latino 2% Asian 1%
- Common ancestry
- Lithuanian 12% Romanian 2% Serbian 2%
- Foreign-born
- 3% · Canada
- Languages at home
- 96% English-only · Spanish 1% French/Haitian/Cajun 1%
Political lean MEDSL · Strafford
- 2024 margin
- D (+12.1) · D 55.5% · R 43.5% · Other 1.0%
- 2008→2024 swing
- -8.3pp toward R · 2008: 20.4pp · 2024: 12.1pp
- All cycles
- 2024: D+12.1 2020: D+15.2 2016: D+8.6 2012: D+14.5 2008: D+20.4
Not yet ingested
- Civics
- —
Market trends
- HPI YoY
- ▼ -107.34%
- Current HPI
- 379.5755
- Rent YoY
- ▲ 4.22%
- Metro
- Boston-Cambridge-Newton, MA-NH
- State GDP YoY
- —
- F500 in state
- 0
Price history
+322.6% since first listed6 events — show timeline
- 2026-05-24 Listed $147,900 FSBO.com
- 2017-10-20 Sold (Public Records) $60,000 Public Records
- 2011-05-10 Sold (MLS) $60,000 PrimeMLS
- 2010-09-24 Listed $69,900 PrimeMLS
- 2004-06-16 Sold (Public Records) $89,900 Public Records
- 2004-04-05 Sold (Public Records) $35,000 Public Records
Property tax history
+3.3%/yrLatest (2025): $2,928 · +3.0% YoY. Source: county tax records.
Cash-flow waterfall
monthlySold comps — $/sqft
last 12 mo · ≤1 miLoading sold comps…