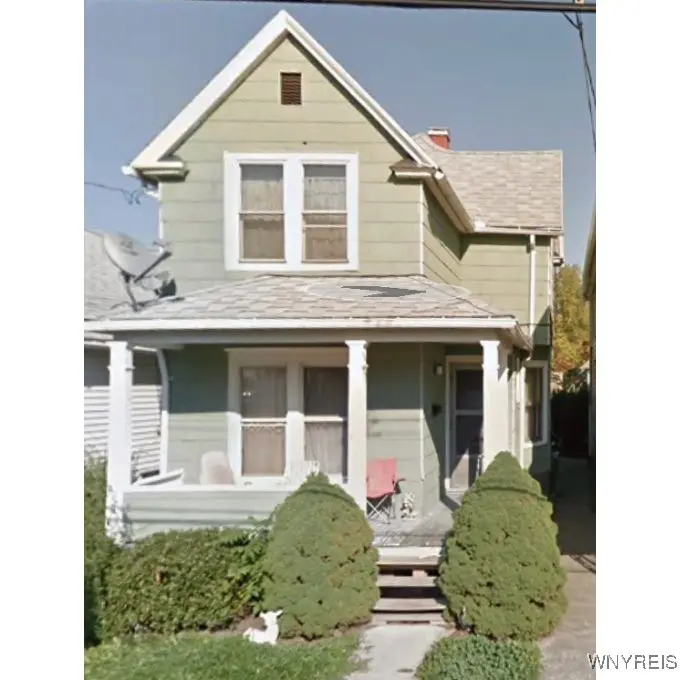
81 Thompson St · Buffalo, NY
Flood risk 1/10 · Minimal
- FEMA flood zone
- X (unshaded)
- Chance of flooding over 30 yrs
- 0.0%
- Est. flood insurance / yr
- $473 – $860
Fire risk 1/10 · Minimal
- Est. fire insurance / yr
- $691 – $1,283
Heat risk 3/10 · Minor
- Hot days now (above 92°F)
- 7 days/yr
- Hot days in 30 yrs
- 14 days/yr
Wind risk 1/10 · Minimal
- Chance of severe wind over 30 yrs
- —
Air-quality risk 4/10 · Minor
- Unhealthy air days now
- 4 days/yr
- Unhealthy air days in 30 yrs
- 9 days/yr
Risk factors via First Street. Map © Google.
Why this score? — see what drove the B+ grade
The composite is a weighted blend of 9 inputs, each scored 0–100. Each bar is that input's sub-score; the figure is the points it added to the 100-point composite (weight × sub-score).
- Cash flow +30.0/30.0
- ARV discount +15.0/15.0
- 1% rule +10.0/10.0
- DSCR +10.0/10.0
- Rent growth +4.5/5.0
- Livability +3.9/5.0
- Schools +3.3/10.0
- Condition / age +2.5/5.0
- Appreciation +0.0/10.0
$115,000
🖨 Deal sheet 📄 Offer letter ✓ Due diligence
Listing remarks MLS
Welcome to 81 Thompson Street, a spacious home featuring 4 bedrooms and 1 full bathroom. This two-story property offers a functional layout with generous living space, making it ideal for both homeowners and investors. The home includes a bright living area, a formal dining space, and a full basement that offers additional storage and potential for future use. Conveniently located near schools, parks, shopping, and public transportation, with easy access to downtown Buffalo and nearby amenities. This property offers a great opportunity for buyers looking for space, value, and potential in a well-established neighborhood. A great opportunity to make this home your own or add to your investment portfolio.
Key facts
- Bright living area
- Formal dining space
- Full basement
Tags
Neighborhood map
What this means for you Summary
Snapshot
- This is a 4-bed/1.0-bath single-family listed at $115k.
Deal economics
- At list price, monthly cash flow is $795 ($10k/yr) — positive.
- The deal already cash-flows at list — no discount required.
- Meets the 1% rule at list price ($2k rent vs $115k).
- Recommended offer: $105k (9.0% below list) — sets the bar for market timing.
- Cap rate 14.6% vs local median 8.0% in Buffalo — top-decile yield for the area; either an underpriced asset or a hidden risk that comps aren't pricing in. Stress-test before assuming the spread holds.
Location & tenants
- Location reads 77/100 on livability (#195 in NY, #3,011 nationally) — a middle-class / working-renter tenant base. Strengths: commute A+, housing A+, health & safety A+; Watch: crime F, employment D-.
- Buffalo City School District (urban): math 41% / reading 40% proficiency, ranked #535 of 590 in NY (top 91%) — families likely to look elsewhere, expect single-tenant / working-renter base with shorter leases; 75% free/reduced lunch — lower-income household profile, screen leases tightly.
- Market conditions: Rents rising fast (+8.2%/yr); 197 active listings in the ZIP; 15 comparable units currently listed for rent nearby; rentals at typical pace (median 24d on market — plan ~3-4 weeks tenant-placement turnaround); 40% of comp listings sitting > 30 days — soft ceiling on asking rent; lower-income renter base — watch delinquency; 1,244 units permitted in Erie County in 2024 (563 in 5+ unit buildings).
- At $1,865/mo this rent would consume 56% of the median local household income ($40k/yr) (locally 2177% of renters already pay >50% of income on rent) — very limited rent-growth headroom before tenants either downsize or default.
Forward outlook
- Local home prices are declining (-3.0%/yr); year-one equity from $795 of loan paydown is wiped out by about $3k of value loss. Plan a longer hold.
- At projected returns (-3.0% appreciation + 8.0% rent growth), your $32k cash investment doubles in ~4 years — after that, you're playing with house money.
Negotiation context
- It's been on market 101 days — a 9% lower offer ($105k) is reasonable based on typical stale-listing flexibility.
- 3 sale attempts since 14y ago; this cycle's ask has dropped $15k (12%) from the opening price — seller is motivated, your offer sets the floor, not the list.
- Current owner paid $46k; list at $115k implies a 150% gain — meaningful room to come down on a strong offer.
Risks & watch-outs
- Watch-outs: built in 1900 — expect roof / HVAC / electrical / plumbing capex.
Questions for the listing agent
- It's been on market 101 days. Have you received any prior offers? Is the seller open to a 9% concession, seller financing, or rate buy-down credit?
- Built in 1900 — when were the roof, HVAC, electrical panel, plumbing, and water heater last replaced?
- Why hasn't it sold? Are there any deal-killer items the seller is aware of (foundation, flood, title, zoning, code violations)?
- Is there a deadline driving the sale (1031 exchange, divorce, estate, relocation)? That informs how much negotiation room exists.
- Crime grade is F in this area — have there been break-ins, vandalism, or insurance claims at this property in the last 3 years? What carrier currently insures it and at what premium?
- What's the average days-on-market for RENTAL listings here right now (not sales)? A rising rental-DOM trend means longer vacancies and softer asking-rent achievability than the comps imply.
- What's the recent tenant-quality profile in this submarket — average credit score on applications, eviction rate, late-payment / NSF rate, and stable-employment percentage? A property-management company in the area should have these aggregated.
- How much new for-sale + rental construction is in the pipeline within 1–3 miles? Heavy new supply typically softens prices + rents 12–24 months out; constrained supply supports both.
Investment metrics
- 1% rule
- 1.62% ✓
- Cap rate
- 14.59%
- Cash-on-cash
- 29.63%
- DSCR
- 2.32
- GRM
- 5.1
CMA / ARV
- ARV (median comp)
- $167,453
- List price
- $115,000
- Delta
- -31.32%
- Verdict
- UNDERPRICED
- Comps
- 20 within 1.0 mi
Show comp detail 12 sales within ~0.75 mi
| Address | Dist | Beds/Ba | Sqft | Sold | Price | $/sf | Match |
|---|---|---|---|---|---|---|---|
| 111 Gorton St | 0.15mi | 4/1.0 | 1,508 (+0%) | 6mo | $164,900 | $109 | 87 |
| 54 Gorton St | 0.04mi | 3/1.0 (-1) | 1,439 (-4%) | 6mo | $155,000 | $108 | 81 |
| 246 Amherst St | 0.23mi | 3/2.0 (-1) | 1,628 (+8%) | 2mo | $85,500 | $53 | 64 |
| 433 East St | 0.52mi | 4/1.0 | 1,512 (+1%) | 17mo | $200,000 | $132 | 60 |
| 116 Pacific St | 0.43mi | 5/1.0 (+1) | 1,404 (-6%) | 7mo | $106,000 | $75 | 58 |
| 72 Glor St | 0.40mi | 3/1.0 (-1) | 1,370 (-9%) | 8mo | $160,000 | $117 | 55 |
| 153 Howell St | 0.67mi | 4/1.0 | 1,545 (+3%) | 13mo | $80,000 | $52 | 53 |
| 476 East St | 0.60mi | 4/2.0 | 1,618 (+8%) | 6mo | $100,000 | $62 | 49 |
| 171 Forest Ave | 0.70mi | 4/2.0 | 1,620 (+8%) | 5mo | $165,000 | $102 | 46 |
| 606 Grant St | 0.65mi | 5/2.0 (+1) | 1,560 (+4%) | 12mo | $75,000 | $48 | 44 |
| 62 Germain St | 0.54mi | 3/1.0 (-1) | 1,320 (-12%) | 13mo | $80,000 | $61 | 39 |
| 154 Germain St | 0.55mi | 3/1.0 (-1) | 1,334 (-11%) | 16mo | $120,000 | $90 | 37 |
Match score weights: distance 35% · size 25% · config 20% · recency 20%. Top-matched comps best support the ARV.
Projected returns pro-forma
-3.0% appreciation · 8.0% rent growth · sell at horizon
- IRR
- 29.3%
- Equity multiple
- 2.30×
- Total profit
- $41,808
- Equity at exit
- $17,147
- IRR
- 39.2%
- Equity multiple
- 5.54×
- Total profit
- $146,277
- Equity at exit
- $9,943
Cash invested: $32,200 (down + closing). Projections, not guarantees.
Landlord ↔ Tenant lean methodology
- Overall (STATE)
- 15 Strongly Tenant-Friendly
- State New York
- 15 Strongly Tenant-Friendly · D+10
- County
- — inherits STATE
- City
- — inherits STATE
ZIP-level market 14207
- Home prices YoY
- -18.9%
- Rents YoY
- 8.2%
- Active inventory
- 197
- Price-to-rent
- 5.1×
Monthly cashflow live
- Estimated rent
- $1,865 high interval (Pro) →
- Mortgage (P&I)
- −$603
- Tax from tax record
- −$27 /mo · $325/yr
- Insurance
- −$48
- HOA
- −$0
- Vacancy / Maint / Mgmt
- −$392
- Net cashflow
- $795
Break-even live
UW: 25.0% down · 7.5% · 30yr · 1.5% tax · 5.0% vac · 8.0% maint · 8.0% mgmt
Financing live
Cash to close
- Down payment
- $28,750
- Closing costs
- $3,450
- Reserves months
- —
- Total cash needed
- —
Loan-product check · same deal, 3 products live
Conventional
25% down · 7.5% · 30yr
- Down + closing
- —
- Monthly P&I
- —
- Monthly cashflow
- —
- DSCR
- —
- Eligible?
- —
Personal DTI + credit; lowest rate.
DSCR
20% down · 8.5% · 30yr
- Down + closing
- —
- Monthly P&I
- —
- Monthly cashflow
- —
- DSCR
- —
- Eligible?
- —
No personal income docs; deal must DSCR.
Hard money
10% down · 12.0% · 12mo
- Down + closing
- —
- Monthly P&I
- —
- Monthly cashflow
- —
- DSCR
- —
- Eligible?
- —
Short-term bridge; refi at stabilization.
Rent comps 15 comps
| Address | Beds | Baths | Sqft | Rent | $/sqft | DOM | Units | Dist |
|---|---|---|---|---|---|---|---|---|
| 78 Germain St Buffalo, NY | 3.0 | 1.0 | 2030 | $1,300 | $0.64 | 14d | 1 | 0.53mi |
| 62 Germain St Buffalo, NY | 3.0 | 1.0 | 1320 | $1,250 | $0.95 | 23d | 1 | 0.54mi |
| 100 Forest Ave Buffalo, NY | 2.0–4.0 | 2.0–4.0 | 1304 | $2,560 | $1.96 | 1d | 14 | 0.62mi |
| 118 Rano St Buffalo, NY | 3.0 | 1.0 | 1050 | $1,200 | $1.14 | 21d | 1 | 0.79mi |
| 232 Dewitt St Buffalo, NY | 3.0 | 1.0 | 1200 | $1,300 | $1.08 | 23d | 1 | 0.97mi |
| 305 Bird Ave Unit 3 Buffalo, NY | 3.0 | 1.5 | 1128 | $2,300 | $2.04 | 43d | 1 | 0.97mi |
| 309 Bird Ave Unit 1 Buffalo, NY | 3.0 | 1.0 | 1100 | $2,200 | $2.00 | 43d | 1 | 0.97mi |
| 374 Baynes St Buffalo, NY | 3.0 | 1.0 | 1126 | $1,550 | $1.38 | 43d | 1 | 1.05mi |
| 37 Abbottsford Pl Buffalo, NY | 3.0 | 1.0 | 1130 | $1,650 | $1.46 | 43d | 1 | 1.05mi |
| 139 Fordham Dr Buffalo, NY | 3.0 | 1.0 | 1453 | $1,700 | $1.17 | 23d | 1 | 1.09mi |
| 311 Herkimer St #1 Buffalo, NY | 3.0 | 1.0 | 1272 | $1,400 | $1.10 | 14d | 1 | 1.13mi |
| 891 Richmond Ave Buffalo, NY | 3.0 | 1.0 | 1176 | $1,800 | $1.53 | 43d | 1 | 1.13mi |
| 836 Richmond Ave Buffalo, NY | 4.0 | 3.5 | 1982 | $4,500 | $2.27 | 43d | 1 | 1.17mi |
| 158 Chadduck Ave Buffalo, NY | 4.0 | 1.0 | 1200 | $1,250 | $1.04 | 23d | 1 | 1.35mi |
| 40 Putnam St Buffalo, NY | 4.0 | 1.0 | 1600 | $2,100 | $1.31 | 23d | 1 | 1.50mi |
Listing history 21 events
-
2026-06-18days on market $115,000 Active 101 DOM
-
2026-06-17days on market $115,000 Active 100 DOM
-
2026-06-16days on market $115,000 Active 99 DOM
-
2026-06-15days on market $115,000 Active 98 DOM
-
2026-06-13days on market $115,000 Active 96 DOM
-
2026-06-13days on market $115,000 Active 95 DOM
-
2026-06-10days on market $115,000 Active 93 DOM
-
2026-06-09days on market $115,000 Active 92 DOM
-
2026-06-08days on market $115,000 Active 91 DOM
-
2026-06-07days on market $115,000 Active 90 DOM
-
2026-06-03days on market $115,000 Active 86 DOM
-
2026-06-02days on market $115,000 Active 85 DOM
-
2026-06-01days on market $115,000 Active 84 DOM
-
2026-05-31days on market $115,000 Active 83 DOM
-
2026-05-11price $115,000 712-char remark
Show marketing remark (712 chars)
Welcome to 81 Thompson Street, a spacious home featuring 4 bedrooms and 1 full bathroom. This two-story property offers a functional layout with generous living space, making it ideal for both homeowners and investors. The home includes a bright living area, a formal dining space, and a full basement that offers additional storage and potential for future use. Conveniently located near schools, parks, shopping, and public transportation, with easy access to downtown Buffalo and nearby amenities. This property offers a great opportunity for buyers looking for space, value, and potential in a well-established neighborhood. A great opportunity to make this home your own or add to your investment portfolio.
-
2026-03-09status Active 712-char remark
Show marketing remark (712 chars)
Welcome to 81 Thompson Street, a spacious home featuring 4 bedrooms and 1 full bathroom. This two-story property offers a functional layout with generous living space, making it ideal for both homeowners and investors. The home includes a bright living area, a formal dining space, and a full basement that offers additional storage and potential for future use. Conveniently located near schools, parks, shopping, and public transportation, with easy access to downtown Buffalo and nearby amenities. This property offers a great opportunity for buyers looking for space, value, and potential in a well-established neighborhood. A great opportunity to make this home your own or add to your investment portfolio.
-
2026-03-08$130,000 Active 712-char remark
Show marketing remark (712 chars)
Welcome to 81 Thompson Street, a spacious home featuring 4 bedrooms and 1 full bathroom. This two-story property offers a functional layout with generous living space, making it ideal for both homeowners and investors. The home includes a bright living area, a formal dining space, and a full basement that offers additional storage and potential for future use. Conveniently located near schools, parks, shopping, and public transportation, with easy access to downtown Buffalo and nearby amenities. This property offers a great opportunity for buyers looking for space, value, and potential in a well-established neighborhood. A great opportunity to make this home your own or add to your investment portfolio.
-
2013-12-31soldstatus $46,000
-
2013-08-01soldstatus $20,000 119-char remark
Show marketing remark (119 chars)
Wonderful opportunity for home ownership in prime City/Blackrock location. Very spacious house. Great open front porch.
-
2012-09-20$27,000 119-char remark
Show marketing remark (119 chars)
Wonderful opportunity for home ownership in prime City/Blackrock location. Very spacious house. Great open front porch.
-
2004-11-05soldstatus $39,900
ⓘ Source: listings_history table (triggers on properties + properties_extension) + one-shot
backfill from property_details.listing_events for pre-trigger history.
Tax reassessment forecast NY · Partial reset (capped growth)
- Current annual tax
- $325 · $27/mo
- Projected year-2 tax
- $1,134 · $95/mo
- Expected delta
- +$809/yr (+$67/mo · 248.9%)
ⓘ Screening estimate from a state-policy table — verify with the county assessor before closing.
Climate risk First Street
- Flood 1/10 Low FEMA zone X (unshaded) · 0% chance over 30 yrs
- Wildfire 1/10 Low
- Heat 3/10 Moderate 7 d/yr ≥92°F today · 14 d/yr by 30 yrs out
- Wind 1/10 Low
- Air quality 4/10 Moderate 4 unhealthy d/yr today · 9 by 30 yrs out
Nearby sold comps map
Loading sold comps map…
Walkable amenities ~0.75 mi
Loading nearby amenities…
Taxation est. · year 1
- Rental income
- $22,376
- − Mortgage interest
- −$6,442
- − Property taxes
- −$325
- − Insurance
- −$575
- − Repairs & maintenance
- −$1,790
- − Management
- −$1,790
- − Depreciation
- −$3,345
- Taxable income
- $8,108
- Est. tax owed @ 24.0%
- −$1,946
- After-tax cash flow
- $7,594/yr
For passive investors: Depreciation is non-cash, so a rental often shows a tax loss while cash-flowing — sheltering income. Rental losses are passive: they offset passive income freely, and up to $25,000/yr can offset ordinary (W-2) income if you actively participate and your MAGI is under $100k (phasing out to $0 by $150k); unused losses carry forward. On sale, claimed depreciation is recaptured at up to 25%, and gains may owe capital-gains tax (a 1031 exchange can defer both). Figures are a year-1 estimate at your 24.0% rate — not tax advice; consult a CPA.
Schools (NCES district)
- District
- Buffalo City School District
- NCES district ID
- 3605850
- Math proficiency
- 41% ▲ 11.00%
- Reading proficiency
- 40% ▲ 7.00%
- Median HH income
- $31,665
- Composite
- 33.17/100
- National rank
- #5544
- State rank
- #535 of 590 in NY
Livability — Buffalo
- Score
- 77/100
- State rank
- #195
- US rank
- #3011
Category grades
Schools grade is shown separately in the Schools card above.
Census & demographics
- Census place
- Buffalo, NY
- County
- Erie County · 714,559 people
- City population
- 440,021
- Metro
- Buffalo-Cheektowaga, NY
- Population (ZIP)
- 26,327
- Household income
- $39,753
- Rent vs Own
- Severe rent burden
- 2177.0
Population outlook (Erie County) Hauer SSP2
- Today (2025)
- 933,037 people
- By 2030
- 935,181 · +0.2%
- By 2040
- 928,531 · -0.5%
- By 2050
- 905,725 · -2.9%
- By 2075
- 834,037 · -10.6%
- By 2100
- 708,033 · -24.1%
Race, ethnicity, and origin ACS 2023
- Neighborhood character
- Highly diverse neighborhood (Simpson 0.74)
- Race & ethnicity
- White 40% Hispanic / Latino 23% Black 16% Asian 15% Two or more races 14%
- Hispanic origin (detail)
- Puerto Rican 18% Dominican 2%
- Common ancestry
- Romanian 8% Portuguese 1% Arab 1%
- Foreign-born
- 19% · Philippines, Canada, India
- Languages at home
- 65% English-only · Spanish 14% Other Asian/Pacific 10% Other Indo-European 5%
Political lean MEDSL · Erie
- 2024 margin
- Lean D (+9.7) · D 54.8% · R 45.2%
- 2008→2024 swing
- -7.9pp toward R · 2008: 17.5pp · 2024: 9.7pp
- All cycles
- 2024: D+9.7 2020: D+14.7 2016: D+4.8 2012: D+15.6 2008: D+17.5
Not yet ingested
- Civics
- —
Market trends
- HPI YoY
- ▼ -54.42%
- Current HPI
- 233.0902
- Rent YoY
- ▲ 8.19%
- Metro
- Buffalo-Cheektowaga, NY
- State GDP YoY
- ▲ 2.60%
- F500 in state
- 92
Industry mix (Fortune 500 HQ in NY)
| Industry | F500 HQs | Revenue |
|---|---|---|
| Financial Services | 10 | $950B |
|
||
| Consumer Goods | 9 | $162B |
|
||
| Insurance | 4 | $225B |
|
||
| Telecommunications | 2 | $144B |
|
||
| Pharmaceuticals | 2 | $112B |
|
||
| Media / Entertainment | 2 | $69B |
|
||
Price history
+188.2% since first listed7 events — show timeline
- 2026-05-11 Price Changed $115,000 WNYREIS
- 2026-03-09 Relisted — WNYREIS
- 2026-03-08 Listed $130,000 WNYREIS
- 2013-12-31 Sold (Public Records) $46,000 Public Records
- 2013-08-01 Sold (MLS) $20,000 WNYREIS
- 2012-09-20 Listed $27,000 WNYREIS
- 2004-11-05 Sold (Public Records) $39,900 Public Records
Property tax history
+3.7%/yrLatest (2025): $325 · +0.0% YoY. Source: county tax records.
Cash-flow waterfall
monthlySold comps — $/sqft
last 12 mo · ≤1 miLoading sold comps…