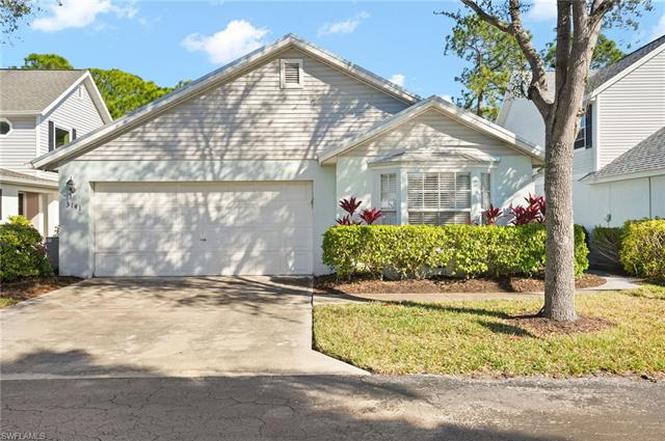
3141 Carriage Cir · Naples, FL
Flood risk 7/10 · Major
- FEMA flood zone
- X (shaded)
- Chance of flooding over 30 yrs
- 0.96%
- Est. flood insurance / yr
- $507 – $1,088
Fire risk 1/10 · Minimal
- Est. fire insurance / yr
- $947 – $1,759
Heat risk 10/10 · Severe
- Hot days now (above 107°F)
- 7 days/yr
- Hot days in 30 yrs
- 29 days/yr
Wind risk 10/10 · Severe
- Chance of severe wind over 30 yrs
- 99.0%
Air-quality risk 2/10 · Minimal
- Unhealthy air days now
- 2 days/yr
- Unhealthy air days in 30 yrs
- 2 days/yr
Risk factors via First Street. Map © Google.
Why this score? — see what drove the C- grade
The composite is a weighted blend of 9 inputs, each scored 0–100. Each bar is that input's sub-score; the figure is the points it added to the 100-point composite (weight × sub-score).
- Cash flow +20.9/30.0
- ARV discount +7.5/15.0
- DSCR +6.7/10.0
- 1% rule +5.1/10.0
- Schools +5.0/10.0
- Livability +4.0/5.0
- Rent growth +2.7/5.0
- Condition / age +2.5/5.0
- Appreciation +0.0/10.0
$649,999
🖨 Deal sheet 📄 Offer letter ✓ Due diligence
Listing remarks
This fully renovated single-family home features a new roof, new flooring, and updated bathrooms. Located in one of Naples’ most sought-after neighborhoods, directly across from Grey Oaks, this 3-bedroom, 2-bath residence is ideal for families. The home is conveniently situated across from the community pool and is surrounded by a great family-friendly neighborhood with an excellent school district
Key facts
- New flooring
- Updated bathrooms
- New roof
Tags
Property features AI
Finance
- Other: No commercial use allowed (restrictions); Irrigation: central
- HOA & community: Mandatory HOA; Quarterly HOA fee of $750 (total annual recurring fees $3,000); HOA maintenance covers cable, irrigation water, and manager; Professional management; Community amenities include clubhouse, community pool, and BBQ/picnic area; Non-gated community (Carriage Circle of Naples)
Exterior
- Parking: Attached 2-car garage
- Security: Smoke detectors
- Utilities: Central water; Central sewer; Electric service (central)
- Home design: Residential single-family; 1-story / ranch; Rear exposure faces west; Unfurnished
- Construction: Concrete block construction; Stucco exterior; Metal roof; Built in 1991; Foundation details not specified
- Exterior features: Patio; Privacy wall; Automatic sprinkler system; Landscaped area; Pool/club view
Interior
- Kitchen: Cooktop; Dishwasher; Microwave; Refrigerator / icemaker; Pantry
- Bedrooms: 3 bedrooms; Guest/secondary unit with 2+ bedrooms, living room and patio
- Flooring: Tile flooring
- Bathrooms: 2 full bathrooms; Master baths: two master-style baths with separate tub and shower
- Heating & cooling: Central electric heat; Central electric cooling; Cable available
- Interior features: Bar; Cable prewire; Cathedral ceiling; Laundry tub; Smoke detectors; Split bedroom floor plan; Pantry; Breakfast bar / dining-living
- Laundry & utility: Washer; Dryer; Laundry tub; Auto garage door opener
Neighborhood map
What this means for you Summary
Snapshot
- This is a 3-bed/2.0-bath single-family listed at $650k.
Deal economics
- At list price, monthly cash flow is $843 ($10k/yr) — positive.
- The deal already cash-flows at list — no discount required.
- Meets the 1% rule at list price ($7k rent vs $650k).
- Recommended offer: $572k (12.0% below list) — sets the bar for market timing.
Location & tenants
- Location reads 80/100 on livability (#126 in FL, #1,903 nationally) — a professional / high-income tenant draw. Strengths: crime A+, amenities A+, employment A+; Watch: commute D+, cost of living F.
- Collier (suburban): math 60% / reading 56% proficiency, ranked #16 of 73 in FL (top 22%) — acceptable for families but not a draw, mixed tenant base, ~2y average lease.
- Market conditions: Rents flat; 329 active listings in the ZIP; 15 comparable units currently listed for rent nearby; rentals at typical pace (median 24d on market — plan ~3-4 weeks tenant-placement turnaround); solid renter incomes; 3,520 units permitted in Collier County in 2024 (959 in 5+ unit buildings).
- At $6,580/mo this rent would consume 86% of the median local household income ($92k/yr) (locally 780% of renters already pay >50% of income on rent) — very limited rent-growth headroom before tenants either downsize or default.
Forward outlook
- Local home prices are declining (-3.0%/yr); year-one equity from $4k of loan paydown is wiped out by about $20k of value loss. Plan a longer hold.
- Collier County population projected at +30% by 2050 — long-run rental-demand tailwind backs the buy-and-hold thesis.
Negotiation context
- It's been on market 146 days — a 12% lower offer ($572k) is reasonable based on typical stale-listing flexibility.
- 6 sale attempts since 16y ago with the ask held roughly flat each time — persistent listings suggest the price (not the market) is what's stuck; bring a comps-based counter.
- Current owner paid $140k; list at $650k implies a 365% gain — meaningful room to come down on a strong offer.
Risks & watch-outs
- Watch-outs: flood insurance adds $66/mo.
- Climate carrying-cost: major flood risk; severe wind risk, 99% chance of damaging wind over 30y; extreme-heat days projected 7→29/yr by 2055 (HVAC capex compounding) — expect insurance premiums to compound above CPI over the hold.
Questions for the listing agent
- It's been on market 146 days. Have you received any prior offers? Is the seller open to a 12% concession, seller financing, or rate buy-down credit?
- What's the actual annual flood-insurance premium (NFIP or private), and is the property in a SFHA with mandatory coverage?
- What does the HOA fee cover, when was the last increase, and are there any pending special assessments or reserve-fund shortfalls?
- Why hasn't it sold? Are there any deal-killer items the seller is aware of (foundation, flood, title, zoning, code violations)?
- Is there a deadline driving the sale (1031 exchange, divorce, estate, relocation)? That informs how much negotiation room exists.
- Schools are B-rated — typically a magnet for longer-tenancy family renters. What's the average tenant stay here, and is there a school-zone premium baked into asking?
- What's the average days-on-market for RENTAL listings here right now (not sales)? A rising rental-DOM trend means longer vacancies and softer asking-rent achievability than the comps imply.
- What's the recent tenant-quality profile in this submarket — average credit score on applications, eviction rate, late-payment / NSF rate, and stable-employment percentage? A property-management company in the area should have these aggregated.
- How much new for-sale + rental construction is in the pipeline within 1–3 miles? Heavy new supply typically softens prices + rents 12–24 months out; constrained supply supports both.
Investment metrics
- 1% rule
- 1.01% ✓
- Cap rate
- 7.97%
- Cash-on-cash
- 5.99%
- DSCR
- 1.27
- GRM
- 8.2
CMA / ARV
No comps found within radius.
Projected returns pro-forma
-3.0% appreciation · 0.85% rent growth · sell at horizon
- IRR
- -10.1%
- Equity multiple
- 0.64×
- Total profit
- $-65,573
- Equity at exit
- $96,917
- IRR
- -3.9%
- Equity multiple
- 0.77×
- Total profit
- $-42,692
- Equity at exit
- $56,200
Cash invested: $182,000 (down + closing). Projections, not guarantees.
Landlord ↔ Tenant lean methodology
- Overall (STATE)
- 87 Strongly Landlord-Friendly
- State Florida
- 87 Strongly Landlord-Friendly · R+3
- County
- — inherits STATE
- City
- — inherits STATE
ZIP-level market 34105
- Home prices YoY
- -30.5%
- Rents YoY
- 0.8%
- Active inventory
- 329
- Price-to-rent
- 8.2×
Monthly cashflow live
- Estimated rent
- $6,580 high interval (Pro) →
- Mortgage (P&I)
- −$3,409
- Tax from tax record
- −$359 /mo · $4,312/yr
- Insurance
- −$271
- Flood insurance flood zone
- −$66 /mo · $798/yr
- HOA
- −$250
- Vacancy / Maint / Mgmt
- −$1,382
- Net cashflow
- $843
Break-even live
UW: 25.0% down · 7.5% · 30yr · 1.5% tax · 5.0% vac · 8.0% maint · 8.0% mgmt
Financing live
Cash to close
- Down payment
- $162,500
- Closing costs
- $19,500
- Reserves months
- —
- Total cash needed
- —
Loan-product check · same deal, 3 products live
Conventional
25% down · 7.5% · 30yr
- Down + closing
- —
- Monthly P&I
- —
- Monthly cashflow
- —
- DSCR
- —
- Eligible?
- —
Personal DTI + credit; lowest rate.
DSCR
20% down · 8.5% · 30yr
- Down + closing
- —
- Monthly P&I
- —
- Monthly cashflow
- —
- DSCR
- —
- Eligible?
- —
No personal income docs; deal must DSCR.
Hard money
10% down · 12.0% · 12mo
- Down + closing
- —
- Monthly P&I
- —
- Monthly cashflow
- —
- DSCR
- —
- Eligible?
- —
Short-term bridge; refi at stabilization.
Rent comps 15 comps
| Address | Beds | Baths | Sqft | Rent | $/sqft | DOM | Units | Dist |
|---|---|---|---|---|---|---|---|---|
| 3511 Santiago Way Naples, FL | 4.0 | 2.0 | 1800 | $6,500 | $3.61 | 23d | 1 | 0.35mi |
| 2581 Poinciana St Naples, FL | 3.0 | 2.0 | 1255 | $9,000 | $7.17 | 23d | 1 | 0.44mi |
| 3520 Bolero Way Unit 1325569P Naples, FL | 3.0 | 2.0 | 1399 | $5,021 | $3.59 | 14d | 1 | 0.59mi |
| 1111 Wildwood Ln #1111 Naples, FL | 3.0 | 2.0 | 2060 | $10,000 | $4.85 | 23d | 1 | 0.96mi |
| 522 Wildwood Ln #522 Naples, FL | 2.0 | 2.0 | 1656 | $8,000 | $4.83 | 23d | 1 | 0.98mi |
| 500 Misty Pines Cir #206 Naples, FL | 2.0 | 2.0 | 1260 | $6,000 | $4.76 | 14d | 1 | 1.01mi |
| 500 Misty Pines Cir Unit 2-204 Naples, FL | 2.0 | 2.0 | 1260 | $5,750 | $4.56 | 13d | 1 | 1.01mi |
| 3308 Europa Dr #30 Naples, FL | 2.0 | 2.0 | 1205 | $5,500 | $4.56 | 23d | 1 | 1.01mi |
| 1350 Misty Pines Cir Unit E-204 Naples, FL | 2.0 | 2.0 | 1200 | $7,500 | $6.25 | 14d | 1 | 1.07mi |
| 2680 Longboat Dr Naples, FL | 3.0 | 2.0 | 1528 | $11,000 | $7.20 | 23d | 1 | 1.23mi |
| 1044 Woodshire Ln Unit B212 Naples, FL | 3.0 | 2.0 | 1250 | $8,000 | $6.40 | 23d | 1 | 1.33mi |
| 202 Bears Paw Trl #97 Naples, FL | 2.0 | 2.0 | 1665 | $10,000 | $6.01 | 23d | 1 | 1.34mi |
| 2328 Clipper Way Naples, FL | 2.0 | 2.0 | 1469 | $10,000 | $6.81 | 23d | 1 | 1.36mi |
| 2548 River Reach Dr Unit 1073502P Naples, FL | 3.0 | 2.0 | 1550 | $5,795 | $3.74 | 14d | 1 | 1.42mi |
| 1860 Bald Eagle Dr Unit 403B Naples, FL | 2.0 | 2.0 | 1325 | $3,000 | $2.26 | 14d | 1 | 1.44mi |
HOA detail
- Monthly dues
- $250 · $3,000/yr
- Likely covers
- pool
Listing history 30 events
-
2026-06-18days on market $649,999 Active 146 DOM
-
2026-06-17days on market $649,999 Active 145 DOM
-
2026-06-16days on market $649,999 Active 144 DOM
-
2026-06-15days on market $649,999 Active 143 DOM
-
2026-06-14days on market $649,999 Active 141 DOM
-
2026-06-10days on market $649,999 Active 138 DOM
-
2026-06-09days on market $649,999 Active 137 DOM
-
2026-06-08days on market $649,999 Active 136 DOM
-
2026-06-07days on market $649,999 Active 135 DOM
-
2026-06-03days on market $649,999 Active 131 DOM
-
2026-06-02days on market $649,999 Active 130 DOM
-
2026-06-01days on market $649,999 Active 129 DOM
-
2026-05-31days on market $649,999 Active 128 DOM
-
2026-05-30days on market $649,999 Active 127 DOM
-
2026-03-01price $649,999
-
2026-01-23$675,000 Active
-
2016-01-05historical
-
2015-08-02status Pending
-
2015-04-22status Active
-
2015-03-13status Pending
-
2015-03-08price $280,000
-
2015-03-08price $259,900
-
2015-02-09price $279,900
-
2015-01-20$285,900 Active
-
2014-07-15historical
-
2013-12-10$289,900
-
2010-10-12historical
-
2010-08-30$225,000
-
2010-08-30$225,000
-
1993-06-07soldstatus $139,900
ⓘ Source: listings_history table (triggers on properties + properties_extension) + one-shot
backfill from property_details.listing_events for pre-trigger history.
Tax reassessment forecast FL · Resets to sale price
- Current annual tax
- $4,312 · $359/mo
- Projected year-2 tax
- $5,395 · $450/mo
- Expected delta
- +$1,083/yr (+$90/mo · 25.1%)
ⓘ Screening estimate from a state-policy table — verify with the county assessor before closing.
Climate risk First Street
- Flood 7/10 Severe FEMA zone X (shaded) · 96% chance over 30 yrs
- Wildfire 1/10 Low
- Heat 10/10 Extreme 7 d/yr ≥107°F today · 29 d/yr by 30 yrs out
- Wind 10/10 Extreme 99% chance of damaging wind over 30 yrs
- Air quality 2/10 Low 2 unhealthy d/yr today · 2 by 30 yrs out
Nearby sold comps map
Loading sold comps map…
Walkable amenities ~0.75 mi
Loading nearby amenities…
Taxation est. · year 1
- Rental income
- $78,957
- − Mortgage interest
- −$36,410
- − Property taxes
- −$4,312
- − Insurance
- −$4,047
- − Repairs & maintenance
- −$6,317
- − Management
- −$6,317
- − HOA
- −$3,000
- − Depreciation
- −$18,909
- Taxable loss
- −$354
- Est. tax savings @ 24.0%
- +$85
- After-tax cash flow
- $10,198/yr
For passive investors: Depreciation is non-cash, so a rental often shows a tax loss while cash-flowing — sheltering income. Rental losses are passive: they offset passive income freely, and up to $25,000/yr can offset ordinary (W-2) income if you actively participate and your MAGI is under $100k (phasing out to $0 by $150k); unused losses carry forward. On sale, claimed depreciation is recaptured at up to 25%, and gains may owe capital-gains tax (a 1031 exchange can defer both). Figures are a year-1 estimate at your 24.0% rate — not tax advice; consult a CPA.
Schools (NCES district)
- District
- Collier
- NCES district ID
- 1200330
- Math proficiency
- 60% ▼ -4.00%
- Reading proficiency
- 56% ▼ -2.00%
- Median HH income
- $58,275
- Composite
- 50.23/100
- National rank
- #1892
- State rank
- #16 of 73 in FL
Livability — Naples
- Score
- 80/100
- State rank
- #126
- US rank
- #1903
Category grades
Schools grade is shown separately in the Schools card above.
Census & demographics
- County
- Collier County · 396,295 people
- City population
- 344,941
- Metro
- Naples-Marco Island, FL
- Population (ZIP)
- 15,441
- Household income
- $92,214
- Rent vs Own
- Severe rent burden
- 780.0
Population outlook (Collier County) Hauer SSP2
- Today (2025)
- 420,858 people
- By 2030
- 450,054 · +6.9%
- By 2040
- 502,232 · +19.3%
- By 2050
- 544,932 · +29.5%
- By 2075
- 627,203 · +49.0%
- By 2100
- 659,015 · +56.6%
Race, ethnicity, and origin ACS 2023
- Neighborhood character
- Predominantly White (79%)
- Race & ethnicity
- White 79% Hispanic / Latino 14% Two or more races 7% Asian 5%
- Hispanic origin (detail)
- Mexican 3% Puerto Rican 1% Cuban 3% Salvadoran 1%
- Common ancestry
- Romanian 3% Lithuanian 3% Italian 3%
- Foreign-born
- 22% · Canada, China, Jamaica
- Languages at home
- 77% English-only · Spanish 11% Other Indo-European 3% Russian/Polish/Slavic 3%
Political lean MEDSL · Collier
- 2024 margin
- Solid R (+33.1) · D 33.1% · R 66.2%
- 2008→2024 swing
- -10.6pp toward R · 2008: -22.5pp · 2024: -33.1pp
- All cycles
- 2024: R+33.1 2020: R+24.7 2016: R+26.0 2012: R+30.1 2008: R+22.5
Not yet ingested
- Civics
- —
Market trends
- HPI YoY
- ▼ -124.65%
- Current HPI
- 283.9084
- Rent YoY
- ▲ 0.85%
- Metro
- Naples-Marco Island, FL
- State GDP YoY
- ▲ 3.28%
- F500 in state
- 36
Industry mix (Fortune 500 HQ in FL)
| Industry | F500 HQs | Revenue |
|---|---|---|
| Industrial Technology | 2 | $29B |
|
||
| Insurance | 2 | $17B |
|
||
| Retail | 1 | $60B |
|
||
| Technology Distribution | 1 | $58B |
|
||
| Homebuilding | 1 | $35B |
|
||
| Technology Manufacturing | 1 | $35B |
|
||
Price history
+364.6% since first listed16 events — show timeline
- 2026-03-01 Price Changed $649,999 NAPLESMLS
- 2026-01-23 Listed $675,000 NAPLESMLS
- 2016-01-05 Listing Removed — FORTMLS
- 2015-08-02 Pending — FORTMLS
- 2015-04-22 Relisted — FORTMLS
- 2015-03-13 Pending — FORTMLS
- 2015-03-08 Price Changed $259,900 FORTMLS
- 2015-03-08 Price Changed $280,000 FORTMLS
- 2015-02-09 Price Changed $279,900 FORTMLS
- 2015-01-20 Listed $285,900 FORTMLS
- 2014-07-15 Listing Removed — NAPLESMLS
- 2013-12-10 Listed $289,900 NAPLESMLS
- 2010-10-12 Listing Removed — NAPLESMLS
- 2010-08-30 Listed $225,000 NAPLESMLS
- 2010-08-30 Listed $225,000 MIML
- 1993-06-07 Sold (Public Records) $139,900 Public Records
Property tax history
+6.8%/yrLatest (2025): $4,312 · +3.9% YoY. Source: county tax records.
Cash-flow waterfall
monthlySold comps — $/sqft
last 12 mo · ≤1 miLoading sold comps…