9156 Collins Ave #202 · Surfside, FL
Flood risk 9/10 · Severe
- FEMA flood zone
- AE
- Chance of flooding over 30 yrs
- 0.99%
- Est. flood insurance / yr
- $1,737 – $8,500
Fire risk 1/10 · Minimal
- Est. fire insurance / yr
- $947 – $1,759
Heat risk 10/10 · Severe
- Hot days now (above 103°F)
- 7 days/yr
- Hot days in 30 yrs
- 28 days/yr
Wind risk 10/10 · Severe
- Chance of severe wind over 30 yrs
- 99.0%
Air-quality risk 2/10 · Minimal
- Unhealthy air days now
- 1 days/yr
- Unhealthy air days in 30 yrs
- 2 days/yr
Risk factors via First Street. Map © Google.
Why this score? — see what drove the C+ grade
The composite is a weighted blend of 9 inputs, each scored 0–100. Each bar is that input's sub-score; the figure is the points it added to the 100-point composite (weight × sub-score).
- Cash flow +21.6/30.0
- Appreciation +8.1/10.0
- 1% rule +8.0/10.0
- ARV discount +7.5/15.0
- DSCR +6.9/10.0
- Schools +4.2/10.0
- Livability +3.8/5.0
- Condition / age +2.5/5.0
- Rent growth +2.2/5.0
$334,999
🖨 Deal sheet (PDF) 📄 Offer letter ✓ Due diligence
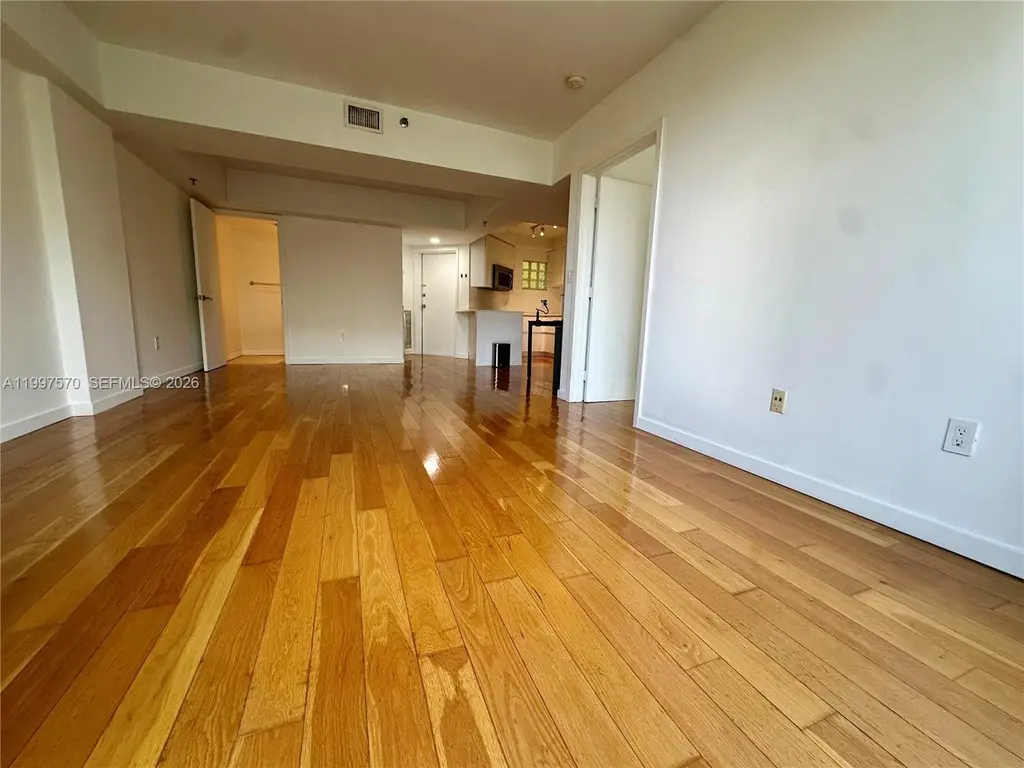
Listing remarks
Beautiful apartment with washer and dryer inside, it has 1 bedroom, 1.5 bathroom and walk-in closet. This unit is quiet, across from the beach , clean and spacious. Building has assigned cover parking, a pool and sauna. Close to the Four Seasons and Bal Harbour. PROPERTY IS CURRENTLY BEING RENTED, Lease ends in September $2400 ! Please text Agent before calling for showings
Key facts
- Washer and dryer
- Walk-in closet
- Sauna
Tags
Property features AI
Finance
- Other: Association-maintained pool
- Financial info: Pets allowed (yes) with size limit; more than 20 lbs permitted
- HOA & community: Monthly association fee ($640) covering common areas and pool(s); Association amenities include pool, trash service, and elevator(s)
Exterior
- Parking: 1 covered parking space; Garage with 1 space
- Security: Secured elevator
- Utilities: Central heating and cooling
- Home design: Attached property; 4-story building; Entry located on level 2; Effective year built
- Construction: Block construction
- Exterior features: Association pool
Interior
- Kitchen: Microwave
- Bedrooms: Bedroom located on the main level
- Flooring: Hardwood floors; Wood floors
- Bathrooms: 1 full bathroom; 1 half bathroom
- Heating & cooling: Central heating; Central air conditioning
- Interior features: First-floor entry; Bedroom on main level; Elevator access
- Laundry & utility: Washer hookup; Dryer hookup; Dryer (appliance)
Neighborhood map
What this means for you Summary
Snapshot
- This is a 1-bed/1.0-bath condo listed at $335k.
Deal economics
- At list price, monthly cash flow is $85 ($1k/yr) — positive.
- The deal already cash-flows at list — no discount required.
- Meets the 1% rule at list price ($4k rent vs $335k).
- Recommended offer: $325k (3.0% below list) — sets the bar for market timing.
Location & tenants
- Location reads 75/100 on livability (#258 in FL, #4,141 nationally) — a middle-class / working-renter tenant base. Strengths: crime A+, commute A+, health & safety A+; Watch: housing C-, amenities F, cost of living F.
- Miami-Dade (suburban): math 45% / reading 54% proficiency, ranked #40 of 73 in FL (top 55%) — families likely to look elsewhere, expect single-tenant / working-renter base with shorter leases; 64% free/reduced lunch — lower-income household profile, screen leases tightly.
- Market conditions: Rents soft (-1.3%/yr); 523 active listings in the ZIP; solid renter incomes; 10,051 units permitted in Miami-Dade County in 2024 (7,758 in 5+ unit buildings).
- At $4,358/mo this rent would consume 58% of the median local household income ($90k/yr) (locally 774% of renters already pay >50% of income on rent) — very limited rent-growth headroom before tenants either downsize or default.
Forward outlook
- In year one you build about $23k of equity ($2k loan paydown + $21k appreciation (6.1% local appreciation)).
- Miami-Dade County population projected at +28% by 2050 — long-run rental-demand tailwind backs the buy-and-hold thesis.
- At projected returns (6.1% appreciation + 0.0% rent growth), your $94k cash investment doubles in ~4 years — after that, you're playing with house money.
- By year 2, paydown + projected appreciation supports a ~$37k cash-out refi (75% LTV) — recoverable capital for the next deal without selling this one.
Negotiation context
- It's been on market 57 days — a 3% lower offer ($325k) is reasonable based on typical stale-listing flexibility.
- 6 sale attempts since 7y ago with the ask held roughly flat each time — persistent listings suggest the price (not the market) is what's stuck; bring a comps-based counter.
- Current owner paid $275k; 22% above their basis — modest negotiation headroom, anchor on the comps not their cost.
Risks & watch-outs
- Watch-outs: flood insurance adds $427/mo.
- Climate carrying-cost: in FEMA flood zone AE (mandatory federal flood insurance); severe wind risk, 99% chance of damaging wind over 30y; extreme-heat days projected 7→28/yr by 2055 (HVAC capex compounding) — expect insurance premiums to compound above CPI over the hold.
Questions for the listing agent
- It's been on market 57 days. Have you received any prior offers? Is the seller open to a 3% concession, seller financing, or rate buy-down credit?
- What's the actual annual flood-insurance premium (NFIP or private), and is the property in a SFHA with mandatory coverage?
- What does the HOA fee cover, when was the last increase, and are there any pending special assessments or reserve-fund shortfalls?
- Any open or pending special assessments — roof, HVAC, plumbing, elevator, façade? What's the per-unit balance and payoff schedule, and is the seller paying it off at close or rolling it to the buyer?
- Is there a deadline driving the sale (1031 exchange, divorce, estate, relocation)? That informs how much negotiation room exists.
- Schools are B-rated — typically a magnet for longer-tenancy family renters. What's the average tenant stay here, and is there a school-zone premium baked into asking?
- What's the average days-on-market for RENTAL listings here right now (not sales)? A rising rental-DOM trend means longer vacancies and softer asking-rent achievability than the comps imply.
- What's the recent tenant-quality profile in this submarket — average credit score on applications, eviction rate, late-payment / NSF rate, and stable-employment percentage? A property-management company in the area should have these aggregated.
- How much new apartment / multifamily construction is in the pipeline within 1–3 miles? Heavy new supply (>2% of stock underway) typically softens rents 12–24 months out; light construction supports rent growth.
Investment metrics
- 1% rule
- 1.30% ✓
- Cap rate
- 8.12%
- Cash-on-cash
- 6.54%
- DSCR
- 1.29
- GRM
- 6.4
CMA / ARV
No comps found within radius.
Projected returns pro-forma
6.12% appreciation · 0.0% rent growth · sell at horizon
- IRR
- 14.8%
- Equity multiple
- 1.99×
- Total profit
- $92,531
- Equity at exit
- $213,226
- IRR
- 13.7%
- Equity multiple
- 3.62×
- Total profit
- $245,794
- Equity at exit
- $388,967
Cash invested: $93,800 (down + closing). Projections, not guarantees.
Landlord ↔ Tenant lean methodology
- Overall (STATE)
- 87 Strongly Landlord-Friendly
- State Florida
- 87 Strongly Landlord-Friendly · R+3
- County
- — inherits STATE
- City
- — inherits STATE
ZIP-level market 33154
- Home prices YoY
- 1.4%
- Rents YoY
- -1.3%
- Active inventory
- 523
- Price-to-rent
- 6.4×
Monthly cashflow live
- Estimated rent
- $4,358 medium interval (Pro) →
- Mortgage (P&I)
- −$1,757
- Tax from tax record
- −$395 /mo · $4,745/yr
- Insurance
- −$140
- Flood insurance flood zone
- −$427 /mo · $5,118/yr
- HOA
- −$640
- Vacancy / Maint / Mgmt
- −$915
- Net cashflow
- $85
Break-even live
Sensitivity live
| Price | -10% $274 | -5% $180 | +0% $85 | +5% $-10 | +10% $-105 |
|---|---|---|---|---|---|
| Rent | -10% $-260 | -5% $-87 | +0% $85 | +5% $257 | +10% $429 |
| Rate | -1.0pp $254 | -0.5pp $170 | base $85 | +0.5pp $-2 | +1.0pp $-90 |
UW: 25.0% down · 7.5% · 30yr · 1.5% tax · 5.0% vac · 8.0% maint · 8.0% mgmt
Financing live
Cash to close
- Down payment
- $83,750
- Closing costs
- $10,050
- Reserves months
- —
- Total cash needed
- —
Loan-product check · same deal, 3 products live
Conventional
25% down · 7.5% · 30yr
- Down + closing
- —
- Monthly P&I
- —
- Monthly cashflow
- —
- DSCR
- —
- Eligible?
- —
Personal DTI + credit; lowest rate.
DSCR
20% down · 8.5% · 30yr
- Down + closing
- —
- Monthly P&I
- —
- Monthly cashflow
- —
- DSCR
- —
- Eligible?
- —
No personal income docs; deal must DSCR.
Hard money
10% down · 12.0% · 12mo
- Down + closing
- —
- Monthly P&I
- —
- Monthly cashflow
- —
- DSCR
- —
- Eligible?
- —
Short-term bridge; refi at stabilization.
HOA detail condo
- Monthly dues
- $640 · $7,680/yr
- Likely covers
- pool
- Assessments
- None detected in remarks — confirm with the listing agent.
Listing history 27 events
-
2026-06-21days on market $334,999 Active 57 DOM
-
2026-06-18days on market $334,999 Active 54 DOM
-
2026-06-17days on market $334,999 Active 53 DOM
-
2026-06-16days on market $334,999 Active 52 DOM
-
2026-06-15days on market $334,999 Active 51 DOM
-
2026-06-13days on market $334,999 Active 49 DOM
-
2026-06-09days on market $334,999 Active 45 DOM
-
2026-06-08days on market $334,999 Active 44 DOM
-
2026-06-07days on market $334,999 Active 43 DOM
-
2026-06-04days on market $334,999 Active 40 DOM
-
2026-06-03days on market $334,999 Active 39 DOM
-
2026-06-02days on market $334,999 Active 38 DOM
-
2026-06-01days on market $334,999 Active 37 DOM
-
2026-05-31days on market $334,999 Active 36 DOM
-
2026-05-06status Active
-
2026-04-08$340,000 Active
-
2025-09-13historical
-
2025-09-09historical $2,400
-
2025-08-05$2,400
-
2025-08-04$380,000 Active
-
2021-06-24soldstatus $275,000
-
2021-06-04soldstatus $275,000 Closed
-
2021-03-30historical Active Under Contract
-
2021-02-09$295,000 Active
-
2020-10-08historical
-
2019-11-16$300,000 Active
-
1998-10-09soldstatus $115,000
ⓘ Source: listings_history table (triggers on properties + properties_extension) + one-shot
backfill from property_details.listing_events for pre-trigger history.
Tax reassessment forecast FL · Resets to sale price
- Current annual tax
- $4,745 · $395/mo
- Projected year-2 tax
- $4,745 · $395/mo
- Expected delta
- $0/yr ($0/mo · 0.0%)
ⓘ Screening estimate from a state-policy table — verify with the county assessor before closing.
Climate risk First Street
- Flood 9/10 Extreme FEMA zone AE · 99% chance over 30 yrs
- Wildfire 1/10 Low
- Heat 10/10 Extreme 7 d/yr ≥103°F today · 28 d/yr by 30 yrs out
- Wind 10/10 Extreme 99% chance of damaging wind over 30 yrs
- Air quality 2/10 Low 1 unhealthy d/yr today · 2 by 30 yrs out
Nearby sold comps map
Loading sold comps map…
Walkable amenities ~0.75 mi
Loading nearby amenities…
Taxation est. · year 1
- Rental income
- $52,300
- − Mortgage interest
- −$18,765
- − Property taxes
- −$4,745
- − Insurance
- −$6,793
- − Repairs & maintenance
- −$4,184
- − Management
- −$4,184
- − HOA
- −$7,680
- − Depreciation
- −$9,745
- Taxable loss
- −$3,797
- Est. tax savings @ 24.0%
- +$911
- After-tax cash flow
- $1,929/yr
For passive investors: Depreciation is non-cash, so a rental often shows a tax loss while cash-flowing — sheltering income. Rental losses are passive: they offset passive income freely, and up to $25,000/yr can offset ordinary (W-2) income if you actively participate and your MAGI is under $100k (phasing out to $0 by $150k); unused losses carry forward. On sale, claimed depreciation is recaptured at up to 25%, and gains may owe capital-gains tax (a 1031 exchange can defer both). Figures are a year-1 estimate at your 24.0% rate — not tax advice; consult a CPA.
Schools (NCES district)
- District
- Miami-Dade
- NCES district ID
- 1200390
- Math proficiency
- 45% ▼ -16.00%
- Reading proficiency
- 54% ▼ -5.00%
- Median HH income
- $43,928
- Composite
- 41.76/100
- National rank
- #3397
- State rank
- #40 of 73 in FL
Livability — Surfside
- Score
- 75/100
- State rank
- #258
- US rank
- #4141
Category grades
Schools grade is shown separately in the Schools card above.
Census & demographics
- Census place
- Surfside, FL
- County
- Miami-Dade County · 2,697,751 people
- City population
- 14,435
- Metro
- Miami-Fort Lauderdale-Pompano Beach, FL
- Population (ZIP)
- 14,572
- Household income
- $89,563
- Rent vs Own
- Severe rent burden
- 774.0
Population outlook (Miami-Dade County) Hauer SSP2
- Today (2025)
- 3,126,439 people
- By 2030
- 3,325,765 · +6.4%
- By 2040
- 3,697,561 · +18.3%
- By 2050
- 4,012,134 · +28.3%
- By 2075
- 4,605,612 · +47.3%
- By 2100
- 4,866,598 · +55.7%
Race, ethnicity, and origin ACS 2023
- Neighborhood character
- Majority White (53%)
- Race & ethnicity
- White 53% Hispanic / Latino 41% Two or more races 25% Black 2%
- Hispanic origin (detail)
- Puerto Rican 2% Cuban 12% Salvadoran 2%
- Common ancestry
- Scotch-Irish 7% Romanian 5% Lithuanian 4%
- Foreign-born
- 46% · Canada, Jamaica, Dominican Republic
- Languages at home
- 36% English-only · Spanish 41% French/Haitian/Cajun 7% Other Indo-European 5%
Political lean MEDSL · Miami-Dade
- 2024 margin
- R (+11.4) · D 43.9% · R 55.4%
- 2008→2024 swing
- -27.6pp toward R · 2008: 16.1pp · 2024: -11.4pp
- All cycles
- 2024: R+11.4 2020: D+7.3 2016: D+29.6 2012: D+23.7 2008: D+16.1
Not yet ingested
- Civics
- —
Market trends
- HPI YoY
- ▲ 6.12%
- Current HPI
- 454.1747
- Rent YoY
- ▼ -1.30%
- Metro
- Miami-Fort Lauderdale-Pompano Beach, FL
- State GDP YoY
- ▲ 3.28%
- F500 in state
- 36
Industry mix (Fortune 500 HQ in FL)
| Industry | F500 HQs | Revenue |
|---|---|---|
| Industrial Technology | 2 | $29B |
|
||
| Insurance | 2 | $17B |
|
||
| Retail | 1 | $60B |
|
||
| Technology Distribution | 1 | $58B |
|
||
| Homebuilding | 1 | $35B |
|
||
| Technology Manufacturing | 1 | $35B |
|
||
Price history
+195.7% since first listed13 events — show timeline
- 2026-05-06 Relisted — MARMLS
- 2026-04-08 Listed $340,000 MARMLS
- 2025-09-13 Listing Removed — MARMLS
- 2025-09-09 Rental Removed $2,400 MARMLS
- 2025-08-05 Listed for Rent $2,400 MARMLS
- 2025-08-04 Listed $380,000 MARMLS
- 2021-06-24 Sold (Public Records) $275,000 Public Records
- 2021-06-04 Sold (MLS) $275,000 MARMLS
- 2021-03-30 Contingent — MARMLS
- 2021-02-09 Listed $295,000 MARMLS
- 2020-10-08 Listing Removed — MARMLS
- 2019-11-16 Listed $300,000 MARMLS
- 1998-10-09 Sold (Public Records) $115,000 Public Records
Property tax history
+5.9%/yrLatest (2025): $4,745 · +7.4% YoY. Source: county tax records.
Cash-flow waterfall
monthlySold comps — $/sqft
last 12 mo · ≤1 miLoading sold comps…