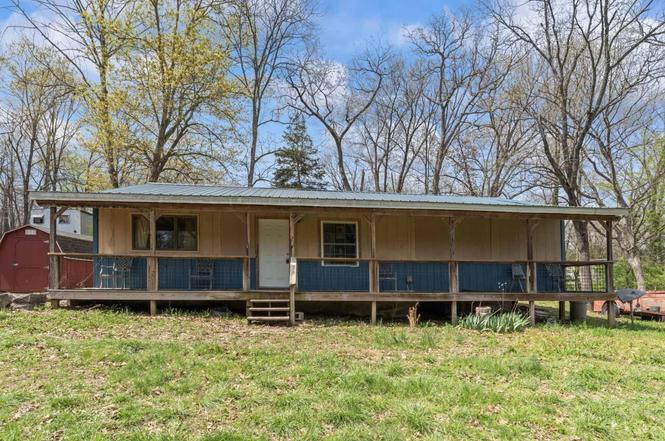
175 Ivey St · Shell Knob, MO
Flood risk 9/10 · Severe
- FEMA flood zone
- X (unshaded)
- Chance of flooding over 30 yrs
- 0.99%
- Est. flood insurance / yr
- $507 – $1,088
Fire risk 3/10 · Minor
- Est. fire insurance / yr
- $1,054 – $1,958
Heat risk 4/10 · Minor
- Hot days now (above 105°F)
- 7 days/yr
- Hot days in 30 yrs
- 20 days/yr
Wind risk 2/10 · Minimal
- Chance of severe wind over 30 yrs
- 1.0%
Air-quality risk 2/10 · Minimal
- Unhealthy air days now
- 0 days/yr
- Unhealthy air days in 30 yrs
- 1 days/yr
Risk factors via First Street. Map © Google.
Why this score? — see what drove the B- grade
The composite is a weighted blend of 9 inputs, each scored 0–100. Each bar is that input's sub-score; the figure is the points it added to the 100-point composite (weight × sub-score).
- Cash flow +28.2/30.0
- DSCR +10.0/10.0
- 1% rule +8.0/10.0
- ARV discount +7.5/15.0
- Schools +3.8/10.0
- Livability +3.3/5.0
- Rent growth +2.5/5.0
- Condition / age +2.5/5.0
- Appreciation +1.7/10.0
$80,000
🖨 Deal sheet 📄 Offer letter ✓ Due diligence
Listing remarks
Attention Handyman Special! Bring Your Tools and Your Vision! This is the perfect opportunity for all you do-it-yourselfers and savvy investors! Priced right and packed with potential, this mostly gutted home is a blank canvas just waiting for your creative touch. Whether you're dreaming of a custom weekend getaway or a full-time residence, the groundwork is set--just bring your ideas and finish it your way. The home features a durable metal roof, a covered front deck ideal for relaxing outdoors, and comes with a bonus: all building materials currently on-site will stay with the property! A spacious 24x30 detached garage/workshop offers plenty of room for tools, vehicles, or your next big p
Key facts
- Metal roof
- Storage building
- Boat launch
Tags
Property features AI
Finance
- HOA & community: Homeowners association with an annual fee of $150 (about $12.50/month); Subdivision: Turkey Mtn Estates2
Exterior
- Parking: 2-car garage
- Utilities: Public water; Septic tank sewer; Propane utility
- Home design: Single-family residence; One story; Residential property
- Construction: Wood siding; Block foundation; Composition roof; Built area approximately 1,235 finished above-grade square feet
- Exterior features: Covered patio/porch
Interior
- Flooring: Vinyl
- Bathrooms: 1 full bathroom
- Heating & cooling: Propane heating; Other heating; Ceiling fans; Window cooling units
- Interior features: Window coverings, shutters and blinds; Vinyl flooring
- Laundry & utility: Laundry on the main level
Neighborhood map
What this means for you Summary
Snapshot
- This is a 2-bed/1.0-bath single-family listed at $80k.
Deal economics
- At list price, monthly cash flow is $186 ($2k/yr) — positive.
- The deal already cash-flows at list — no discount required.
- Meets the 1% rule at list price ($1k rent vs $80k).
- Recommended offer: $70k (12.0% below list) — sets the bar for market timing.
- Cap rate 10.1% vs local median 1.1% in Shell Knob — top-decile yield for the area; either an underpriced asset or a hidden risk that comps aren't pricing in. Stress-test before assuming the spread holds.
Location & tenants
- Location reads 66/100 on livability (#254 in MO) — a middle-class / working-renter tenant base. Strengths: crime A+, cost of living A+, housing B; Watch: health & safety C-, employment D, amenities F.
- Shell Knob 78 (rural): math 35% / reading 50% proficiency, ranked #258 of 535 in MO (top 48%) — families likely to look elsewhere, expect single-tenant / working-renter base with shorter leases; 63% free/reduced lunch — lower-income household profile, screen leases tightly.
- Zoned schools: Shell Knob Elem. (math 37% / reading 42%, grade F, #537 of 1,115 statewide, top 53%, 144 students, 100% FRL) — zoned schools average 100% FRL vs 63% district-wide (37 pts higher); higher-poverty schools than district average — tighter screening recommended.
- Market conditions: 232 active listings in the ZIP; 191 units permitted in Stone County in 2024 (0 in 5+ unit buildings).
Forward outlook
- Local home prices are declining (-3.0%/yr); year-one equity from $553 of loan paydown is wiped out by about $2k of value loss. Plan a longer hold.
- Stone County population projected at -30% by 2050 — secular population decline; favor cash flow + early exit over multi-decade hold.
Negotiation context
- It's been on market 428 days — a 12% lower offer ($70k) is reasonable based on typical stale-listing flexibility.
- 2 sale attempts; this cycle's ask has dropped $20k (20%) from the opening price — seller is motivated, your offer sets the floor, not the list.
Risks & watch-outs
- Watch-outs: flood insurance adds $66/mo.
- Climate carrying-cost: severe flood risk — expect insurance premiums to compound above CPI over the hold.
Questions for the listing agent
- It's been on market 428 days. Have you received any prior offers? Is the seller open to a 12% concession, seller financing, or rate buy-down credit?
- What's the actual annual flood-insurance premium (NFIP or private), and is the property in a SFHA with mandatory coverage?
- What does the HOA fee cover, when was the last increase, and are there any pending special assessments or reserve-fund shortfalls?
- Why hasn't it sold? Are there any deal-killer items the seller is aware of (foundation, flood, title, zoning, code violations)?
- Is there a deadline driving the sale (1031 exchange, divorce, estate, relocation)? That informs how much negotiation room exists.
- Schools are D-rated, which usually means shorter tenancies and higher turnover. Who's the typical renter profile here, and what's been the actual vacancy rate?
- What's the average days-on-market for RENTAL listings here right now (not sales)? A rising rental-DOM trend means longer vacancies and softer asking-rent achievability than the comps imply.
- What's the recent tenant-quality profile in this submarket — average credit score on applications, eviction rate, late-payment / NSF rate, and stable-employment percentage? A property-management company in the area should have these aggregated.
- How much new for-sale + rental construction is in the pipeline within 1–3 miles? Heavy new supply typically softens prices + rents 12–24 months out; constrained supply supports both.
Investment metrics
- 1% rule
- 1.30% ✓
- Cap rate
- 10.08%
- Cash-on-cash
- 13.54%
- DSCR
- 1.60
- GRM
- 6.4
CMA / ARV
- ARV (on-the-fly)
- $264,290
- Comps found
- 5
Show comp detail 5 sales within ~0.75 mi
| Address | Dist | Beds/Ba | Sqft | Sold | Price | $/sf | Match |
|---|---|---|---|---|---|---|---|
| 577 S Heatherwood Rd | 0.72mi | 2/2.0 | 1,240 (+0%) | 1mo | $265,000 | $214 | 61 |
| 187 Loop St | 0.66mi | 2/2.0 | 1,194 (-3%) | 9mo | $325,000 | $272 | 52 |
| 565 S Heatherwood Rd | 0.71mi | 2/2.0 | 1,200 (-3%) | 10mo | $259,000 | $216 | 50 |
| 48 Bayshore St | 0.47mi | 2/2.5 | 1,400 (+13%) | 14mo | $269,900 | $193 | 38 |
| 94 Morningside St | 0.50mi | 1/1.0 (-1) | 1,127 (-9%) | 24mo | $229,000 | $203 | 37 |
Match score weights: distance 35% · size 25% · config 20% · recency 20%. Top-matched comps best support the ARV.
Projected returns pro-forma
-3.0% appreciation · 3.0% rent growth · sell at horizon
- IRR
- -1.2%
- Equity multiple
- 0.95×
- Total profit
- $-1,034
- Equity at exit
- $11,928
- IRR
- 8.5%
- Equity multiple
- 1.65×
- Total profit
- $14,640
- Equity at exit
- $6,917
Cash invested: $22,400 (down + closing). Projections, not guarantees.
Landlord ↔ Tenant lean methodology
- Overall (STATE)
- 81 Strongly Landlord-Friendly
- State Missouri
- 81 Strongly Landlord-Friendly · R+10
- County
- — inherits STATE
- City
- — inherits STATE
ZIP-level market 65747
- Home prices YoY
- -2.5%
- Active inventory
- 232
- Price-to-rent
- 6.4×
Monthly cashflow live
- Estimated rent
- $1,036 medium interval (Pro) →
- Mortgage (P&I)
- −$420
- Tax est. 1.5%
- −$100 /mo · $1,200/yr
- Insurance
- −$33
- Flood insurance flood zone
- −$66 /mo · $798/yr
- HOA
- −$13
- Vacancy / Maint / Mgmt
- −$218
- Net cashflow
- $186
Break-even live
UW: 25.0% down · 7.5% · 30yr · 1.5% tax · 5.0% vac · 8.0% maint · 8.0% mgmt
Financing live
Cash to close
- Down payment
- $20,000
- Closing costs
- $2,400
- Reserves months
- —
- Total cash needed
- —
Loan-product check · same deal, 3 products live
Conventional
25% down · 7.5% · 30yr
- Down + closing
- —
- Monthly P&I
- —
- Monthly cashflow
- —
- DSCR
- —
- Eligible?
- —
Personal DTI + credit; lowest rate.
DSCR
20% down · 8.5% · 30yr
- Down + closing
- —
- Monthly P&I
- —
- Monthly cashflow
- —
- DSCR
- —
- Eligible?
- —
No personal income docs; deal must DSCR.
Hard money
10% down · 12.0% · 12mo
- Down + closing
- —
- Monthly P&I
- —
- Monthly cashflow
- —
- DSCR
- —
- Eligible?
- —
Short-term bridge; refi at stabilization.
HOA detail
- Monthly dues
- $13 · $156/yr
Listing history 18 events
-
2026-06-18days on market $80,000 Active 428 DOM
-
2026-06-17days on market $80,000 Active 427 DOM
-
2026-06-16days on market $80,000 Active 426 DOM
-
2026-06-15days on market $80,000 Active 425 DOM
-
2026-06-13days on market $80,000 Active 423 DOM
-
2026-06-12days on market $80,000 Active 422 DOM
-
2026-06-09days on market $80,000 Active 419 DOM
-
2026-06-08days on market $80,000 Active 418 DOM
-
2026-06-07days on market $80,000 Active 417 DOM
-
2026-06-07days on market $80,000 Active 416 DOM
-
2026-06-04days on market $80,000 Active 413 DOM
-
2026-06-02days on market $80,000 Active 412 DOM
-
2026-06-01days on market $80,000 Active 411 DOM
-
2026-05-31days on market $80,000 Active 410 DOM
-
2026-03-07status Active
-
2025-08-15price $80,000
-
2025-07-24price $99,000
-
2025-04-10$100,000 Active
ⓘ Source: listings_history table (triggers on properties + properties_extension) + one-shot
backfill from property_details.listing_events for pre-trigger history.
Climate risk First Street
- Flood 9/10 Extreme FEMA zone X (unshaded) · 99% chance over 30 yrs
- Wildfire 3/10 Moderate
- Heat 4/10 Moderate 7 d/yr ≥105°F today · 20 d/yr by 30 yrs out
- Wind 2/10 Low 100% chance of damaging wind over 30 yrs
- Air quality 2/10 Low 0 unhealthy d/yr today · 1 by 30 yrs out
Nearby sold comps map
Loading sold comps map…
Walkable amenities ~0.75 mi
Loading nearby amenities…
Taxation est. · year 1
- Rental income
- $12,435
- − Mortgage interest
- −$4,481
- − Property taxes
- −$1,200
- − Insurance
- −$1,198
- − Repairs & maintenance
- −$995
- − Management
- −$995
- − HOA
- −$156
- − Depreciation
- −$2,327
- Taxable income
- $1,083
- Est. tax owed @ 24.0%
- −$260
- After-tax cash flow
- $1,976/yr
For passive investors: Depreciation is non-cash, so a rental often shows a tax loss while cash-flowing — sheltering income. Rental losses are passive: they offset passive income freely, and up to $25,000/yr can offset ordinary (W-2) income if you actively participate and your MAGI is under $100k (phasing out to $0 by $150k); unused losses carry forward. On sale, claimed depreciation is recaptured at up to 25%, and gains may owe capital-gains tax (a 1031 exchange can defer both). Figures are a year-1 estimate at your 24.0% rate — not tax advice; consult a CPA.
Schools (NCES district)
- District
- Shell Knob 78
- NCES district ID
- 2928200
- Math proficiency
- 35% ▬ 0.00%
- Reading proficiency
- 50% ▲ 5.00%
- Median HH income
- $40,205
- Composite
- 37.93/100
- National rank
- #8688
- State rank
- #258 of 535 in MO
Livability — Shell Knob
- Score
- 66/100
- State rank
- #254
- US rank
- #12290
Category grades
Schools grade is shown separately in the Schools card above.
Census & demographics
- Census place
- Shell Knob, MO
- City population
- 3,957
- Population (ZIP)
- 3,957
Population outlook (Stone County) Hauer SSP2
- Today (2025)
- 28,147 people
- By 2030
- 26,405 · -6.2%
- By 2040
- 22,762 · -19.1%
- By 2050
- 19,706 · -30.0%
- By 2075
- 14,742 · -47.6%
- By 2100
- 10,832 · -61.5%
Race, ethnicity, and origin ACS 2023
- Neighborhood character
- Predominantly White (79%)
- Race & ethnicity
- White 79% Two or more races 17% Hispanic / Latino 12% Native American 3%
- Hispanic origin (detail)
- Mexican 6%
- Common ancestry
- Lithuanian 5% Italian 3% Iranian 3%
- Foreign-born
- 3% · Canada
- Languages at home
- 92% English-only · Spanish 8%
Political lean MEDSL · Stone
- 2024 margin
- Solid R (+61.4) · D 18.9% · R 80.3%
- 2008→2024 swing
- -24.1pp toward R · 2008: -37.3pp · 2024: -61.4pp
- All cycles
- 2024: R+61.4 2020: R+61.1 2016: R+62.1 2012: R+49.2 2008: R+37.3
Not yet ingested
- Civics
- —
Market trends
- HPI YoY
- ▼ -6.62%
- Current HPI
- 252.5383
- Rent YoY
- —
- Metro
- —
- State GDP YoY
- ▲ 1.84%
- F500 in state
- 20
Industry mix (Fortune 500 HQ in MO)
| Industry | F500 HQs | Revenue |
|---|---|---|
| Healthcare | 1 | $163B |
|
||
| Insurance | 1 | $21B |
|
||
| Industrial Technology | 1 | $17B |
|
||
| Retail | 1 | $16B |
|
||
| Industrial Distribution | 1 | $10B |
|
||
| Utilities | 1 | $9B |
|
||
Price history
-20.0% since first listed4 events — show timeline
- 2026-03-07 Relisted — SOMO
- 2025-08-15 Price Changed $80,000 SOMO
- 2025-07-24 Price Changed $99,000 SOMO
- 2025-04-10 Listed $100,000 SOMO
Cash-flow waterfall
monthlySold comps — $/sqft
last 12 mo · ≤1 miLoading sold comps…