41-RA Long Pond Rd S · Mashantucket, CT
Flood risk 1/10 · Minimal
- FEMA flood zone
- X (unshaded)
- Chance of flooding over 30 yrs
- 0.0%
- Est. flood insurance / yr
- $507 – $1,088
Fire risk 3/10 · Minor
- Est. fire insurance / yr
- $829 – $1,539
Heat risk 5/10 · Moderate
- Hot days now (above 94°F)
- 7 days/yr
- Hot days in 30 yrs
- 16 days/yr
Wind risk 6/10 · Moderate
- Chance of severe wind over 30 yrs
- 77.0%
Air-quality risk 3/10 · Minor
- Unhealthy air days now
- 3 days/yr
- Unhealthy air days in 30 yrs
- 3 days/yr
Risk factors via First Street. Map © Google.
Why this score? — see what drove the C+ grade
The composite is a weighted blend of 9 inputs, each scored 0–100. Each bar is that input's sub-score; the figure is the points it added to the 100-point composite (weight × sub-score).
- Cash flow +30.0/30.0
- 1% rule +10.0/10.0
- DSCR +10.0/10.0
- Schools +3.9/10.0
- Livability +3.6/5.0
- Rent growth +2.5/5.0
- Condition / age +1.0/5.0
- ARV discount +0.0/15.0
- Appreciation +0.0/10.0
$99,900
🖨 Deal sheet 📄 Offer letter ✓ Due diligence
Listing remarks
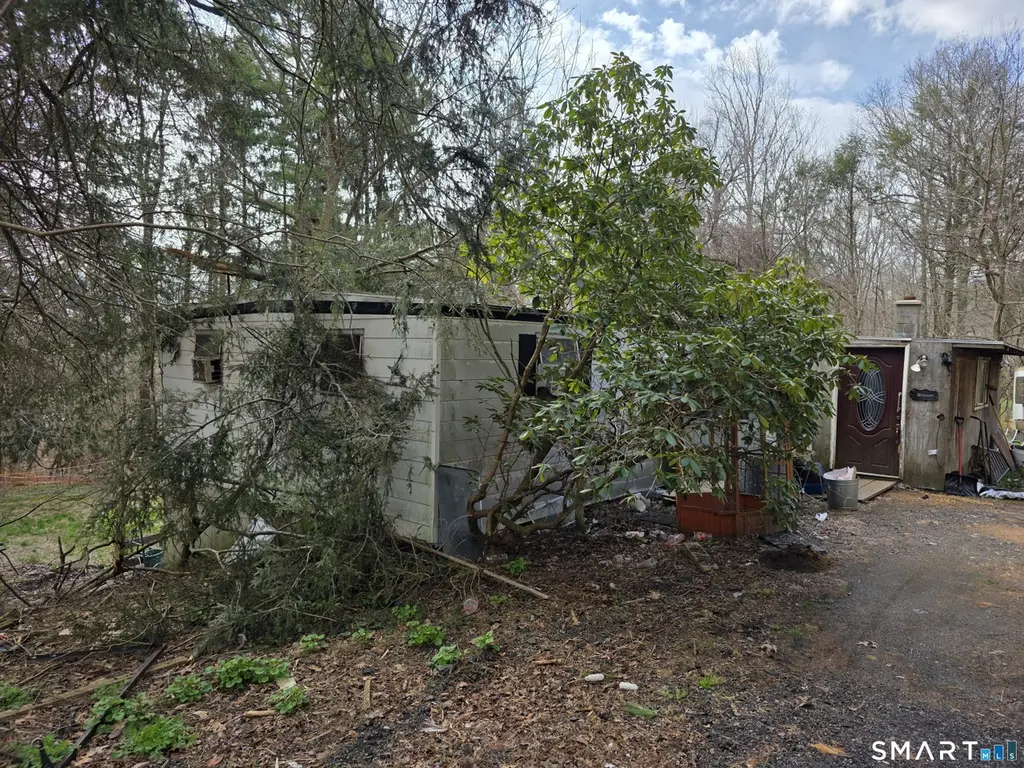
IF YOUR LOOKING FOR A MOBILE HOME ON ITS OWN LAND, THEN HERE IT IS, NEEDS SOME LOTS OF WORK, BUT HAS A FOUNDATION AND NICE CORNER LOT. HAS 3 BEDROOMS. SHED FOR STORAGE AND SHED WAS USED AS STALL ON THE PROPERTY. CLOSE TO FOXWOODS CASINO, MOHEGAN CASINO, RI, AND MYSTIC. COME AND SEE TODAY.
Key facts
- Shed for storage
- Corner lot
- 1.14 acre lot
Tags
Neighborhood map
What this means for you Summary
Snapshot
- This is a 2-bed/1.0-bath single-family listed at $100k. Condition is rated poor.
Deal economics
- At list price, monthly cash flow is $1k ($12k/yr) — positive.
- The deal already cash-flows at list — no discount required.
- Meets the 1% rule at list price ($2k rent vs $100k).
- Cap rate 18.4% vs local median 3.6% in Mashantucket — top-decile yield for the area; either an underpriced asset or a hidden risk that comps aren't pricing in. Stress-test before assuming the spread holds.
Location & tenants
- Location reads 71/100 on livability (#89 in CT) — a middle-class / working-renter tenant base. Strengths: employment A+, housing A+, health & safety A+; Watch: schools D, amenities F, commute F.
- Ledyard School District (rural): math 34% / reading 49% proficiency, ranked #92 of 153 in CT (top 60%) — families likely to look elsewhere, expect single-tenant / working-renter base with shorter leases; only 15% free/reduced lunch — higher-income household profile.
- Market conditions: 36 active listings in the ZIP; 1 comparable units currently listed for rent nearby; 487 units permitted in Southeastern Connecticut Planning Region in 2024 (244 in 5+ unit buildings).
Forward outlook
- Local home prices are declining (-3.0%/yr); year-one equity from $691 of loan paydown is wiped out by about $3k of value loss. Plan a longer hold.
- At projected returns (-3.0% appreciation + 3.0% rent growth), your $28k cash investment doubles in ~3 years — after that, you're playing with house money.
Negotiation context
- Only 8 days on market — expect competitive offers; lowballing is unlikely to land.
Risks & watch-outs
- Climate carrying-cost: major wind risk, 77% chance of damaging wind over 30y; extreme-heat days projected 7→16/yr by 2055 (HVAC capex compounding) — expect insurance premiums to compound above CPI over the hold.
Questions for the listing agent
- Have any recent inspections been done? Can we get a copy of the seller's disclosures and any deferred-maintenance estimates?
- Built in 1963 — when were the roof, HVAC, electrical panel, plumbing, and water heater last replaced?
- Is there a deadline driving the sale (1031 exchange, divorce, estate, relocation)? That informs how much negotiation room exists.
- Schools are D-rated, which usually means shorter tenancies and higher turnover. Who's the typical renter profile here, and what's been the actual vacancy rate?
- What's the average days-on-market for RENTAL listings here right now (not sales)? A rising rental-DOM trend means longer vacancies and softer asking-rent achievability than the comps imply.
- What's the recent tenant-quality profile in this submarket — average credit score on applications, eviction rate, late-payment / NSF rate, and stable-employment percentage? A property-management company in the area should have these aggregated.
- How much new for-sale + rental construction is in the pipeline within 1–3 miles? Heavy new supply typically softens prices + rents 12–24 months out; constrained supply supports both.
Investment metrics
- 1% rule
- 2.15% ✓
- Cap rate
- 18.40%
- Cash-on-cash
- 43.25%
- DSCR
- 2.92
- GRM
- 3.9
CMA / ARV
- ARV (on-the-fly)
- $69,580
- Comps found
- 1
Show comp detail 1 sale within ~0.75 mi
| Address | Dist | Beds/Ba | Sqft | Sold | Price | $/sf | Match |
|---|---|---|---|---|---|---|---|
| 552 Lantern Hill Rd | 0.53mi | 2/1.0 | 840 (-14%) | 15mo | $60,000 | $71 | 38 |
Match score weights: distance 35% · size 25% · config 20% · recency 20%. Top-matched comps best support the ARV.
Projected returns pro-forma
-3.0% appreciation · 3.0% rent growth · sell at horizon
- IRR
- 40.1%
- Equity multiple
- 2.72×
- Total profit
- $48,052
- Equity at exit
- $14,895
- IRR
- 46.4%
- Equity multiple
- 5.46×
- Total profit
- $124,651
- Equity at exit
- $8,638
Cash invested: $27,972 (down + closing). Projections, not guarantees.
Landlord ↔ Tenant lean methodology
- Overall (STATE)
- 27 Tenant-Leaning
- State Connecticut
- 27 Tenant-Leaning · D+7
- County
- — inherits STATE
- City
- — inherits STATE
ZIP-level market 06339
- Home prices YoY
- -19.4%
- Active inventory
- 36
- Price-to-rent
- 3.9×
Monthly cashflow live
- Estimated rent
- $2,150 medium interval (Pro) →
- Mortgage (P&I)
- −$524
- Tax est. 1.5%
- −$125 /mo · $1,498/yr
- Insurance
- −$42
- HOA
- −$0
- Vacancy / Maint / Mgmt
- −$452
- Net cashflow
- $1,008
Break-even live
UW: 25.0% down · 7.5% · 30yr · 1.5% tax · 5.0% vac · 8.0% maint · 8.0% mgmt
Financing live
Cash to close
- Down payment
- $24,975
- Closing costs
- $2,997
- Reserves months
- —
- Total cash needed
- —
Loan-product check · same deal, 3 products live
Conventional
25% down · 7.5% · 30yr
- Down + closing
- —
- Monthly P&I
- —
- Monthly cashflow
- —
- DSCR
- —
- Eligible?
- —
Personal DTI + credit; lowest rate.
DSCR
20% down · 8.5% · 30yr
- Down + closing
- —
- Monthly P&I
- —
- Monthly cashflow
- —
- DSCR
- —
- Eligible?
- —
No personal income docs; deal must DSCR.
Hard money
10% down · 12.0% · 12mo
- Down + closing
- —
- Monthly P&I
- —
- Monthly cashflow
- —
- DSCR
- —
- Eligible?
- —
Short-term bridge; refi at stabilization.
Rent comps 1 comps
| Address | Beds | Baths | Sqft | Rent | $/sqft | DOM | Units | Dist |
|---|---|---|---|---|---|---|---|---|
| 50 Town Farm Rd Unit A Ledyard, CT | 2.0 | 1.5 | 1100 | $2,150 | $1.95 | 12d | 1 | 1.30mi |
Listing history 2 events
-
2026-04-23status Under Contract
-
2026-04-15$99,900 Active
ⓘ Source: listings_history table (triggers on properties + properties_extension) + one-shot
backfill from property_details.listing_events for pre-trigger history.
Climate risk First Street
- Flood 1/10 Low FEMA zone X (unshaded) · 0% chance over 30 yrs
- Wildfire 3/10 Moderate
- Heat 5/10 Major 7 d/yr ≥94°F today · 16 d/yr by 30 yrs out
- Wind 6/10 Major 77% chance of damaging wind over 30 yrs
- Air quality 3/10 Moderate 3 unhealthy d/yr today · 3 by 30 yrs out
Nearby sold comps map
Loading sold comps map…
Walkable amenities ~0.75 mi
Loading nearby amenities…
Taxation est. · year 1
- Rental income
- $25,800
- − Mortgage interest
- −$5,596
- − Property taxes
- −$1,498
- − Insurance
- −$500
- − Repairs & maintenance
- −$2,064
- − Management
- −$2,064
- − Depreciation
- −$2,906
- Taxable income
- $11,172
- Est. tax owed @ 24.0%
- −$2,681
- After-tax cash flow
- $9,416/yr
For passive investors: Depreciation is non-cash, so a rental often shows a tax loss while cash-flowing — sheltering income. Rental losses are passive: they offset passive income freely, and up to $25,000/yr can offset ordinary (W-2) income if you actively participate and your MAGI is under $100k (phasing out to $0 by $150k); unused losses carry forward. On sale, claimed depreciation is recaptured at up to 25%, and gains may owe capital-gains tax (a 1031 exchange can defer both). Figures are a year-1 estimate at your 24.0% rate — not tax advice; consult a CPA.
Condition & rehab AI · 14 photos
This property requires extensive repairs and maintenance, including roof replacement, exterior siding repair, flooring replacement, interior wall repair, HVAC and mechanical system repair, and landscaping and debris removal. The property is currently in poor condition and will need significant work to become move-in ready.
Repairs flagged
- Major roof — The roof is visibly damaged and in need of replacement.
- Major exterior siding — The exterior siding is peeling and damaged, requiring replacement.
- Major flooring — The flooring is damaged and in poor condition, requiring replacement.
- Major interior walls — The interior walls are in poor condition, with visible damage and wear, requiring repair or replacement.
- Major HVAC and mechanical systems — The HVAC and mechanical systems are in poor condition, with visible damage and debris, requiring repair or replacement.
Value-add opportunities
- Resale Roof replacement — A new roof will significantly improve the home's appearance and increase its resale value.
- Resale Exterior siding repair/replacement — A new exterior siding will improve the home's curb appeal and increase its resale value.
- Resale Flooring replacement — A new flooring will improve the home's appearance and increase its resale value.
- Resale Interior wall repair/replacement — A new interior wall will improve the home's appearance and increase its resale value.
- Resale HVAC and mechanical system repair/replacement — A new HVAC and mechanical system will improve the home's comfort and increase its resale value.
- Both Landscaping and debris removal — Landscaping and debris removal will improve the home's curb appeal and increase its resale and rental value.
Renovation cost estimate screening
| Repair item | Severity | Est. cost |
|---|---|---|
| roof · The roof is visibly damaged and in need of replacement. | Major | $15,000–50,000 |
| exterior siding · The exterior siding is peeling and damaged, requiring replacement. | Major | $15,000–50,000 |
| flooring · The flooring is damaged and in poor condition, requiring replacement. | Major | $15,000–50,000 |
| interior walls · The interior walls are in poor condition, with visible damage and wear, requiring repair or replacement. | Major | $15,000–50,000 |
| HVAC and mechanical systems · The HVAC and mechanical systems are in poor condition, with visible damage and debris, requiring repair or replacement. | Major | $15,000–50,000 |
| Total estimated repair cost · 5 items | $75,000–250,000 |
Value-add ROI direction
- Resale Roof replacement — A new roof will significantly improve the home's appearance and increase its resale value. ↑
- Resale Exterior siding repair/replacement — A new exterior siding will improve the home's curb appeal and increase its resale value. ↑
- Resale Flooring replacement — A new flooring will improve the home's appearance and increase its resale value. ↑
- Resale Interior wall repair/replacement — A new interior wall will improve the home's appearance and increase its resale value. ↑
- Resale HVAC and mechanical system repair/replacement — A new HVAC and mechanical system will improve the home's comfort and increase its resale value. ↑
- Both Landscaping and debris removal — Landscaping and debris removal will improve the home's curb appeal and increase its resale and rental value. ↑
ⓘ Cost ranges are severity-bucket heuristics (US national rule-of-thumb). Get contractor quotes + a written scope before underwriting a rehab budget.
Schools (NCES district)
- District
- Ledyard School District
- NCES district ID
- 0902160
- Math proficiency
- 34% ▼ -12.00%
- Reading proficiency
- 49% ▼ -6.00%
- Median HH income
- $84,854
- Composite
- 39.02/100
- National rank
- #4064
- State rank
- #92 of 153 in CT
Livability — Mashantucket
- Score
- 71/100
- State rank
- #89
- US rank
- #6996
Category grades
Schools grade is shown separately in the Schools card above.
Census & demographics
- City population
- 62
- Population (ZIP)
- 9,263
Population outlook (Southeastern Connecticut County) Hauer SSP2
- By 2040
- 293,442
Race, ethnicity, and origin ACS 2023
- Neighborhood character
- Predominantly White (80%)
- Race & ethnicity
- White 80% Hispanic / Latino 9% Two or more races 6% Asian 3% Black 2% Native American 1%
- Hispanic origin (detail)
- Mexican 1% Puerto Rican 5%
- Common ancestry
- Romanian 4% Italian 2% Lithuanian 2%
- Foreign-born
- 5% · Canada, China, Jamaica
- Languages at home
- 91% English-only · Spanish 5% Chinese 2% Russian/Polish/Slavic 1%
Political lean MEDSL · Southeastern Connecticut
- 2024 margin
- D (+13.0) · D 55.6% · R 42.6% · Other 1.8%
- All cycles
- 2024: D+13.0
Not yet ingested
- Civics
- —
Market trends
- HPI YoY
- ▼ -61.39%
- Current HPI
- 255.764
- Rent YoY
- —
- Metro
- —
- State GDP YoY
- ▲ 1.06%
- F500 in state
- 38
Industry mix (Fortune 500 HQ in CT)
| Industry | F500 HQs | Revenue |
|---|---|---|
| Industrial Machinery | 4 | $38B |
|
||
| Insurance | 3 | $71B |
|
||
| Financial Services | 2 | $25B |
|
||
| Transportation / Logistics | 2 | $18B |
|
||
| Healthcare | 1 | $247B |
|
||
| Telecommunications | 1 | $55B |
|
||
Price history
2 events — show timeline
- 2026-04-23 Pending — Smart MLS
- 2026-04-15 Listed $99,900 Smart MLS
Cash-flow waterfall
monthlySold comps — $/sqft
last 12 mo · ≤1 miLoading sold comps…