174 Esther Ct · Tri-City, OR
Flood risk 1/10 · Minimal
- FEMA flood zone
- X (unshaded)
- Chance of flooding over 30 yrs
- 0.0%
- Est. flood insurance / yr
- $507 – $1,088
Fire risk 7/10 · Major
- Est. fire insurance / yr
- $498 – $926
Heat risk 6/10 · Moderate
- Hot days now (above 95°F)
- 7 days/yr
- Hot days in 30 yrs
- 16 days/yr
Wind risk 1/10 · Minimal
- Chance of severe wind over 30 yrs
- —
Air-quality risk 9/10 · Severe
- Unhealthy air days now
- 13 days/yr
- Unhealthy air days in 30 yrs
- 14 days/yr
Risk factors via First Street. Map © Google.
Why this score? — see what drove the B- grade
The composite is a weighted blend of 9 inputs, each scored 0–100. Each bar is that input's sub-score; the figure is the points it added to the 100-point composite (weight × sub-score).
- Cash flow +30.0/30.0
- DSCR +10.0/10.0
- 1% rule +9.7/10.0
- ARV discount +7.5/15.0
- Rent growth +2.5/5.0
- Livability +2.5/5.0
- Condition / age +2.5/5.0
- Schools +2.3/10.0
- Appreciation +0.0/10.0
$116,000
🖨 Deal sheet 📄 Offer letter ✓ Due diligence
Listing remarks MLS
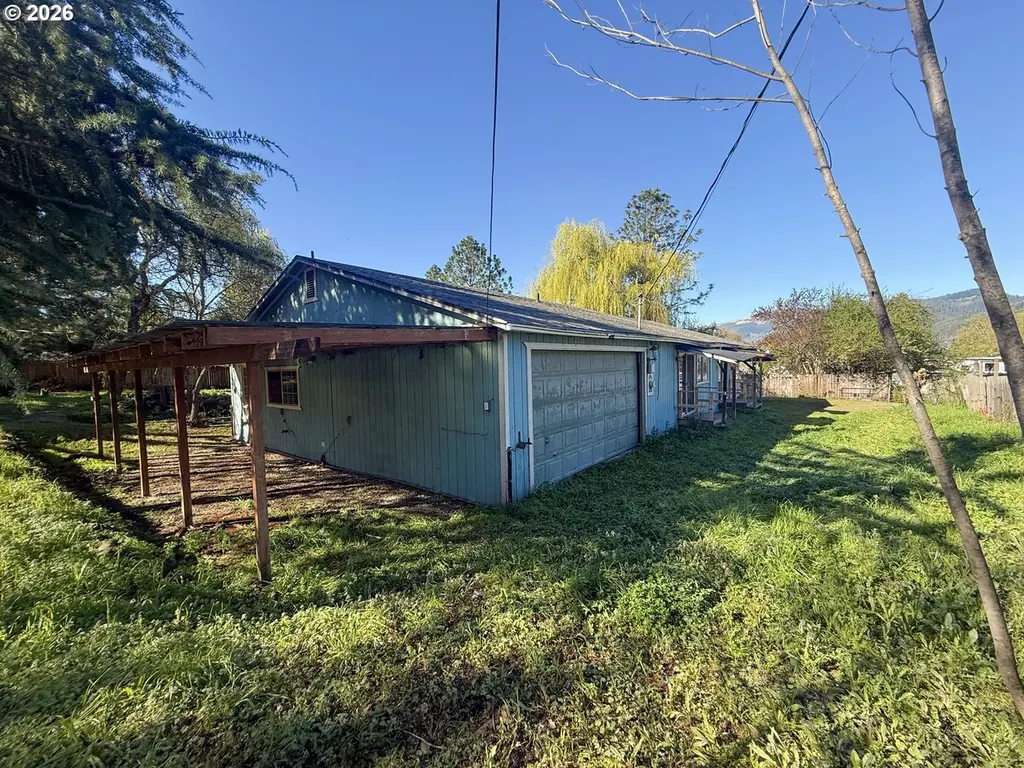
UNFINISHED REMODEL 1750 SQ. FT. HOME ON .42 OF AN ACRE. CALL FIRST BECAUSE OF DOG.
Key facts
- 0.42 acre lot
- 2 garage spots
- Built 1982
Property features AI
Finance
- Other: Flag lot parcel (Parcel R31966)
- HOA & community: Not a senior community
Exterior
- Parking: Attached carport; Driveway parking; 2 parking spaces total (including garage/carport)
- Utilities: Public water; Public sewer; Electricity
- Home design: Single-family residence; Residential property; Fixer condition; Main-level living area; Built in 1982; No view indicated
- Construction: Composition roof; Built in 1982; T-111 siding
- Exterior features: T-111 siding; Flag lot; Private lot; Gravel road access; Creek on the property (waterfront)
Interior
- Kitchen: Built-in oven; Cooktop
- Bedrooms: Primary bedroom (Main level); Second bedroom; Third bedroom
- Bathrooms: 2 full bathrooms (both on main level)
- Heating & cooling: Wall heater; No central heating listed; No cooling listed
- Interior features: Family room; Great Room; Living room; Dining room
Neighborhood map
What this means for you Summary
Snapshot
- This is a 3-bed/2.0-bath single-family listed at $116k.
Deal economics
- At list price, monthly cash flow is $602 ($7k/yr) — positive.
- The deal already cash-flows at list — no discount required.
- Meets the 1% rule at list price ($2k rent vs $116k).
- Cap rate 12.5% vs local median 3.3% in Tri-City — top-decile yield for the area; either an underpriced asset or a hidden risk that comps aren't pricing in. Stress-test before assuming the spread holds.
Location & tenants
- Location reads: area grade B — affects rentability + tenant quality, not the cash-flow math above.
- South Umpqua SD 19 (town): math 21% / reading 34% proficiency, ranked #51 of 58 in OR (top 88%) — low school quality limits family demand, transient renter base, plan for 1-2y turnover; 61% free/reduced lunch — lower-income household profile, screen leases tightly.
- Zoned schools: Tri City Elementary School (math 15% / reading 34%, grade F, #309 of 412 statewide, top 77%, 285 students, 70% FRL); Coffenberry Middle School (math 22% / reading 32%, grade F, #96 of 128 statewide, top 78%, 284 students, 72% FRL); South Umpqua High School (math 24% / reading 44%, grade F, #94 of 143 statewide, top 70%, 443 students, 72% FRL).
- Market conditions: 125 active listings in the ZIP; 190 units permitted in Douglas County in 2024 (0 in 5+ unit buildings).
Forward outlook
- Local home prices are declining (-3.0%/yr); year-one equity from $802 of loan paydown is wiped out by about $3k of value loss. Plan a longer hold.
- Douglas County population projected at -13% by 2050 — secular population decline; favor cash flow + early exit over multi-decade hold.
- At projected returns (-3.0% appreciation + 3.0% rent growth), your $32k cash investment doubles in ~6 years — after that, you're playing with house money.
Negotiation context
- Only 7 days on market — expect competitive offers; lowballing is unlikely to land.
- 2 sale attempts since 24y ago with the ask held roughly flat each time — persistent listings suggest the price (not the market) is what's stuck; bring a comps-based counter.
- Current owner paid $41k; list at $116k implies a 183% gain — meaningful room to come down on a strong offer.
Risks & watch-outs
- Climate carrying-cost: major wildfire risk; extreme-heat days projected 7→16/yr by 2055 (HVAC capex compounding) — expect insurance premiums to compound above CPI over the hold.
Questions for the listing agent
- Is there a deadline driving the sale (1031 exchange, divorce, estate, relocation)? That informs how much negotiation room exists.
- What's the average days-on-market for RENTAL listings here right now (not sales)? A rising rental-DOM trend means longer vacancies and softer asking-rent achievability than the comps imply.
- What's the recent tenant-quality profile in this submarket — average credit score on applications, eviction rate, late-payment / NSF rate, and stable-employment percentage? A property-management company in the area should have these aggregated.
- How much new for-sale + rental construction is in the pipeline within 1–3 miles? Heavy new supply typically softens prices + rents 12–24 months out; constrained supply supports both.
Investment metrics
- 1% rule
- 1.47% ✓
- Cap rate
- 12.52%
- Cash-on-cash
- 22.26%
- DSCR
- 1.99
- GRM
- 5.7
CMA / ARV
- ARV (on-the-fly)
- $399,600
- Comps found
- 8
Show comp detail 8 sales within ~0.75 mi
| Address | Dist | Beds/Ba | Sqft | Sold | Price | $/sf | Match |
|---|---|---|---|---|---|---|---|
| 434 S Old Pacific Hwy | 0.31mi | 3/2.0 | 1,680 (-5%) | 6mo | $420,000 | $250 | 72 |
| 540 Taylor St | 0.32mi | 3/2.0 | 1,882 (+6%) | 7mo | $370,000 | $197 | 69 |
| 337 Jodee St | 0.27mi | 3/3.0 | 1,856 (+4%) | 14mo | $449,000 | $242 | 64 |
| 242 Celestial Way | 0.16mi | 3/1.0 | 1,680 (-5%) | 23mo | $170,500 | $101 | 60 |
| 110 W Ridge Ln | 0.43mi | 3/2.0 | 1,936 (+9%) | 23mo | $485,000 | $251 | 46 |
| 442 Leslie Ln | 0.39mi | 3/3.0 | 2,000 (+13%) | 17mo | $329,500 | $165 | 43 |
| 335 Gentry Loop | 0.63mi | 3/2.0 | 1,581 (-11%) | 12mo | $355,000 | $225 | 42 |
| 448 Gentry Loop | 0.62mi | 3/2.0 | 1,581 (-11%) | 19mo | $305,000 | $193 | 37 |
Match score weights: distance 35% · size 25% · config 20% · recency 20%. Top-matched comps best support the ARV.
Projected returns pro-forma
-3.0% appreciation · 3.0% rent growth · sell at horizon
- IRR
- 15.0%
- Equity multiple
- 1.60×
- Total profit
- $19,564
- Equity at exit
- $17,296
- IRR
- 23.7%
- Equity multiple
- 3.04×
- Total profit
- $66,410
- Equity at exit
- $10,030
Cash invested: $32,480 (down + closing). Projections, not guarantees.
Landlord ↔ Tenant lean methodology
- Overall (STATE)
- 28 Tenant-Leaning
- State Oregon
- 28 Tenant-Leaning · D+6
- County
- — inherits STATE
- City
- — inherits STATE
ZIP-level market 97457
- Home prices YoY
- -18.1%
- Active inventory
- 125
- Price-to-rent
- 5.7×
Monthly cashflow live
- Estimated rent
- $1,708 medium interval (Pro) →
- Mortgage (P&I)
- −$608
- Tax from tax record
- −$90 /mo · $1,085/yr
- Insurance
- −$48
- HOA
- −$0
- Vacancy / Maint / Mgmt
- −$359
- Net cashflow
- $602
Break-even live
UW: 25.0% down · 7.5% · 30yr · 1.5% tax · 5.0% vac · 8.0% maint · 8.0% mgmt
Financing live
Cash to close
- Down payment
- $29,000
- Closing costs
- $3,480
- Reserves months
- —
- Total cash needed
- —
Loan-product check · same deal, 3 products live
Conventional
25% down · 7.5% · 30yr
- Down + closing
- —
- Monthly P&I
- —
- Monthly cashflow
- —
- DSCR
- —
- Eligible?
- —
Personal DTI + credit; lowest rate.
DSCR
20% down · 8.5% · 30yr
- Down + closing
- —
- Monthly P&I
- —
- Monthly cashflow
- —
- DSCR
- —
- Eligible?
- —
No personal income docs; deal must DSCR.
Hard money
10% down · 12.0% · 12mo
- Down + closing
- —
- Monthly P&I
- —
- Monthly cashflow
- —
- DSCR
- —
- Eligible?
- —
Short-term bridge; refi at stabilization.
Listing history 6 events
-
2026-05-12status Pending
-
2026-05-07$116,000 Active
-
2015-03-12soldstatus $41,000
-
2002-06-07soldstatus $64,000 82-char remark
Show marketing remark (82 chars)
UNFINISHED REMODEL 1750 SQ. FT. HOME ON .42 OF AN ACRE. CALL FIRST BECAUSE OF DOG.
-
2002-06-07soldstatus $64,000
Show marketing remark (82 chars)
UNFINISHED REMODEL 1750 SQ. FT. HOME ON .42 OF AN ACRE. CALL FIRST BECAUSE OF DOG.
-
2002-01-14$67,000 82-char remark
Show marketing remark (82 chars)
UNFINISHED REMODEL 1750 SQ. FT. HOME ON .42 OF AN ACRE. CALL FIRST BECAUSE OF DOG.
ⓘ Source: listings_history table (triggers on properties + properties_extension) + one-shot
backfill from property_details.listing_events for pre-trigger history.
Tax reassessment forecast OR · Resets to sale price
- Current annual tax
- $1,085 · $90/mo
- Projected year-2 tax
- $1,125 · $94/mo
- Expected delta
- +$40/yr (+$3/mo · 3.7%)
ⓘ Screening estimate from a state-policy table — verify with the county assessor before closing.
Climate risk First Street
- Flood 1/10 Low FEMA zone X (unshaded) · 0% chance over 30 yrs
- Wildfire 7/10 Severe
- Heat 6/10 Major 7 d/yr ≥95°F today · 16 d/yr by 30 yrs out
- Wind 1/10 Low
- Air quality 9/10 Extreme 13 unhealthy d/yr today · 14 by 30 yrs out
Nearby sold comps map
Loading sold comps map…
Walkable amenities ~0.75 mi
Loading nearby amenities…
Taxation est. · year 1
- Rental income
- $20,499
- − Mortgage interest
- −$6,498
- − Property taxes
- −$1,085
- − Insurance
- −$580
- − Repairs & maintenance
- −$1,640
- − Management
- −$1,640
- − Depreciation
- −$3,375
- Taxable income
- $5,681
- Est. tax owed @ 24.0%
- −$1,364
- After-tax cash flow
- $5,866/yr
For passive investors: Depreciation is non-cash, so a rental often shows a tax loss while cash-flowing — sheltering income. Rental losses are passive: they offset passive income freely, and up to $25,000/yr can offset ordinary (W-2) income if you actively participate and your MAGI is under $100k (phasing out to $0 by $150k); unused losses carry forward. On sale, claimed depreciation is recaptured at up to 25%, and gains may owe capital-gains tax (a 1031 exchange can defer both). Figures are a year-1 estimate at your 24.0% rate — not tax advice; consult a CPA.
Schools (NCES district)
- District
- South Umpqua SD 19
- NCES district ID
- 4111610
- Math proficiency
- 21% ▼ -5.00%
- Reading proficiency
- 34% ▼ -12.00%
- Median HH income
- $38,796
- Composite
- 23.01/100
- National rank
- #7976
- State rank
- #51 of 58 in OR
Livability — Tri-City
No livability data for this city. (Only ~50 U.S. cities are tracked.)
Census & demographics
- Census place
- Tri-City, OR
- Population (ZIP)
- 10,158
Population outlook (Douglas County) Hauer SSP2
- Today (2025)
- 105,191 people
- By 2030
- 102,664 · -2.4%
- By 2040
- 96,668 · -8.1%
- By 2050
- 91,279 · -13.2%
- By 2075
- 79,395 · -24.5%
- By 2100
- 66,107 · -37.2%
Race, ethnicity, and origin ACS 2023
- Neighborhood character
- Predominantly White (87%)
- Race & ethnicity
- White 87% Two or more races 8% Hispanic / Latino 6% Native American 1%
- Hispanic origin (detail)
- Mexican 4%
- Common ancestry
- Portuguese 4% Lithuanian 3% Slovak 3%
- Foreign-born
- 2% · Canada
- Languages at home
- 97% English-only · Spanish 1%
Political lean MEDSL · Douglas
- 2024 margin
- Solid R (+37.7) · D 29.9% · R 67.6% · Other 2.5%
- 2008→2024 swing
- -17.6pp toward R · 2008: -20.1pp · 2024: -37.7pp
- All cycles
- 2024: R+37.7 2020: R+37.5 2016: R+39.4 2012: R+27.6 2008: R+20.1
Not yet ingested
- Civics
- —
Market trends
- HPI YoY
- ▼ -76.88%
- Current HPI
- 348.9631
- Rent YoY
- —
- Metro
- —
- State GDP YoY
- ▲ 2.05%
- F500 in state
- 2
Industry mix (Fortune 500 HQ in OR)
| Industry | F500 HQs | Revenue |
|---|---|---|
| Consumer Goods | 1 | $51B |
|
||
Price history
+73.1% since first listed6 events — show timeline
- 2026-05-12 Pending — RMLS
- 2026-05-07 Listed $116,000 RMLS
- 2015-03-12 Sold (Public Records) $41,000 Public Records
- 2002-06-07 Sold (Public Records) $64,000 Public Records
- 2002-06-07 Sold (MLS) $64,000 RMLS
- 2002-01-14 Listed $67,000 RMLS
Property tax history
+7.1%/yrLatest (2025): $1,085 · +83.5% YoY. Source: county tax records.
Cash-flow waterfall
monthlySold comps — $/sqft
last 12 mo · ≤1 miLoading sold comps…