 🔨 Auction
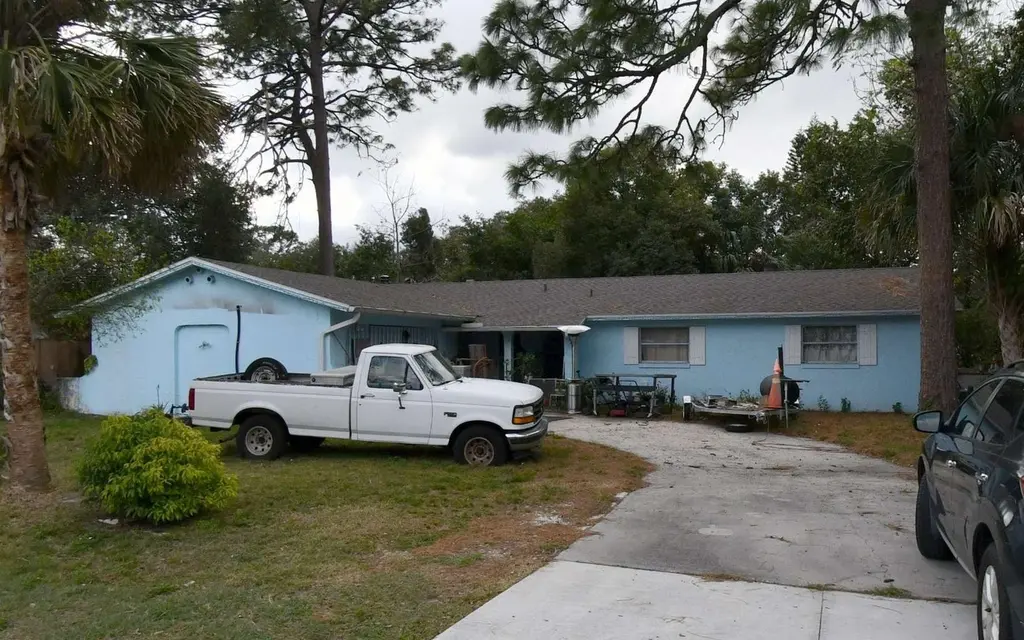
288 Sheppard St · Altamonte Springs, FL
Flood risk 1/10 · Minimal
- FEMA flood zone
- X (unshaded)
- Chance of flooding over 30 yrs
- 0.0%
- Est. flood insurance / yr
- $507 – $1,088
Fire risk 1/10 · Minimal
- Est. fire insurance / yr
- $947 – $1,759
Heat risk 8/10 · Major
- Hot days now (above 108°F)
- 7 days/yr
- Hot days in 30 yrs
- 22 days/yr
Wind risk 9/10 · Severe
- Chance of severe wind over 30 yrs
- 99.0%
Air-quality risk 2/10 · Minimal
- Unhealthy air days now
- 1 days/yr
- Unhealthy air days in 30 yrs
- 1 days/yr
Risk factors via First Street. Map © Google.
Why this score? — see what drove the F grade
The composite is a weighted blend of 9 inputs, each scored 0–100. Each bar is that input's sub-score; the figure is the points it added to the 100-point composite (weight × sub-score).
- ARV discount +7.5/15.0
- Schools +5.1/10.0
- Livability +4.1/5.0
- Cash flow +4.0/30.0
- Condition / age +2.5/5.0
- Rent growth +2.1/5.0
- 1% rule +0.2/10.0
- DSCR +0.0/10.0
- Appreciation +0.0/10.0
$5,000
🖨 Deal sheet (PDF) 📄 Offer letter ✓ Due diligence
Listing remarks
Foreclosure Auction Ends June 2, 2026 at 11:00 AM EST. Explore this charming 3-bedroom, 2-bath residence set in a peaceful and well-located Altamonte Springs community. The list price is the opening bid for the online auction. Sold As-is. Explore more details and submit your bid through Federa.
Key facts
- 2 garage spots
- Listed 6 days
Property features AI
Exterior
- Parking: Attached or detached 2-car garage
- Home design: Residential property; One-story
- Exterior features: Lot approximately 0.29 acre; Zoned R-1AA
Interior
- Bathrooms: Two full bathrooms
- Interior features: Single-story layout
Neighborhood map
What this means for you Summary
Snapshot
- This is a 3-bed/2.0-bath single-family listed at $5k.
Deal economics
- At list price, monthly cash flow is $-1k ($-14k/yr) — negative.
- The deal already cash-flows at list — no discount required.
- Meets the 1% rule at list price ($2k rent vs $5k).
Location & tenants
- Location reads 82/100 on livability (#62 in FL, #1,095 nationally) — a professional / high-income tenant draw. Strengths: commute A+, cost of living A+, housing A+; Watch: employment C-, crime D+, amenities D-.
- Seminole (suburban): math 57% / reading 61% proficiency, ranked #13 of 73 in FL (top 18%) — acceptable for families but not a draw, mixed tenant base, ~2y average lease.
- Market conditions: Rents soft (-1.5%/yr); 200 active listings in the ZIP; 35 comparable units currently listed for rent nearby; rentals at typical pace (median 19d on market — plan ~3-4 weeks tenant-placement turnaround); 1,979 units permitted in Seminole County in 2024 (1,191 in 5+ unit buildings).
- This rent runs 40% of the median local income ($62k/yr) — at the standard rent-burdened threshold; future hikes will face affordability resistance.
Forward outlook
- Local home prices are declining (-3.0%/yr); year-one equity from $3k of loan paydown is wiped out by about $12k of value loss. Plan a longer hold.
- Seminole County population projected at +24% by 2050 — long-run rental-demand tailwind backs the buy-and-hold thesis.
Negotiation context
- Only 6 days on market — expect competitive offers; lowballing is unlikely to land.
Risks & watch-outs
- Watch-outs: property tax is 120.8% of price.
- Climate carrying-cost: severe wind risk, 99% chance of damaging wind over 30y; extreme-heat days projected 7→22/yr by 2055 (HVAC capex compounding) — expect insurance premiums to compound above CPI over the hold.
Questions for the listing agent
- What do current leases actually rent for vs. the listed asking? Can we see a recent rent roll and the last 12 months of T-12 income?
- Built in 1973 — when were the roof, HVAC, electrical panel, plumbing, and water heater last replaced?
- Property tax is high relative to price — has the assessment been appealed recently, and will the sale trigger a re-assessment?
- Is there a deadline driving the sale (1031 exchange, divorce, estate, relocation)? That informs how much negotiation room exists.
- Crime grade is D in this area — have there been break-ins, vandalism, or insurance claims at this property in the last 3 years? What carrier currently insures it and at what premium?
- The area grade is low — what's the realistic commute time and amenity access for the typical tenant pool here? Any planned neighborhood developments (good or bad) we should know about?
- What's the average days-on-market for RENTAL listings here right now (not sales)? A rising rental-DOM trend means longer vacancies and softer asking-rent achievability than the comps imply.
- What's the recent tenant-quality profile in this submarket — average credit score on applications, eviction rate, late-payment / NSF rate, and stable-employment percentage? A property-management company in the area should have these aggregated.
- How much new for-sale + rental construction is in the pipeline within 1–3 miles? Heavy new supply typically softens prices + rents 12–24 months out; constrained supply supports both.
Investment metrics
- 1% rule
- 0.52% ✗
- Cap rate
- 2.91%
- Cash-on-cash
- -12.08%
- DSCR
- 0.46
- GRM
- 16.1
CMA / ARV
- ARV (on-the-fly)
- $402,711
- Comps found
- 12
Show comp detail 12 sales within ~0.75 mi
| Address | Dist | Beds/Ba | Sqft | Sold | Price | $/sf | Match |
|---|---|---|---|---|---|---|---|
| 246 Ridgewood St | 0.12mi | 3/2.0 | 1,583 (-5%) | 2mo | $392,900 | $248 | 84 |
| 1823 North St | 0.34mi | 3/2.0 | 1,650 (-1%) | 5mo | $387,903 | $235 | 78 |
| 138 Meadowlark Dr | 0.33mi | 3/2.0 | 1,642 (-2%) | 5mo | $355,000 | $216 | 77 |
| 344 Ridgewood St | 0.23mi | 3/2.0 | 1,557 (-7%) | 4mo | $480,000 | $308 | 75 |
| 476 Homer Ave | 0.49mi | 3/2.0 | 1,672 (+0%) | 3mo | $410,000 | $245 | 75 |
| 425 E Orange St | 0.53mi | 3/2.0 | 1,702 (+2%) | 2mo | $410,500 | $241 | 70 |
| 328 Alpine St | 0.22mi | 4/2.0 (+1) | 1,766 (+6%) | 6mo | $415,000 | $235 | 70 |
| 309 Alpine St | 0.14mi | 3/2.0 | 1,449 (-13%) | 4mo | $385,000 | $266 | 68 |
| 310 Tangerine St | 0.45mi | 3/2.0 | 1,545 (-8%) | 5mo | $375,000 | $243 | 63 |
| 233 W Citrus St | 0.62mi | 3/2.5 | 1,736 (+4%) | 5mo | $339,500 | $196 | 59 |
| 546 Alpine St | 0.72mi | 4/2.0 (+1) | 1,761 (+5%) | 2mo | $425,000 | $241 | 51 |
| 305 Robin Hill Dr | 0.46mi | 4/2.0 (+1) | 1,919 (+15%) | 4mo | $335,000 | $175 | 45 |
Match score weights: distance 35% · size 25% · config 20% · recency 20%. Top-matched comps best support the ARV.
Projected returns pro-forma
-3.0% appreciation · 0.0% rent growth · sell at horizon
- IRR
- -41.8%
- Equity multiple
- -0.27×
- Total profit
- $-143,633
- Equity at exit
- $60,046
- IRR
- -91.8%
- Equity multiple
- -1.14×
- Total profit
- $-241,661
- Equity at exit
- $34,819
Cash invested: $112,759 (down + closing). Projections, not guarantees.
Landlord ↔ Tenant lean methodology
- Overall (STATE)
- 87 Strongly Landlord-Friendly
- State Florida
- 87 Strongly Landlord-Friendly · R+3
- County
- — inherits STATE
- City
- — inherits STATE
ZIP-level market 32701
- Home prices YoY
- -34.4%
- Rents YoY
- -1.5%
- Active inventory
- 200
- Price-to-rent
- 0.2×
Monthly cashflow live
- Estimated rent
- $2,086 high interval (Pro) →
- Mortgage (P&I)
- −$2,112
- Tax est. 1.5%
- −$503 /mo · $6,041/yr
- Insurance
- −$168
- HOA
- −$0
- Vacancy / Maint / Mgmt
- −$438
- Net cashflow
- $-1,135
Break-even live
Sensitivity live
| Price | -10% $-857 | -5% $-996 | +0% $-1,135 | +5% $-1,274 | +10% $-1,413 |
|---|---|---|---|---|---|
| Rent | -10% $-1,300 | -5% $-1,217 | +0% $-1,135 | +5% $-1,053 | +10% $-970 |
| Rate | -1.0pp $-932 | -0.5pp $-1,033 | base $-1,135 | +0.5pp $-1,239 | +1.0pp $-1,346 |
UW: 25.0% down · 7.5% · 30yr · 1.5% tax · 5.0% vac · 8.0% maint · 8.0% mgmt
Financing live
Cash to close
- Down payment
- $100,678
- Closing costs
- $12,081
- Reserves months
- —
- Total cash needed
- —
Loan-product check · same deal, 3 products live
Conventional
25% down · 7.5% · 30yr
- Down + closing
- —
- Monthly P&I
- —
- Monthly cashflow
- —
- DSCR
- —
- Eligible?
- —
Personal DTI + credit; lowest rate.
DSCR
20% down · 8.5% · 30yr
- Down + closing
- —
- Monthly P&I
- —
- Monthly cashflow
- —
- DSCR
- —
- Eligible?
- —
No personal income docs; deal must DSCR.
Hard money
10% down · 12.0% · 12mo
- Down + closing
- —
- Monthly P&I
- —
- Monthly cashflow
- —
- DSCR
- —
- Eligible?
- —
Short-term bridge; refi at stabilization.
Rent comps 35 comps
| Address | Beds | Baths | Sqft | Rent | $/sqft | DOM | Units | Dist |
|---|---|---|---|---|---|---|---|---|
| 700 Altamira Cir Altamonte Springs, FL | 1.0–2.0 | 1.0–2.0 | 825 | $1,810 | $2.19 | 2d | 33 | 0.53mi |
| 940 Douglas Ave Altamonte Springs, FL | 1.0–2.0 | 1.0–2.0 | 1020 | $1,600 | $1.57 | 11d | 2 | 0.53mi |
| 600 Cranes Way #204 Altamonte Springs, FL | 2.0 | 2.5 | 1482 | $2,500 | $1.69 | 24d | 1 | 0.54mi |
| 940 Douglas Ave #185 Altamonte Springs, FL | 2.0 | 2.0 | 1199 | $1,600 | $1.33 | 5d | 1 | 0.62mi |
| 525 One Center Blvd Altamonte Springs, FL | 1.0–3.0 | 1.0–2.0 | 1082 | $2,568 | $2.37 | 2d | 17 | 0.63mi |
| 441 Homer Ave Longwood, FL | 4.0 | 2.0 | 1840 | $2,566 | $1.39 | 13d | 1 | 0.69mi |
| 505 One Center Blvd Altamonte Springs, FL | 3.0 | 1.0–2.0 | 963 | $3,242 | $3.37 | 2d | 39 | 0.71mi |
| 486 Centerpointe Cir Altamonte Springs, FL | 1.0–3.0 | 1.0–2.0 | 1037 | $2,765 | $2.67 | 3d | 15 | 0.73mi |
| 425 Centerpointe Cir Altamonte Springs, FL | 2.0 | 1.0–2.0 | 779 | $3,179 | $4.08 | 3d | 130 | 0.74mi |
| 375 Palm Springs Dr Altamonte Springs, FL | 3.0 | 1.0–2.0 | 828 | $1,808 | $2.18 | 2d | 19 | 0.94mi |
| 285 Uptown Blvd Altamonte Springs, FL | 1.0–3.0 | 1.0–2.0 | 1166 | $2,638 | $2.26 | 2d | 27 | 0.96mi |
| 599 Calibre Crest Pkwy Altamonte Springs, FL | 1.0–2.0 | 1.0–2.5 | 951 | $2,353 | $2.47 | 2d | 23 | 1.07mi |
| 163 Springwood Cir Unit A Longwood, FL | 2.0 | 2.0 | 1180 | $1,650 | $1.40 | 24d | 1 | 1.13mi |
| 172 Springwood Cir Unit 172 Longwood, FL | 2.0 | 2.0 | 1054 | $1,550 | $1.47 | 24d | 1 | 1.14mi |
| 517 Carambola Ave Altamonte Springs, FL | 3.0 | 2.5 | 1159 | $1,799 | $1.55 | 5d | 1 | 1.19mi |
| 2 Escondido Cir #185 Altamonte Springs, FL | 2.0 | 2.0 | 1339 | $1,600 | $1.19 | 5d | 1 | 1.21mi |
| 119 Tomoka Trl #119 Longwood, FL | 3.0 | 2.0 | 1590 | $2,800 | $1.76 | 18d | 1 | 1.24mi |
| 453 Hemlock St Altamonte Springs, FL | 3.0 | 2.5 | 1159 | $1,850 | $1.60 | 24d | 1 | 1.25mi |
| 256 Springside Rd Longwood, FL | 3.0 | 2.5 | 1536 | $2,300 | $1.50 | 24d | 1 | 1.26mi |
| 738 Preble Ave Altamonte Springs, FL | 3.0 | 2.0 | 1414 | $2,190 | $1.55 | 24d | 1 | 1.26mi |
| 524 Sun Valley Vlg #105 Altamonte Springs, FL | 2.0 | 2.0 | 1139 | $2,100 | $1.84 | 18d | 1 | 1.28mi |
| 505 Sun Ridge Pl Altamonte Springs, FL | 2.0 | 2.5 | 1124 | $1,900 | $1.69 | 24d | 1 | 1.29mi |
| 17 Escondido Cir #239 Altamonte Springs, FL | 3.0 | 2.0 | 1473 | $1,775 | $1.21 | 24d | 1 | 1.31mi |
| 534 Sun Valley Vlg Altamonte Springs, FL | 1.0–3.0 | 1.0–2.0 | 1117 | $2,134 | $1.91 | 3d | 9 | 1.32mi |
| 872 Fairview Ave Altamonte Springs, FL | 3.0 | 2.0 | 2115 | $2,579 | $1.22 | 22d | 1 | 1.32mi |
| 1580 Banks St Longwood, FL | 3.0 | 2.0 | 1675 | $2,445 | $1.46 | 24d | 1 | 1.36mi |
| 222 Crown Oaks Way Longwood, FL | 2.0 | 2.0 | 1143 | $1,750 | $1.53 | 24d | 1 | 1.36mi |
| 484 Tamarack St Altamonte Springs, FL | 2.0 | 2.5 | 1159 | $1,550 | $1.34 | 24d | 1 | 1.37mi |
| 550 Via del Oro Dr #106 Altamonte Springs, FL | 3.0 | 2.0 | 1595 | $2,190 | $1.37 | 24d | 1 | 1.38mi |
| 564 Breckenridge Vlg #106 Altamonte Springs, FL | 3.0 | 2.5 | 1332 | $1,950 | $1.46 | 11d | 1 | 1.43mi |
| 205 Fairway Dr Longwood, FL | 2.0 | 1.0 | 1141 | $1,795 | $1.57 | 13d | 1 | 1.44mi |
| 116 Fairway Dr Longwood, FL | 2.0 | 1.0 | 1200 | $1,900 | $1.58 | 24d | 1 | 1.45mi |
| 439 S Netherwood Cres Unit 439 Altamonte Springs, FL | 2.0 | 2.0 | 1121 | $2,000 | $1.78 | 18d | 1 | 1.46mi |
| 108 Fairway Dr #108 Longwood, FL | 2.0 | 2.0 | 1216 | $1,900 | $1.56 | 24d | 1 | 1.47mi |
| 270 Altamonte Bay Club Cir Altamonte Springs, FL | 1.0–2.0 | 1.0–2.0 | 1002 | $1,915 | $1.91 | 2d | 11 | 1.47mi |
Listing history 4 events
-
2026-06-01days on market $5,000 Active 6 DOM
-
2026-05-31days on market $5,000 Active 5 DOM
-
2026-05-26$5,000 Active
-
1973-01-01soldstatus $36,000
ⓘ Source: listings_history table (triggers on properties + properties_extension) + one-shot
backfill from property_details.listing_events for pre-trigger history.
Climate risk First Street
- Flood 1/10 Low FEMA zone X (unshaded) · 0% chance over 30 yrs
- Wildfire 1/10 Low
- Heat 8/10 Severe 7 d/yr ≥108°F today · 22 d/yr by 30 yrs out
- Wind 9/10 Extreme 99% chance of damaging wind over 30 yrs
- Air quality 2/10 Low 1 unhealthy d/yr today · 1 by 30 yrs out
Nearby sold comps map
Loading sold comps map…
Walkable amenities ~0.75 mi
Loading nearby amenities…
Taxation est. · year 1
- Rental income
- $25,032
- − Mortgage interest
- −$22,558
- − Property taxes
- −$6,041
- − Insurance
- −$2,014
- − Repairs & maintenance
- −$2,003
- − Management
- −$2,003
- − Depreciation
- −$11,715
- Taxable loss
- −$21,300
- Est. tax savings @ 24.0%
- +$5,112
- After-tax cash flow
- $-8,509/yr
For passive investors: Depreciation is non-cash, so a rental often shows a tax loss while cash-flowing — sheltering income. Rental losses are passive: they offset passive income freely, and up to $25,000/yr can offset ordinary (W-2) income if you actively participate and your MAGI is under $100k (phasing out to $0 by $150k); unused losses carry forward. On sale, claimed depreciation is recaptured at up to 25%, and gains may owe capital-gains tax (a 1031 exchange can defer both). Figures are a year-1 estimate at your 24.0% rate — not tax advice; consult a CPA.
Schools (NCES district)
- District
- Seminole
- NCES district ID
- 1201710
- Math proficiency
- 57% ▼ -7.00%
- Reading proficiency
- 61% ▼ -1.00%
- Median HH income
- $58,478
- Composite
- 51.05/100
- National rank
- #1769
- State rank
- #13 of 73 in FL
Livability — Altamonte Springs
- Score
- 82/100
- State rank
- #62
- US rank
- #1095
Category grades
Schools grade is shown separately in the Schools card above.
Census & demographics
- County
- Seminole County · 436,154 people
- City population
- 62,497
- Metro
- Orlando-Kissimmee-Sanford, FL
- Population (ZIP)
- 24,592
- Household income
- $62,198
- Rent vs Own
- Severe rent burden
- 1447.0
Population outlook (Seminole County) Hauer SSP2
- Today (2025)
- 515,494 people
- By 2030
- 545,713 · +5.9%
- By 2040
- 598,068 · +16.0%
- By 2050
- 640,663 · +24.3%
- By 2075
- 724,461 · +40.5%
- By 2100
- 755,530 · +46.6%
Race, ethnicity, and origin ACS 2023
- Neighborhood character
- Diverse neighborhood (Simpson 0.67)
- Race & ethnicity
- White 46% Hispanic / Latino 28% Black 19% Two or more races 18% Asian 3%
- Hispanic origin (detail)
- Puerto Rican 16% Cuban 3% Dominican 1%
- Common ancestry
- Lithuanian 2% Romanian 2% Slovak 1%
- Foreign-born
- 15% · Canada, Jamaica
- Languages at home
- 75% English-only · Spanish 19% Other Indo-European 2% Russian/Polish/Slavic 1%
Political lean MEDSL · Seminole
- 2024 margin
- Toss-up / Even · D 47.6% · R 51.1% · Other 1.3%
- 2008→2024 swing
- -0.8pp no change · 2008: -2.8pp · 2024: -3.5pp
- All cycles
- 2024: R+3.5 2020: D+2.8 2016: R+1.6 2012: R+6.5 2008: R+2.8
Not yet ingested
- Civics
- —
Market trends
- HPI YoY
- ▼ -169.27%
- Current HPI
- 323.2703
- Rent YoY
- ▼ -1.52%
- Metro
- Orlando-Kissimmee-Sanford, FL
- State GDP YoY
- ▲ 3.28%
- F500 in state
- 36
Industry mix (Fortune 500 HQ in FL)
| Industry | F500 HQs | Revenue |
|---|---|---|
| Industrial Technology | 2 | $29B |
|
||
| Insurance | 2 | $17B |
|
||
| Retail | 1 | $60B |
|
||
| Technology Distribution | 1 | $58B |
|
||
| Homebuilding | 1 | $35B |
|
||
| Technology Manufacturing | 1 | $35B |
|
||
Price history
-86.1% since first listed2 events — show timeline
- 2026-05-26 Listed $5,000 NFMLS
- 1973-01-01 Sold (Public Records) $36,000 Public Records
Property tax history
+12.5%/yrLatest (2025): $3,875 · +177.5% YoY. Source: county tax records.
Cash-flow waterfall
monthlySold comps — $/sqft
last 12 mo · ≤1 miLoading sold comps…