 25-Plex
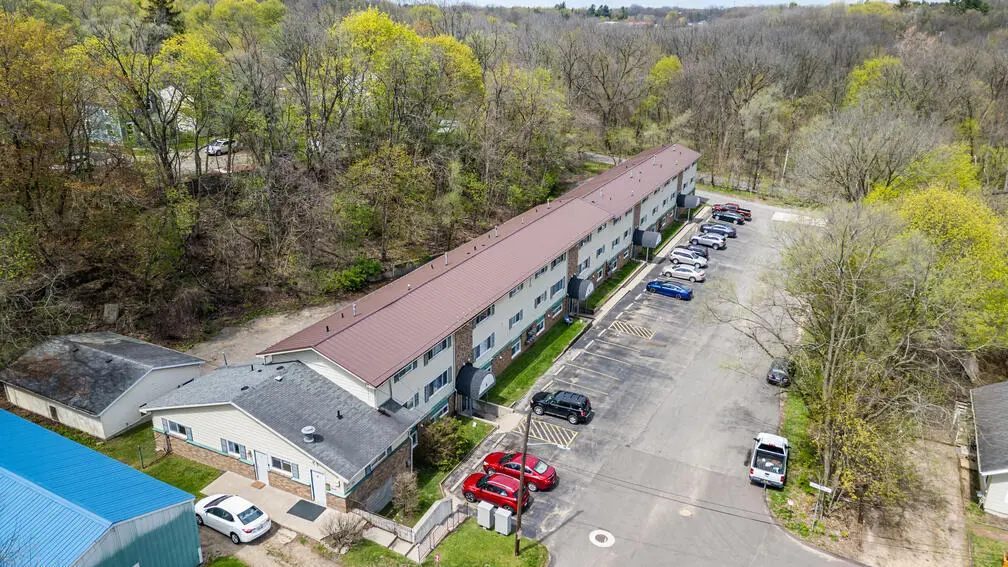
525 N Arlington St · Kalamazoo, MI
Flood risk 1/10 · Minimal
- FEMA flood zone
- X
- Chance of flooding over 30 yrs
- 0.0%
- Est. flood insurance / yr
- $435 – $905
Fire risk 1/10 · Minimal
- Est. fire insurance / yr
- $784 – $1,456
Heat risk 2/10 · Minimal
- Hot days now (above threshold)
- 7 days/yr
- Hot days in 30 yrs
- 16 days/yr
Wind risk No data
- Chance of severe wind over 30 yrs
- —
Air-quality risk 2/10 · Minimal
- Unhealthy air days now
- 1 days/yr
- Unhealthy air days in 30 yrs
- 2 days/yr
Risk factors via First Street. Map © Google.
Why this score? — see what drove the B+ grade
The composite is a weighted blend of 9 inputs, each scored 0–100. Each bar is that input's sub-score; the figure is the points it added to the 100-point composite (weight × sub-score).
- Cash flow +30.0/30.0
- DSCR +10.0/10.0
- 1% rule +9.0/10.0
- ARV discount +7.5/15.0
- Appreciation +5.0/10.0
- Schools +4.7/10.0
- Livability +3.8/5.0
- Rent growth +2.5/5.0
- Condition / age +2.5/5.0
$1,850,000
🖨 Deal sheet (PDF) 📄 Offer letter ✓ Due diligence
Multi-family units
County records classify this as Multi-Family (5+ Unit). Listing-text estimate: 25 units. confirmed
5+ unit building — per-unit beds/baths from public records are typically unavailable; the breakdown below (if shown) is an estimate from the listing text.
Listing remarks MLS
Welcome to Arlington off Main! This 25 unit apartment community is unlike anything else in the market. With immediate cash flow available, improved unit fit and finish, and updated capital elements, this investment is primed for any investor that seeks stabilized cash flow day one! Rents are under market comparable to like kind communities giving the future owner the opportunity for income upside! Geographically positioned by the new Arena project in Downtown, Kalamazoo College, and Western Michigan University, the subject property will be relevant for years to come!
Key facts
- Income upside
- 1.57 acre lot
- Built 1972
Tags
Property features AI
Exterior
- Utilities: Natural gas; Forced air heating
- Home design: Multi-family property; Built in 1972; Approximately 1.57-acre lot; Frontage: 1
- Construction: Brick and vinyl siding construction; Built in 1972
- Exterior features: Brick and vinyl siding exterior; Paved street frontage; City/County roads
Interior
- Heating & cooling: Forced air heating; Natural gas fuel
- Interior features: Basement: Other; Total of 25 units in the building
Neighborhood map
What this means for you Summary
Snapshot
- This is a 25 × 1-bed/1-bath units multifamily listed at $1.85M.
Deal economics
- At list price, monthly cash flow is $8k ($93k/yr) — positive. Per door: $310/mo.
- The deal already cash-flows at list — no discount required.
- Meets the 1% rule at list price ($26k rent vs $1.85M).
- Recommended offer: $1.79M (3.0% below list) — sets the bar for market timing.
- Cap rate 11.3% vs local median 4.1% in Kalamazoo — top-decile yield for the area; either an underpriced asset or a hidden risk that comps aren't pricing in. Stress-test before assuming the spread holds.
Location & tenants
- Location reads 76/100 on livability (#141 in MI, #3,492 nationally) — a middle-class / working-renter tenant base. Strengths: commute A+, cost of living A+, housing A+; Watch: crime F, employment D-.
- Kalamazoo Public Schools (urban): math 43% / reading 72% proficiency, ranked #71 of 540 in MI (top 13%) — acceptable for families but not a draw, mixed tenant base, ~2y average lease; 66% free/reduced lunch — lower-income household profile, screen leases tightly.
- Market conditions: 1 active listings in the ZIP; 339 units permitted in Kalamazoo County in 2024 (22 in 5+ unit buildings).
Forward outlook
- In year one you build about $68k of equity ($13k loan paydown + $56k appreciation (3.0% local appreciation)).
- Kalamazoo County population projected at +18% by 2050 — long-run rental-demand tailwind backs the buy-and-hold thesis.
- At projected returns (3.0% appreciation + 3.0% rent growth), your $518k cash investment doubles in ~4 years — after that, you're playing with house money.
- By year 2, paydown + projected appreciation supports a ~$111k cash-out refi (75% LTV) — recoverable capital for the next deal without selling this one.
Negotiation context
- It's been on market 37 days — a 3% lower offer ($1.79M) is reasonable based on typical stale-listing flexibility.
- 8 sale attempts since 30y ago with the ask held roughly flat each time — persistent listings suggest the price (not the market) is what's stuck; bring a comps-based counter.
- Current owner paid $400k; list at $1.85M implies a 362% gain — meaningful room to come down on a strong offer.
Questions for the listing agent
- It's been on market 37 days. Have you received any prior offers? Is the seller open to a 3% concession, seller financing, or rate buy-down credit?
- Can we see the unit-by-unit rent roll, current vacancy, and any below-market leases? What's the average tenancy length?
- What capital expenditures (roof, boiler, parking lot, exteriors) have been made in the last 5 years, and what's planned in the next 2?
- Built in 1972 — when were the roof, HVAC, electrical panel, plumbing, and water heater last replaced?
- Is there a deadline driving the sale (1031 exchange, divorce, estate, relocation)? That informs how much negotiation room exists.
- Crime grade is F in this area — have there been break-ins, vandalism, or insurance claims at this property in the last 3 years? What carrier currently insures it and at what premium?
- What's the average days-on-market for RENTAL listings here right now (not sales)? A rising rental-DOM trend means longer vacancies and softer asking-rent achievability than the comps imply.
- What's the recent tenant-quality profile in this submarket — average credit score on applications, eviction rate, late-payment / NSF rate, and stable-employment percentage? A property-management company in the area should have these aggregated.
- How much new apartment / multifamily construction is in the pipeline within 1–3 miles? Heavy new supply (>2% of stock underway) typically softens rents 12–24 months out; light construction supports rent growth.
Investment metrics
- 1% rule
- 1.40% ✓
- Cap rate
- 11.32%
- Cash-on-cash
- 17.94%
- DSCR
- 1.80
- GRM
- 5.9
CMA / ARV
No comps found within radius.
Projected returns pro-forma
3.0% appreciation · 3.0% rent growth · sell at horizon
- IRR
- 24.4%
- Equity multiple
- 2.38×
- Total profit
- $716,572
- Equity at exit
- $831,840
- IRR
- 25.2%
- Equity multiple
- 4.59×
- Total profit
- $1,860,386
- Equity at exit
- $1,281,965
Cash invested: $518,000 (down + closing). Projections, not guarantees.
Landlord ↔ Tenant lean methodology
- Overall (STATE)
- 62 Landlord-Friendly
- State Michigan
- 62 Landlord-Friendly · EVEN
- County
- — inherits STATE
- City
- — inherits STATE
ZIP-level market 49006-3173
- Active inventory
- 1
- Price-to-rent
- 148.3×
Monthly cashflow live
- Estimated rent
- $25,988 high interval (Pro) →
- Mortgage (P&I)
- −$9,702
- Tax est. 1.5%
- −$2,312 /mo · $27,750/yr
- Insurance
- −$771
- HOA
- −$0
- Vacancy / Maint / Mgmt
- −$5,457
- Net cashflow
- $7,746
Break-even live
Sensitivity live
| Price | -10% $9,024 | -5% $8,385 | +0% $7,746 | +5% $7,106 | +10% $6,467 |
|---|---|---|---|---|---|
| Rent | -10% $5,693 | -5% $6,719 | +0% $7,746 | +5% $8,772 | +10% $9,799 |
| Rate | -1.0pp $8,677 | -0.5pp $8,216 | base $7,746 | +0.5pp $7,266 | +1.0pp $6,779 |
25-unit breakdown (identical units grouped — click to expand)
| Units | Beds | Baths | Est. rent |
|---|---|---|---|
| 25× units | 1 | 1 | $26,000 |
| #1 | 1 | 1 | $1,040 |
| #2 | 1 | 1 | $1,040 |
| #3 | 1 | 1 | $1,040 |
| #4 | 1 | 1 | $1,040 |
| #5 | 1 | 1 | $1,040 |
| #6 | 1 | 1 | $1,040 |
| #7 | 1 | 1 | $1,040 |
| #8 | 1 | 1 | $1,040 |
| #9 | 1 | 1 | $1,040 |
| #10 | 1 | 1 | $1,040 |
| #11 | 1 | 1 | $1,040 |
| #12 | 1 | 1 | $1,040 |
| #13 | 1 | 1 | $1,040 |
| #14 | 1 | 1 | $1,040 |
| #15 | 1 | 1 | $1,040 |
| #16 | 1 | 1 | $1,040 |
| #17 | 1 | 1 | $1,040 |
| #18 | 1 | 1 | $1,040 |
| #19 | 1 | 1 | $1,040 |
| #20 | 1 | 1 | $1,040 |
| #21 | 1 | 1 | $1,040 |
| #22 | 1 | 1 | $1,040 |
| #23 | 1 | 1 | $1,040 |
| #24 | 1 | 1 | $1,040 |
| #25 | 1 | 1 | $1,040 |
| Total (25 units) | $25,988 | ||
UW: 25.0% down · 7.5% · 30yr · 1.5% tax · 5.0% vac · 8.0% maint · 8.0% mgmt
Financing live
Cash to close
- Down payment
- $462,500
- Closing costs
- $55,500
- Reserves months
- —
- Total cash needed
- —
Loan-product check · same deal, 3 products live
Conventional
25% down · 7.5% · 30yr
- Down + closing
- —
- Monthly P&I
- —
- Monthly cashflow
- —
- DSCR
- —
- Eligible?
- —
Personal DTI + credit; lowest rate.
DSCR
20% down · 8.5% · 30yr
- Down + closing
- —
- Monthly P&I
- —
- Monthly cashflow
- —
- DSCR
- —
- Eligible?
- —
No personal income docs; deal must DSCR.
Hard money
10% down · 12.0% · 12mo
- Down + closing
- —
- Monthly P&I
- —
- Monthly cashflow
- —
- DSCR
- —
- Eligible?
- —
Short-term bridge; refi at stabilization.
Listing history 30 events
-
2026-06-18days on market $1,850,000 Active 37 DOM
-
2026-06-17days on market $1,850,000 Active 36 DOM
-
2026-06-16days on market $1,850,000 Active 35 DOM
-
2026-06-15days on market $1,850,000 Active 34 DOM
-
2026-06-14days on market $1,850,000 Active 32 DOM
-
2026-06-13days on market $1,850,000 Active 31 DOM
-
2026-06-10days on market $1,850,000 Active 29 DOM
-
2026-06-09days on market $1,850,000 Active 28 DOM
-
2026-06-08days on market $1,850,000 Active 27 DOM
-
2026-06-07days on market $1,850,000 Active 26 DOM
-
2026-06-05days on market $1,850,000 Active 23 DOM
-
2026-06-03days on market $1,850,000 Active 22 DOM
-
2026-06-02days on market $1,850,000 Active 21 DOM
-
2026-06-01days on market $1,850,000 Active 20 DOM
-
2026-05-31days on market $1,850,000 Active 19 DOM
-
2026-05-30days on market $1,850,000 Active 18 DOM
-
2026-05-12$1,850,000 Active
Show marketing remark (573 chars)
Welcome to Arlington off Main! This 25 unit apartment community is unlike anything else in the market. With immediate cash flow available, improved unit fit and finish, and updated capital elements, this investment is primed for any investor that seeks stabilized cash flow day one! Rents are under market comparable to like kind communities giving the future owner the opportunity for income upside! Geographically positioned by the new Arena project in Downtown, Kalamazoo College, and Western Michigan University, the subject property will be relevant for years to come!
-
2026-05-12$1,850,000 Active 573-char remark
Show marketing remark (573 chars)
Welcome to Arlington off Main! This 25 unit apartment community is unlike anything else in the market. With immediate cash flow available, improved unit fit and finish, and updated capital elements, this investment is primed for any investor that seeks stabilized cash flow day one! Rents are under market comparable to like kind communities giving the future owner the opportunity for income upside! Geographically positioned by the new Arena project in Downtown, Kalamazoo College, and Western Michigan University, the subject property will be relevant for years to come!
-
2015-01-16historical
-
2014-12-24historical
-
2014-09-15historical
-
2012-05-31soldstatus $400,000
-
2012-05-31soldstatus $400,000
-
2012-03-01$425,000
-
2012-03-01$425,000
-
2012-01-18$425,000
-
2011-11-05$449,999
-
2011-07-14$475,000
-
1996-08-30historical
-
1996-08-23$1
ⓘ Source: listings_history table (triggers on properties + properties_extension) + one-shot
backfill from property_details.listing_events for pre-trigger history.
Climate risk First Street
- Flood 1/10 Low FEMA zone X · 0% chance over 30 yrs
- Wildfire 1/10 Low
- Heat 2/10 Low
- Air quality 2/10 Low 1 unhealthy d/yr today · 2 by 30 yrs out
Nearby sold comps map
Loading sold comps map…
Walkable amenities ~0.75 mi
Loading nearby amenities…
Taxation est. · year 1
- Rental income
- $311,856
- − Mortgage interest
- −$103,629
- − Property taxes
- −$27,750
- − Insurance
- −$9,250
- − Repairs & maintenance
- −$24,948
- − Management
- −$24,948
- − Depreciation
- −$53,818
- Taxable income
- $67,512
- Est. tax owed @ 24.0%
- −$16,203
- After-tax cash flow
- $76,744/yr
For passive investors: Depreciation is non-cash, so a rental often shows a tax loss while cash-flowing — sheltering income. Rental losses are passive: they offset passive income freely, and up to $25,000/yr can offset ordinary (W-2) income if you actively participate and your MAGI is under $100k (phasing out to $0 by $150k); unused losses carry forward. On sale, claimed depreciation is recaptured at up to 25%, and gains may owe capital-gains tax (a 1031 exchange can defer both). Figures are a year-1 estimate at your 24.0% rate — not tax advice; consult a CPA.
Schools (NCES district)
- District
- Kalamazoo Public Schools
- NCES district ID
- 2619950
- Math proficiency
- 43% ▲ 13.00%
- Reading proficiency
- 72% ▲ 33.00%
- Median HH income
- $35,291
- Composite
- 47.48/100
- National rank
- #2275
- State rank
- #71 of 540 in MI
Livability — Kalamazoo
- Score
- 76/100
- State rank
- #141
- US rank
- #3492
Category grades
Schools grade is shown separately in the Schools card above.
Census & demographics
- Census place
- Westwood, MI
Population outlook (Kalamazoo County) Hauer SSP2
- Today (2025)
- 280,982 people
- By 2030
- 292,068 · +3.9%
- By 2040
- 312,191 · +11.1%
- By 2050
- 331,196 · +17.9%
- By 2075
- 379,021 · +34.9%
- By 2100
- 396,579 · +41.1%
Not yet ingested
- Political lean
- —
- Race & ethnicity
- —
- Common origin
- —
- Civics
- —
Market trends
- HPI YoY
- —
- Current HPI
- —
- Rent YoY
- —
- Metro
- —
- State GDP YoY
- ▲ 1.37%
- F500 in state
- 28
Industry mix (Fortune 500 HQ in MI)
| Industry | F500 HQs | Revenue |
|---|---|---|
| Automotive Parts | 3 | $48B |
|
||
| Automotive | 2 | $372B |
|
||
| Chemicals | 1 | $45B |
|
||
| Automotive Retail | 1 | $29B |
|
||
| Healthcare / Medical Devices | 1 | $23B |
|
||
| Automotive Technology | 1 | $20B |
|
||
Price history
+289.5% since first listed14 events — show timeline
- 2026-05-12 Listed $1,850,000 REALCOMP
- 2026-05-12 Listed $1,850,000 MiRealSource-MiMLS
- 2015-01-16 Listing Removed — SW Michigan MLS
- 2014-12-24 Listing Removed — SW Michigan MLS
- 2014-09-15 Listing Removed — SW Michigan MLS
- 2012-05-31 Sold (MLS) $400,000 REALCOMP
- 2012-05-31 Sold (MLS) $400,000 SW Michigan MLS
- 2012-03-01 Listed $425,000 REALCOMP
- 2012-03-01 Listed $425,000 SW Michigan MLS
- 2012-01-18 Listed $425,000 SW Michigan MLS
- 2011-11-05 Listed $449,999 SW Michigan MLS
- 2011-07-14 Listed $475,000 SW Michigan MLS
- 1996-08-30 Listing Removed — SW Michigan MLS
- 1996-08-23 Listed $1 SW Michigan MLS
Cash-flow waterfall
monthlySold comps — $/sqft
last 12 mo · ≤1 miLoading sold comps…