 Multi-family
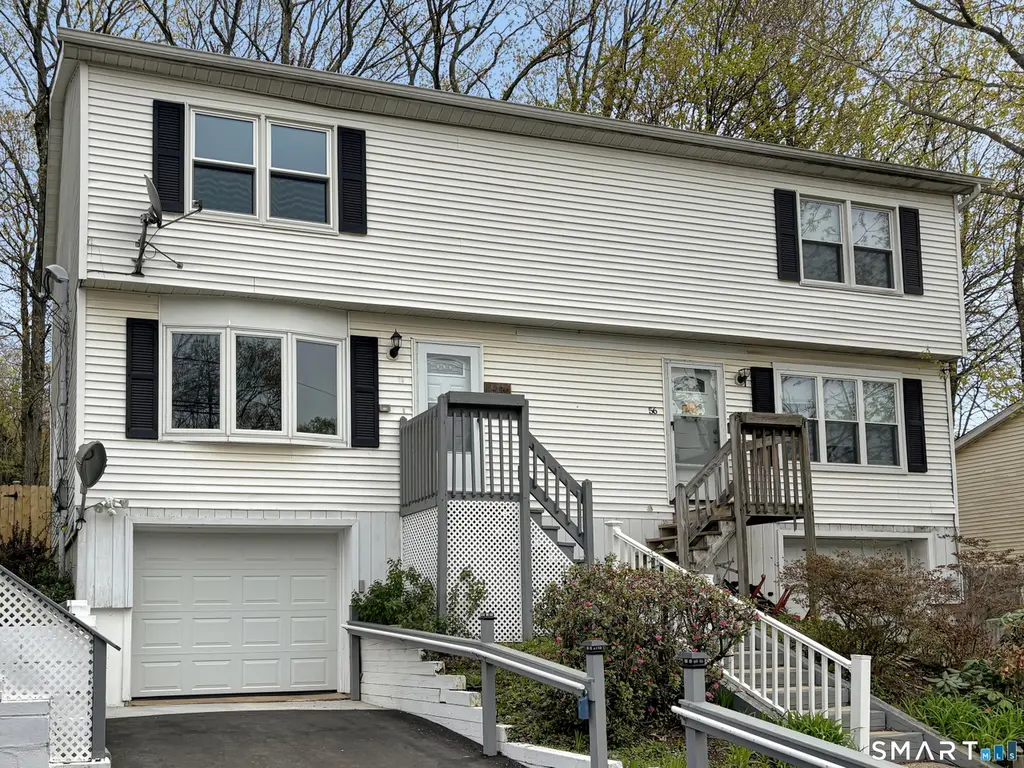
58 Doman Dr · Torrington, CT
Flood risk No data
- FEMA flood zone
- —
- Chance of flooding over 30 yrs
- —
- Est. flood insurance / yr
- —
Fire risk No data
- Est. fire insurance / yr
- —
Heat risk No data
- Hot days now (above threshold)
- —
- Hot days in 30 yrs
- —
Wind risk No data
- Chance of severe wind over 30 yrs
- —
Air-quality risk No data
- Unhealthy air days now
- —
- Unhealthy air days in 30 yrs
- —
Risk factors via First Street. Map © Google.
Why this score? — see what drove the C+ grade
The composite is a weighted blend of 9 inputs, each scored 0–100. Each bar is that input's sub-score; the figure is the points it added to the 100-point composite (weight × sub-score).
- Cash flow +25.2/30.0
- ARV discount +10.1/15.0
- DSCR +8.3/10.0
- 1% rule +6.2/10.0
- Rent growth +4.0/5.0
- Livability +3.8/5.0
- Schools +2.7/10.0
- Condition / age +2.5/5.0
- Appreciation +0.0/10.0
$252,900
🖨 Deal sheet 📄 Offer letter ✓ Due diligence
Multi-family units
County records classify this as Multi-Family (2-4 Unit). Listing-text estimate: 1 unit. estimate disagrees with records
Listing remarks MLS
Seller offereng 5% owner financing - why rent when you can own this home. Neighborhood setting, completely fenced in yard!
Key facts
- Quartz countertops
- Brand new kitchen
- Fresh interior paint
Tags
Property features AI
Exterior
- Parking: Attached garage under the house (1-car)
- Utilities: Public water connected; Public sewer connected; Electric service
- Home design: Single-family home
- Construction: Frame construction; Concrete foundation
- Exterior features: Lightly wooded, sloping lot; Vinyl siding; Asphalt shingle roof
Interior
- Kitchen: Oven/Range; Range hood; Refrigerator; Dishwasher
- Bedrooms: 2 bedrooms
- Bathrooms: 1 full bathroom
- Heating & cooling: Hot water heating (electric); Thermopane windows (energy efficient)
- Interior features: Partial basement; Has attic with access via hatch; Total of 4 rooms
- Laundry & utility: Laundry in lower level/basement; 30-gallon electric hot water tank
Neighborhood map
What this means for you Summary
Snapshot
- This is a 2-bed/1.0-bath multifamily listed at $253k.
Deal economics
- At list price, monthly cash flow is $569 ($7k/yr) — positive.
- The deal already cash-flows at list — no discount required.
- Meets the 1% rule at list price ($3k rent vs $253k).
- Recommended offer: $245k (3.0% below list) — sets the bar for market timing.
- Cap rate 9.0% vs local median 3.9% in Torrington — top-decile yield for the area; either an underpriced asset or a hidden risk that comps aren't pricing in. Stress-test before assuming the spread holds.
Location & tenants
- Location reads 76/100 on livability (#53 in CT, #3,449 nationally) — a middle-class / working-renter tenant base. Strengths: crime A+, cost of living A+, housing A+; Watch: schools D, commute F.
- Torrington School District (town): math 22% / reading 39% proficiency, ranked #125 of 153 in CT (top 82%) — families likely to look elsewhere, expect single-tenant / working-renter base with shorter leases.
- Market conditions: Rents rising fast (+5.9%/yr); 188 active listings in the ZIP; 16 comparable units currently listed for rent nearby; rentals lingering (median 44d on market — plan ~5-8 weeks vacancy on turnover, expect pricing pressure); 88% of comp listings sitting > 30 days — soft ceiling on asking rent; 154 units permitted in Northwest Hills Planning Region in 2024 (6 in 5+ unit buildings).
- At $2,842/mo this rent would consume 48% of the median local household income ($71k/yr) (locally 1401% of renters already pay >50% of income on rent) — very limited rent-growth headroom before tenants either downsize or default.
Forward outlook
- Local home prices are declining (-3.0%/yr); year-one equity from $2k of loan paydown is wiped out by about $8k of value loss. Plan a longer hold.
- At projected returns (-3.0% appreciation + 5.9% rent growth), your $71k cash investment doubles in ~9 years — after that, you're playing with house money.
Negotiation context
- It's been on market 41 days — a 3% lower offer ($245k) is reasonable based on typical stale-listing flexibility.
- 3 sale attempts since 19y ago with the ask held roughly flat each time — persistent listings suggest the price (not the market) is what's stuck; bring a comps-based counter.
- Current owner paid $95k; list at $253k implies a 166% gain — meaningful room to come down on a strong offer.
Questions for the listing agent
- It's been on market 41 days. Have you received any prior offers? Is the seller open to a 3% concession, seller financing, or rate buy-down credit?
- Is there a deadline driving the sale (1031 exchange, divorce, estate, relocation)? That informs how much negotiation room exists.
- Schools are D-rated, which usually means shorter tenancies and higher turnover. Who's the typical renter profile here, and what's been the actual vacancy rate?
- What's the average days-on-market for RENTAL listings here right now (not sales)? A rising rental-DOM trend means longer vacancies and softer asking-rent achievability than the comps imply.
- What's the recent tenant-quality profile in this submarket — average credit score on applications, eviction rate, late-payment / NSF rate, and stable-employment percentage? A property-management company in the area should have these aggregated.
- How much new apartment / multifamily construction is in the pipeline within 1–3 miles? Heavy new supply (>2% of stock underway) typically softens rents 12–24 months out; light construction supports rent growth.
Investment metrics
- 1% rule
- 1.12% ✓
- Cap rate
- 8.99%
- Cash-on-cash
- 9.65%
- DSCR
- 1.43
- GRM
- 7.4
CMA / ARV
- ARV (median comp)
- $268,492
- List price
- $252,900
- Delta
- -5.81%
- Verdict
- FAIR
- Comps
- 20 within 1.0 mi
Projected returns pro-forma
-3.0% appreciation · 5.89% rent growth · sell at horizon
- IRR
- 1.4%
- Equity multiple
- 1.05×
- Total profit
- $3,770
- Equity at exit
- $37,708
- IRR
- 13.6%
- Equity multiple
- 2.23×
- Total profit
- $86,980
- Equity at exit
- $21,866
Cash invested: $70,812 (down + closing). Projections, not guarantees.
Landlord ↔ Tenant lean methodology
- Overall (STATE)
- 27 Tenant-Leaning
- State Connecticut
- 27 Tenant-Leaning · D+7
- County
- — inherits STATE
- City
- — inherits STATE
ZIP-level market 06790
- Rents YoY
- 5.9%
- Active inventory
- 188
- Price-to-rent
- 14.8×
Monthly cashflow live
- Estimated rent
- $2,842 medium interval (Pro) →
- Mortgage (P&I)
- −$1,326
- Tax from tax record
- −$244 /mo · $2,933/yr
- Insurance
- −$105
- HOA
- −$0
- Vacancy / Maint / Mgmt
- −$597
- Net cashflow
- $569
Break-even live
2-unit breakdown (identical units grouped — click to expand)
| Units | Beds | Baths | Est. rent |
|---|---|---|---|
| 2× units | 2 | 1.5 | $2,842 |
| #1 | 2 | 1.5 | $1,421 |
| #2 | 2 | 1.5 | $1,421 |
| Total (2 units) | $2,842 | ||
UW: 25.0% down · 7.5% · 30yr · 1.5% tax · 5.0% vac · 8.0% maint · 8.0% mgmt
Financing live
Cash to close
- Down payment
- $63,225
- Closing costs
- $7,587
- Reserves months
- —
- Total cash needed
- —
Loan-product check · same deal, 3 products live
Conventional
25% down · 7.5% · 30yr
- Down + closing
- —
- Monthly P&I
- —
- Monthly cashflow
- —
- DSCR
- —
- Eligible?
- —
Personal DTI + credit; lowest rate.
DSCR
20% down · 8.5% · 30yr
- Down + closing
- —
- Monthly P&I
- —
- Monthly cashflow
- —
- DSCR
- —
- Eligible?
- —
No personal income docs; deal must DSCR.
Hard money
10% down · 12.0% · 12mo
- Down + closing
- —
- Monthly P&I
- —
- Monthly cashflow
- —
- DSCR
- —
- Eligible?
- —
Short-term bridge; refi at stabilization.
Rent comps 16 comps
| Address | Beds | Baths | Sqft | Rent | $/sqft | DOM | Units | Dist |
|---|---|---|---|---|---|---|---|---|
| 158 Daley Dr Torrington, CT | 2.0 | 1.5 | 1100 | $1,650 | $1.50 | 44d | 1 | 0.17mi |
| 19 Wadhams Ave Torrington, CT | 2.0 | 1.5 | 1112 | $1,895 | $1.70 | 44d | 1 | 0.68mi |
| 340 Brightwood Ave Unit 2 Torrington, CT | 3.0 | 1.0 | 1080 | $1,900 | $1.76 | 44d | 1 | 0.70mi |
| 785 Main St Torrington, CT | 2.0 | 1.0 | 1000 | $1,500 | $1.50 | 44d | 1 | 0.77mi |
| 696 Main St Unit 2 Torrington, CT | 2.0 | 1.0 | 1117 | $1,350 | $1.21 | 44d | 1 | 0.81mi |
| 5 Winthrop St Torrington, CT | 3.0 | 1.5 | 1072 | $2,350 | $2.19 | 44d | 1 | 0.92mi |
| 93 E Elm St Unit U2 Torrington, CT | 3.0 | 1.0 | 1100 | $1,550 | $1.41 | 44d | 1 | 0.93mi |
| 243 E Elm St Unit 3 Torrington, CT | 3.0 | 1.0 | 1000 | $1,800 | $1.80 | 44d | 1 | 1.01mi |
| 54 Forest St Unit 2 Torrington, CT | 3.0 | 1.0 | 1000 | $1,800 | $1.80 | 44d | 1 | 1.18mi |
| 125 Wall St Unit 2 Torrington, CT | 2.0 | 1.0 | 800 | $1,650 | $2.06 | 44d | 1 | 1.24mi |
| 58 Pulaski St Unit 3 Torrington, CT | 3.0 | 1.0 | 980 | $1,550 | $1.58 | 44d | 1 | 1.25mi |
| 375 N Elm St Unit 2 Torrington, CT | 2.0 | 1.0 | 1100 | $1,700 | $1.55 | 44d | 1 | 1.33mi |
| 261 Hillside Ave Unit 2 Torrington, CT | 2.0 | 1.0 | 1344 | $1,300 | $0.97 | 23d | 1 | 1.40mi |
| 148 Edgewood Dr Torrington, CT | 3.0 | 1.0 | 1000 | $2,500 | $2.50 | 23d | 1 | 1.44mi |
| 42 Pulver St Torrington, CT | 3.0 | 1.0 | 1443 | $1,800 | $1.25 | 44d | 1 | 1.48mi |
| 199 Migeon Ave Unit 2 Torrington, CT | 3.0 | 1.0 | 1500 | $2,350 | $1.57 | 44d | 1 | 1.48mi |
Listing history 26 events
-
2026-06-19days on market $252,900 Active 41 DOM
-
2026-06-18days on market $252,900 Active 40 DOM
-
2026-06-17days on market $252,900 Active 39 DOM
-
2026-06-16days on market $252,900 Active 38 DOM
-
2026-06-15days on market $252,900 Active 37 DOM
-
2026-06-14days on market $252,900 Active 35 DOM
-
2026-06-13days on market $252,900 Active 34 DOM
-
2026-06-10days on market $252,900 Active 32 DOM
-
2026-06-09days on market $252,900 Active 31 DOM
-
2026-06-08days on market $252,900 Active 30 DOM
-
2026-06-07days on market $252,900 Active 29 DOM
-
2026-06-05days on market $252,900 Active 26 DOM
-
2026-06-03days on market $252,900 Active 25 DOM
-
2026-06-02days on market $252,900 Active 24 DOM
-
2026-06-01days on market $252,900 Active 23 DOM
-
2026-05-31days on market $252,900 Active 22 DOM
-
2026-05-30days on market $252,900 Active 21 DOM
-
2026-05-09$252,900 Active 1407-char remark
-
2026-01-31historical
-
2025-10-13price $229,900
-
2025-09-09price $239,900
-
2025-07-30$249,900 Active
-
2007-07-02soldstatus $95,000
Show marketing remark (122 chars)
Seller offereng 5% owner financing - why rent when you can own this home. Neighborhood setting, completely fenced in yard!
-
2007-07-02soldstatus $95,000
Show marketing remark (122 chars)
Seller offereng 5% owner financing - why rent when you can own this home. Neighborhood setting, completely fenced in yard!
-
2007-03-14$118,000
Show marketing remark (122 chars)
Seller offereng 5% owner financing - why rent when you can own this home. Neighborhood setting, completely fenced in yard!
-
2006-02-15soldstatus $69,000
ⓘ Source: listings_history table (triggers on properties + properties_extension) + one-shot
backfill from property_details.listing_events for pre-trigger history.
Tax reassessment forecast CT · Partial reset (capped growth)
- Current annual tax
- $2,933 · $244/mo
- Projected year-2 tax
- $4,173 · $348/mo
- Expected delta
- +$1,240/yr (+$103/mo · 42.3%)
ⓘ Screening estimate from a state-policy table — verify with the county assessor before closing.
Nearby sold comps map
Loading sold comps map…
Walkable amenities ~0.75 mi
Loading nearby amenities…
Taxation est. · year 1
- Rental income
- $34,104
- − Mortgage interest
- −$14,166
- − Property taxes
- −$2,933
- − Insurance
- −$1,264
- − Repairs & maintenance
- −$2,728
- − Management
- −$2,728
- − Depreciation
- −$7,357
- Taxable income
- $2,926
- Est. tax owed @ 24.0%
- −$702
- After-tax cash flow
- $6,127/yr
For passive investors: Depreciation is non-cash, so a rental often shows a tax loss while cash-flowing — sheltering income. Rental losses are passive: they offset passive income freely, and up to $25,000/yr can offset ordinary (W-2) income if you actively participate and your MAGI is under $100k (phasing out to $0 by $150k); unused losses carry forward. On sale, claimed depreciation is recaptured at up to 25%, and gains may owe capital-gains tax (a 1031 exchange can defer both). Figures are a year-1 estimate at your 24.0% rate — not tax advice; consult a CPA.
Schools (NCES district)
- District
- Torrington School District
- NCES district ID
- 0904590
- Math proficiency
- 22% ▼ -8.00%
- Reading proficiency
- 39% ▼ -6.00%
- Median HH income
- $53,647
- Composite
- 26.9/100
- National rank
- #7087
- State rank
- #125 of 153 in CT
Livability — Torrington
- Score
- 76/100
- State rank
- #53
- US rank
- #3449
Category grades
Schools grade is shown separately in the Schools card above.
Census & demographics
- Census place
- Torrington, CT
- County
- Litchfield County · 81,203 people
- City population
- 35,566
- Metro
- Torrington, CT
- Population (ZIP)
- 35,566
- Household income
- $70,912
- Rent vs Own
- Severe rent burden
- 1401.0
Population outlook (Northwest Hills County) Hauer SSP2
- By 2040
- 118,998
Race, ethnicity, and origin ACS 2023
- Neighborhood character
- Predominantly White (73%)
- Race & ethnicity
- White 73% Hispanic / Latino 14% Two or more races 8% Black 6% Asian 3%
- Hispanic origin (detail)
- Puerto Rican 5% Dominican 2%
- Common ancestry
- Romanian 8% Lithuanian 5% Slovak 2%
- Foreign-born
- 12% · Canada, South Korea, Jamaica
- Languages at home
- 86% English-only · Spanish 8% Other Indo-European 2% Russian/Polish/Slavic 1%
Political lean MEDSL · Northwest Hills
- 2024 margin
- Toss-up / Even · D 48.6% · R 49.9% · Other 1.6%
- All cycles
- 2024: R+1.3
Not yet ingested
- Civics
- —
Market trends
- HPI YoY
- ▼ -122.78%
- Current HPI
- 208.4818
- Rent YoY
- ▲ 5.89%
- Metro
- Torrington, CT
- State GDP YoY
- ▲ 1.06%
- F500 in state
- 38
Industry mix (Fortune 500 HQ in CT)
| Industry | F500 HQs | Revenue |
|---|---|---|
| Industrial Machinery | 4 | $38B |
|
||
| Insurance | 3 | $71B |
|
||
| Financial Services | 2 | $25B |
|
||
| Transportation / Logistics | 2 | $18B |
|
||
| Healthcare | 1 | $247B |
|
||
| Telecommunications | 1 | $55B |
|
||
Price history
+266.5% since first listed9 events — show timeline
- 2026-05-09 Listed $252,900 Smart MLS
- 2026-01-31 Listing Removed — Smart MLS
- 2025-10-13 Price Changed $229,900 Smart MLS
- 2025-09-09 Price Changed $239,900 Smart MLS
- 2025-07-30 Listed $249,900 Smart MLS
- 2007-07-02 Sold (Public Records) $95,000 Public Records
- 2007-07-02 Sold (MLS) $95,000 Smart MLS
- 2007-03-14 Listed $118,000 Smart MLS
- 2006-02-15 Sold (Public Records) $69,000 Public Records
Property tax history
+1.0%/yrLatest (2023): $2,933 · +1.7% YoY. Source: county tax records.
Cash-flow waterfall
monthlySold comps — $/sqft
last 12 mo · ≤1 miLoading sold comps…