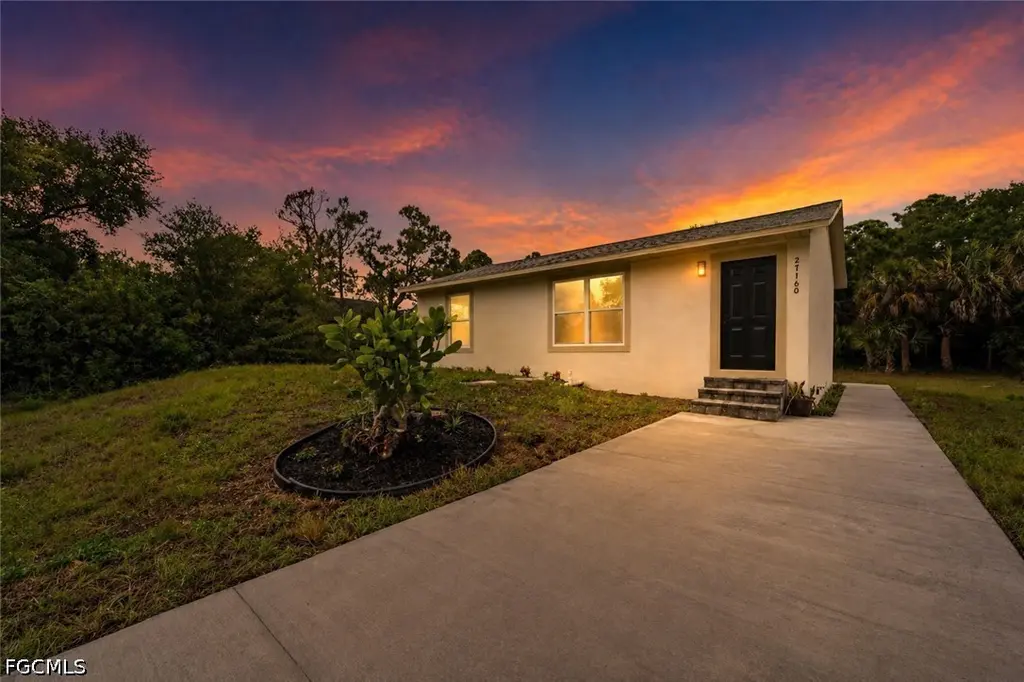
27160 Chula Vista Dr · Punta Gorda, FL
Flood risk 1/10 · Minimal
- FEMA flood zone
- D
- Chance of flooding over 30 yrs
- 0.0%
- Est. flood insurance / yr
- $544 – $1,084
Fire risk 5/10 · Moderate
- Est. fire insurance / yr
- $947 – $1,759
Heat risk 10/10 · Severe
- Hot days now (above 108°F)
- 7 days/yr
- Hot days in 30 yrs
- 28 days/yr
Wind risk 10/10 · Severe
- Chance of severe wind over 30 yrs
- 99.0%
Air-quality risk 2/10 · Minimal
- Unhealthy air days now
- 1 days/yr
- Unhealthy air days in 30 yrs
- 2 days/yr
Risk factors via First Street. Map © Google.
Why this score? — see what drove the D+ grade
The composite is a weighted blend of 9 inputs, each scored 0–100. Each bar is that input's sub-score; the figure is the points it added to the 100-point composite (weight × sub-score).
- Cash flow +17.4/30.0
- ARV discount +7.5/15.0
- DSCR +5.4/10.0
- Schools +4.6/10.0
- 1% rule +4.2/10.0
- Livability +3.8/5.0
- Rent growth +2.5/5.0
- Condition / age +2.5/5.0
- Appreciation +0.0/10.0
$215,000
🖨 Deal sheet 📄 Offer letter ✓ Due diligence
Listing remarks
Discover exceptional value at 27160 Chula Vista Drive in the growing community of Tropical Gulf Acres. This 2-bedroom, 1-bath single-family home offers a bright, functional layout with tile flooring throughout and abundant natural light, creating a clean and easy-to-maintain living space ideal for full-time residents, seasonal users, or investors. The kitchen is equipped with range, refrigerator, dishwasher, and microwave, making it move-in ready or primed for immediate rental potential. Set on a spacious lot, the property provides ample room to expand, entertain, or design your own outdoor retreat, with no HOA restrictions allowing for flexibility and freedom. Located just minutes from Pun
Key facts
- Spacious lot
- No hoa restrictions
- Tile flooring
Tags
Property features AI
Finance
- Other: Single-unit property
- Financial info: Pets allowed with conditional approval (call for details)
- HOA & community: Non-gated community; No association fee
Exterior
- Parking: No parking details provided
- Security: No security features listed
- Utilities: Cable available; Septic tank; Well water
- Home design: Single-story; Resale property; Faces south; North exposure on lot
- Construction: Built with block, concrete, stucco, and wood frame; Shingle roof
- Exterior features: Patio; No other exterior features listed
Interior
- Kitchen: Dishwasher; Range; Refrigerator
- Bedrooms: Great Room
- Flooring: Tile
- Bathrooms: 1 full bathroom
- Heating & cooling: Central air (electric); Ceiling fan(s)
- Interior features: Single-hung windows; Closet cabinetry; Pantry; Unfurnished; No additional interior features listed
- Laundry & utility: Washer hookup; Dryer hookup
Neighborhood map
What this means for you Summary
Snapshot
- This is a 2-bed/1.0-bath single-family listed at $215k.
Deal economics
- At list price, monthly cash flow is $163 ($2k/yr) — positive.
- The deal already cash-flows at list — no discount required.
- To meet the 1% rule (rent ≥ 1% of price), the offer needs to be $199k (7.5% below list).
- Recommended offer: $199k (7.5% below list) — sets the bar for 1% rule.
- Cap rate 7.2% vs local median 2.8% in Punta Gorda — top-decile yield for the area; either an underpriced asset or a hidden risk that comps aren't pricing in. Stress-test before assuming the spread holds.
Location & tenants
- Location reads 76/100 on livability (#225 in FL, #3,567 nationally) — a middle-class / working-renter tenant base. Strengths: schools A+, crime A+, health & safety A+; Watch: cost of living D+, amenities D-, commute F.
- Charlotte (suburban): math 54% / reading 54% proficiency, ranked #22 of 73 in FL (top 30%) — acceptable for families but not a draw, mixed tenant base, ~2y average lease.
- Market conditions: 1481 active listings in the ZIP; 1 comparable units currently listed for rent nearby; solid renter incomes; 4,585 units permitted in Charlotte County in 2024 (703 in 5+ unit buildings).
- This rent runs 31% of the median local income ($77k/yr) — at the standard rent-burdened threshold; future hikes will face affordability resistance.
Forward outlook
- Local home prices are declining (-3.0%/yr); year-one equity from $1k of loan paydown is wiped out by about $6k of value loss. Plan a longer hold.
- Charlotte County population projected at +24% by 2050 — long-run rental-demand tailwind backs the buy-and-hold thesis.
Negotiation context
- It's been on market 51 days — a 3% lower offer ($209k) is reasonable based on typical stale-listing flexibility.
- 5 sale attempts; this cycle's ask is 11844% above the opening price — seller raised mid-cycle; expect resistance to lowballs.
- Current owner paid $142k; list at $215k implies a 51% gain — meaningful room to come down on a strong offer.
Risks & watch-outs
- Climate carrying-cost: severe wind risk, 99% chance of damaging wind over 30y; moderate wildfire risk; extreme-heat days projected 7→28/yr by 2055 (HVAC capex compounding) — expect insurance premiums to compound above CPI over the hold.
Questions for the listing agent
- It's been on market 51 days. Have you received any prior offers? Is the seller open to a 8% concession, seller financing, or rate buy-down credit?
- Is there a deadline driving the sale (1031 exchange, divorce, estate, relocation)? That informs how much negotiation room exists.
- Schools are A-rated — typically a magnet for longer-tenancy family renters. What's the average tenant stay here, and is there a school-zone premium baked into asking?
- The area grade is low — what's the realistic commute time and amenity access for the typical tenant pool here? Any planned neighborhood developments (good or bad) we should know about?
- What's the average days-on-market for RENTAL listings here right now (not sales)? A rising rental-DOM trend means longer vacancies and softer asking-rent achievability than the comps imply.
- What's the recent tenant-quality profile in this submarket — average credit score on applications, eviction rate, late-payment / NSF rate, and stable-employment percentage? A property-management company in the area should have these aggregated.
- How much new for-sale + rental construction is in the pipeline within 1–3 miles? Heavy new supply typically softens prices + rents 12–24 months out; constrained supply supports both.
Investment metrics
- 1% rule
- 0.92% ✗
- Cap rate
- 7.20%
- Cash-on-cash
- 3.25%
- DSCR
- 1.14
- GRM
- 9.0
CMA / ARV
No comps found within radius.
Projected returns pro-forma
-3.0% appreciation · 3.0% rent growth · sell at horizon
- IRR
- -11.2%
- Equity multiple
- 0.59×
- Total profit
- $-24,482
- Equity at exit
- $32,057
- IRR
- -2.0%
- Equity multiple
- 0.87×
- Total profit
- $-8,032
- Equity at exit
- $18,589
Cash invested: $60,200 (down + closing). Projections, not guarantees.
Landlord ↔ Tenant lean methodology
- Overall (STATE)
- 87 Strongly Landlord-Friendly
- State Florida
- 87 Strongly Landlord-Friendly · R+3
- County
- — inherits STATE
- City
- — inherits STATE
ZIP-level market 33955
- Home prices YoY
- -24.5%
- Active inventory
- 1481
- Price-to-rent
- 9.0×
Monthly cashflow live
- Estimated rent
- $1,989 medium interval (Pro) →
- Mortgage (P&I)
- −$1,127
- Tax from tax record
- −$191 /mo · $2,294/yr
- Insurance
- −$90
- HOA
- −$0
- Vacancy / Maint / Mgmt
- −$418
- Net cashflow
- $163
Break-even live
UW: 25.0% down · 7.5% · 30yr · 1.5% tax · 5.0% vac · 8.0% maint · 8.0% mgmt
Financing live
Cash to close
- Down payment
- $53,750
- Closing costs
- $6,450
- Reserves months
- —
- Total cash needed
- —
Loan-product check · same deal, 3 products live
Conventional
25% down · 7.5% · 30yr
- Down + closing
- —
- Monthly P&I
- —
- Monthly cashflow
- —
- DSCR
- —
- Eligible?
- —
Personal DTI + credit; lowest rate.
DSCR
20% down · 8.5% · 30yr
- Down + closing
- —
- Monthly P&I
- —
- Monthly cashflow
- —
- DSCR
- —
- Eligible?
- —
No personal income docs; deal must DSCR.
Hard money
10% down · 12.0% · 12mo
- Down + closing
- —
- Monthly P&I
- —
- Monthly cashflow
- —
- DSCR
- —
- Eligible?
- —
Short-term bridge; refi at stabilization.
Rent comps 1 comps
| Address | Beds | Baths | Sqft | Rent | $/sqft | DOM | Units | Dist |
|---|---|---|---|---|---|---|---|---|
| 27382 Pasadena Dr Punta Gorda, FL | 3.0 | 1.0 | 800 | $1,445 | $1.81 | 21d | 1 | 0.92mi |
Listing history 30 events
-
2026-06-18days on market $215,000 Active 51 DOM
-
2026-06-17days on market $215,000 Active 50 DOM
-
2026-06-16days on market $215,000 Active 49 DOM
-
2026-06-15days on market $215,000 Active 48 DOM
-
2026-06-14days on market $215,000 Active 46 DOM
-
2026-06-13days on market $215,000 Active 45 DOM
-
2026-06-10days on market $215,000 Active 43 DOM
-
2026-06-09days on market $215,000 Active 42 DOM
-
2026-06-08days on market $215,000 Active 41 DOM
-
2026-06-07days on market $215,000 Active 40 DOM
-
2026-06-05days on market $215,000 Active 37 DOM
-
2026-06-03days on market $215,000 Active 36 DOM
-
2026-06-02days on market $215,000 Active 35 DOM
-
2026-06-01days on market $215,000 Active 34 DOM
-
2026-05-31days on market $215,000 Active 33 DOM
-
2026-05-30days on market $215,000 Active 32 DOM
-
2026-04-28$1,800
-
2026-04-25historical $1,800
-
2026-04-24historical
-
2026-04-23$215,000 Active
-
2026-03-07$1,800
-
2026-03-07historical $1,800
-
2026-03-06$1,800
-
2026-03-02price $209,500
-
2026-02-09$234,999 Active
-
2025-11-29soldstatus $142,500
-
2025-09-11soldstatus $160,000
-
2023-10-13soldstatus $87,000
-
1998-02-10soldstatus $20,000
-
1997-04-25soldstatus $4,000
ⓘ Source: listings_history table (triggers on properties + properties_extension) + one-shot
backfill from property_details.listing_events for pre-trigger history.
Tax reassessment forecast FL · Resets to sale price
- Current annual tax
- $2,294 · $191/mo
- Projected year-2 tax
- $2,294 · $191/mo
- Expected delta
- $0/yr ($0/mo · 0.0%)
ⓘ Screening estimate from a state-policy table — verify with the county assessor before closing.
Climate risk First Street
- Flood 1/10 Low FEMA zone D · 0% chance over 30 yrs
- Wildfire 5/10 Major
- Heat 10/10 Extreme 7 d/yr ≥108°F today · 28 d/yr by 30 yrs out
- Wind 10/10 Extreme 99% chance of damaging wind over 30 yrs
- Air quality 2/10 Low 1 unhealthy d/yr today · 2 by 30 yrs out
Nearby sold comps map
Loading sold comps map…
Walkable amenities ~0.75 mi
Loading nearby amenities…
Taxation est. · year 1
- Rental income
- $23,865
- − Mortgage interest
- −$12,043
- − Property taxes
- −$2,294
- − Insurance
- −$1,075
- − Repairs & maintenance
- −$1,909
- − Management
- −$1,909
- − Depreciation
- −$6,255
- Taxable loss
- −$1,620
- Est. tax savings @ 24.0%
- +$389
- After-tax cash flow
- $2,344/yr
For passive investors: Depreciation is non-cash, so a rental often shows a tax loss while cash-flowing — sheltering income. Rental losses are passive: they offset passive income freely, and up to $25,000/yr can offset ordinary (W-2) income if you actively participate and your MAGI is under $100k (phasing out to $0 by $150k); unused losses carry forward. On sale, claimed depreciation is recaptured at up to 25%, and gains may owe capital-gains tax (a 1031 exchange can defer both). Figures are a year-1 estimate at your 24.0% rate — not tax advice; consult a CPA.
Schools (NCES district)
- District
- Charlotte
- NCES district ID
- 1200240
- Math proficiency
- 54% ▼ -6.00%
- Reading proficiency
- 54% ▼ -1.00%
- Median HH income
- $44,864
- Composite
- 45.62/100
- National rank
- #2586
- State rank
- #22 of 73 in FL
Livability — Punta Gorda
- Score
- 76/100
- State rank
- #225
- US rank
- #3567
Category grades
Schools grade is shown separately in the Schools card above.
Census & demographics
- County
- Charlotte County · 196,994 people
- City population
- 68,831
- Metro
- Punta Gorda, FL
- Population (ZIP)
- 12,399
- Household income
- $76,943
- Rent vs Own
- Severe rent burden
- 226.0
Population outlook (Charlotte County) Hauer SSP2
- Today (2025)
- 198,646 people
- By 2030
- 210,507 · +6.0%
- By 2040
- 230,857 · +16.2%
- By 2050
- 247,148 · +24.4%
- By 2075
- 281,777 · +41.8%
- By 2100
- 293,609 · +47.8%
Race, ethnicity, and origin ACS 2023
- Neighborhood character
- Predominantly White (84%)
- Race & ethnicity
- White 84% Hispanic / Latino 10% Two or more races 9% Black 2%
- Hispanic origin (detail)
- Mexican 4% Puerto Rican 2% Cuban 4%
- Common ancestry
- Romanian 5% Italian 3% Serbian 3%
- Foreign-born
- 8% · Canada
- Languages at home
- 91% English-only · Spanish 5% Other Indo-European 1%
Political lean MEDSL · Charlotte
- 2024 margin
- Solid R (+34.0) · D 32.7% · R 66.7%
- 2008→2024 swing
- -26.7pp toward R · 2008: -7.2pp · 2024: -34.0pp
- All cycles
- 2024: R+34.0 2020: R+26.6 2016: R+27.8 2012: R+14.3 2008: R+7.2
Not yet ingested
- Civics
- —
Market trends
- HPI YoY
- ▼ -78.71%
- Current HPI
- 242.9043
- Rent YoY
- —
- Metro
- Punta Gorda, FL
- State GDP YoY
- ▲ 3.28%
- F500 in state
- 36
Industry mix (Fortune 500 HQ in FL)
| Industry | F500 HQs | Revenue |
|---|---|---|
| Industrial Technology | 2 | $29B |
|
||
| Insurance | 2 | $17B |
|
||
| Retail | 1 | $60B |
|
||
| Technology Distribution | 1 | $58B |
|
||
| Homebuilding | 1 | $35B |
|
||
| Technology Manufacturing | 1 | $35B |
|
||
Price history
-55.0% since first listed14 events — show timeline
- 2026-04-28 Listed for Rent $1,800 FGCMLS
- 2026-04-25 Rental Removed $1,800 FGCMLS
- 2026-04-24 Listing Removed — FORTMLS
- 2026-04-23 Listed $215,000 FORTMLS
- 2026-03-07 Listed for Rent $1,800 FGCMLS
- 2026-03-07 Rental Removed $1,800 FORTMLS
- 2026-03-06 Listed for Rent $1,800 FORTMLS
- 2026-03-02 Price Changed $209,500 FORTMLS
- 2026-02-09 Listed $234,999 FORTMLS
- 2025-11-29 Sold (Public Records) $142,500 Public Records
- 2025-09-11 Sold (Public Records) $160,000 Public Records
- 2023-10-13 Sold (Public Records) $87,000 Public Records
- 1998-02-10 Sold (Public Records) $20,000 Public Records
- 1997-04-25 Sold (Public Records) $4,000 Public Records
Property tax history
+8.1%/yrLatest (2025): $2,294 · -7.8% YoY. Source: county tax records.
Cash-flow waterfall
monthlySold comps — $/sqft
last 12 mo · ≤1 miLoading sold comps…