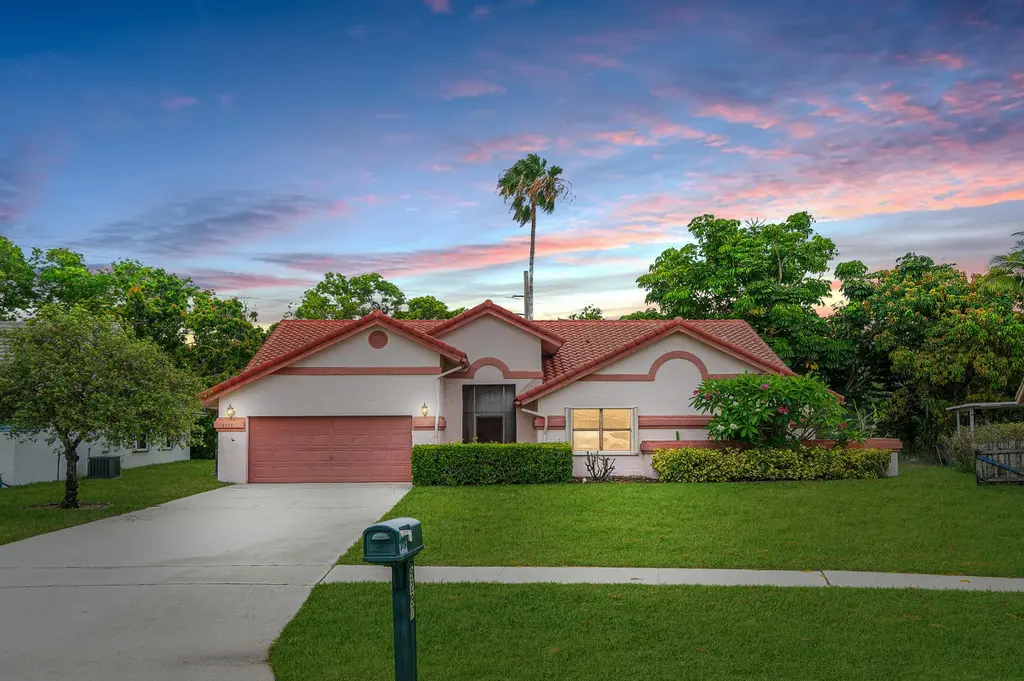
9297 Laurel Green Dr · Boynton Beach, FL
Flood risk 1/10 · Minimal
- FEMA flood zone
- X (unshaded)
- Chance of flooding over 30 yrs
- 0.0%
- Est. flood insurance / yr
- $507 – $1,088
Fire risk 1/10 · Minimal
- Est. fire insurance / yr
- $947 – $1,759
Heat risk 9/10 · Severe
- Hot days now (above 106°F)
- 7 days/yr
- Hot days in 30 yrs
- 25 days/yr
Wind risk 10/10 · Severe
- Chance of severe wind over 30 yrs
- 99.0%
Air-quality risk 2/10 · Minimal
- Unhealthy air days now
- 1 days/yr
- Unhealthy air days in 30 yrs
- 2 days/yr
Risk factors via First Street. Map © Google.
Why this score? — see what drove the D+ grade
The composite is a weighted blend of 9 inputs, each scored 0–100. Each bar is that input's sub-score; the figure is the points it added to the 100-point composite (weight × sub-score).
- Cash flow +13.8/30.0
- ARV discount +7.5/15.0
- Appreciation +4.9/10.0
- Schools +4.3/10.0
- DSCR +4.2/10.0
- Livability +3.6/5.0
- 1% rule +3.4/10.0
- Rent growth +2.8/5.0
- Condition / age +2.5/5.0
$535,000
🖨 Deal sheet (PDF) 📄 Offer letter ✓ Due diligence
Listing remarks
This is an exceptional opportunity offering unlimited potential to make this home your own! Situated on a prime waterfront lot, this spacious home features 4 bedrooms, 2 bath, 2 CG with soaring ceilings and beautiful water views. Recent improvements include NEW freshly painted interior, New carpeting in living room and bedrooms, A/C 2025, Newer Refrigerator and newly pressure cleaned. This home presents the perfect canvas for customization and renovation, whether you're an investor looking for an upside potential or a homeowner with a vision. Sun Valley is a desirable community, with a prime location, low HOA and offers wonderful amenities. This is a must see!
Key facts
- Water views
- New carpeting
- A/c 2025
Tags
Property features AI
Finance
- Other: Pets allowed with breed restrictions
- HOA & community: HOA with monthly fee ($180) covering common areas; Community amenities include pool, tennis courts, pickleball courts, playground, jogging path, and street lights
Exterior
- Parking: Attached 2-car garage; Driveway (total 6 parking spaces, 2 covered)
- Utilities: Public water; Public sewer; Electricity available; Cable available
- Home design: Single family residence; Resale; Single-story; Faces south
- Construction: Concrete/CBS construction; Built with concrete materials
- Exterior features: Waterfront; Concrete roof
Interior
- Kitchen: Microwave; Refrigerator
- Bedrooms: 5 bedrooms on the main level
- Flooring: Carpet; Ceramic tile
- Bathrooms: 2 full bathrooms on the main level
- Heating & cooling: Central heating; Central air conditioning
- Interior features: High ceilings
- Laundry & utility: Electric water heater
Neighborhood map
What this means for you Summary
Snapshot
- This is a 5-bed/2.0-bath single-family listed at $535k.
Deal economics
- At list price, monthly cash flow is $47 ($565/yr) — positive.
- The deal already cash-flows at list — no discount required.
- To meet the 1% rule (rent ≥ 1% of price), the offer needs to be $448k (16.3% below list).
- Recommended offer: $448k (16.3% below list) — sets the bar for 1% rule.
- Cap rate 6.4% vs local median 4.3% in Boynton Beach — top-decile yield for the area; either an underpriced asset or a hidden risk that comps aren't pricing in. Stress-test before assuming the spread holds.
Location & tenants
- Location reads 72/100 on livability (#351 in FL) — a middle-class / working-renter tenant base. Strengths: housing A+, health & safety B+, cost of living B; Watch: amenities D+, crime D-, commute F.
- Palm Beach (suburban): math 46% / reading 53% proficiency, ranked #34 of 73 in FL (top 47%) — families likely to look elsewhere, expect single-tenant / working-renter base with shorter leases.
- Zoned schools: Crystal Lakes Elementary School (math 55% / reading 64%, grade B-, #690 of 2,144 statewide, top 34%, 788 students, 37% FRL); Boynton Beach Community High (math 13% / reading 25%, grade F, #565 of 667 statewide, top 85%, 1,547 students, 65% FRL) — zoned schools at 51% FRL track the district average.
- Market conditions: Rents rising (+1.3%/yr); 489 active listings in the ZIP; 9 comparable units currently listed for rent nearby; rentals at typical pace (median 21d on market — plan ~3-4 weeks tenant-placement turnaround); solid renter incomes; 3,974 units permitted in Palm Beach County in 2024 (1,012 in 5+ unit buildings).
- At $4,479/mo this rent would consume 67% of the median local household income ($81k/yr) (locally 902% of renters already pay >50% of income on rent) — very limited rent-growth headroom before tenants either downsize or default.
Forward outlook
- In year one you build about $2k of equity ($4k loan paydown + $-1k appreciation (-0.2% local appreciation)).
- Palm Beach County population projected at +30% by 2050 — long-run rental-demand tailwind backs the buy-and-hold thesis.
- By year 8, paydown + projected appreciation supports a ~$31k cash-out refi (75% LTV) — recoverable capital for the next deal without selling this one.
Negotiation context
- It's been on market 23 days — a 2% lower offer ($527k) is reasonable based on typical stale-listing flexibility.
- Current owner paid $133k; list at $535k implies a 302% gain — meaningful room to come down on a strong offer.
Risks & watch-outs
- Climate carrying-cost: severe wind risk, 99% chance of damaging wind over 30y; extreme-heat days projected 7→25/yr by 2055 (HVAC capex compounding) — expect insurance premiums to compound above CPI over the hold.
Questions for the listing agent
- What does the HOA fee cover, when was the last increase, and are there any pending special assessments or reserve-fund shortfalls?
- Is there a deadline driving the sale (1031 exchange, divorce, estate, relocation)? That informs how much negotiation room exists.
- Crime grade is D in this area — have there been break-ins, vandalism, or insurance claims at this property in the last 3 years? What carrier currently insures it and at what premium?
- The area grade is low — what's the realistic commute time and amenity access for the typical tenant pool here? Any planned neighborhood developments (good or bad) we should know about?
- What's the average days-on-market for RENTAL listings here right now (not sales)? A rising rental-DOM trend means longer vacancies and softer asking-rent achievability than the comps imply.
- What's the recent tenant-quality profile in this submarket — average credit score on applications, eviction rate, late-payment / NSF rate, and stable-employment percentage? A property-management company in the area should have these aggregated.
- How much new for-sale + rental construction is in the pipeline within 1–3 miles? Heavy new supply typically softens prices + rents 12–24 months out; constrained supply supports both.
Investment metrics
- 1% rule
- 0.84% ✗
- Cap rate
- 6.40%
- Cash-on-cash
- 0.38%
- DSCR
- 1.02
- GRM
- 10.0
CMA / ARV
No comps found within radius.
Projected returns pro-forma
-0.24% appreciation · 1.28% rent growth · sell at horizon
- IRR
- -3.9%
- Equity multiple
- 0.82×
- Total profit
- $-26,378
- Equity at exit
- $148,913
- IRR
- 0.9%
- Equity multiple
- 1.09×
- Total profit
- $13,875
- Equity at exit
- $173,944
Cash invested: $149,800 (down + closing). Projections, not guarantees.
Landlord ↔ Tenant lean methodology
- Overall (STATE)
- 87 Strongly Landlord-Friendly
- State Florida
- 87 Strongly Landlord-Friendly · R+3
- County
- — inherits STATE
- City
- — inherits STATE
ZIP-level market 33437
- Home prices YoY
- -0.1%
- Rents YoY
- 1.3%
- Active inventory
- 489
- Price-to-rent
- 10.0×
Monthly cashflow live
- Estimated rent
- $4,479 high interval (Pro) →
- Mortgage (P&I)
- −$2,806
- Tax from tax record
- −$282 /mo · $3,390/yr
- Insurance
- −$223
- HOA
- −$180
- Vacancy / Maint / Mgmt
- −$941
- Net cashflow
- $47
Break-even live
Sensitivity live
| Price | -10% $350 | -5% $199 | +0% $47 | +5% $-104 | +10% $-256 |
|---|---|---|---|---|---|
| Rent | -10% $-307 | -5% $-130 | +0% $47 | +5% $224 | +10% $401 |
| Rate | -1.0pp $317 | -0.5pp $183 | base $47 | +0.5pp $-92 | +1.0pp $-233 |
UW: 25.0% down · 7.5% · 30yr · 1.5% tax · 5.0% vac · 8.0% maint · 8.0% mgmt
Financing live
Cash to close
- Down payment
- $133,750
- Closing costs
- $16,050
- Reserves months
- —
- Total cash needed
- —
Loan-product check · same deal, 3 products live
Conventional
25% down · 7.5% · 30yr
- Down + closing
- —
- Monthly P&I
- —
- Monthly cashflow
- —
- DSCR
- —
- Eligible?
- —
Personal DTI + credit; lowest rate.
DSCR
20% down · 8.5% · 30yr
- Down + closing
- —
- Monthly P&I
- —
- Monthly cashflow
- —
- DSCR
- —
- Eligible?
- —
No personal income docs; deal must DSCR.
Hard money
10% down · 12.0% · 12mo
- Down + closing
- —
- Monthly P&I
- —
- Monthly cashflow
- —
- DSCR
- —
- Eligible?
- —
Short-term bridge; refi at stabilization.
Rent comps 9 comps
| Address | Beds | Baths | Sqft | Rent | $/sqft | DOM | Units | Dist |
|---|---|---|---|---|---|---|---|---|
| 9215 Sun Pointe Dr Boynton Beach, FL | 4.0 | 2.0 | 2142 | $4,650 | $2.17 | 26d | 1 | 0.10mi |
| 9215 Sun Pointe Dr Boynton Beach, FL | 4.0 | 2.0 | 2142 | $4,650 | $2.17 | 13d | 1 | 0.10mi |
| 9629 El Clair Ranch Rd Boynton Beach, FL | 4.0 | 2.0 | 2231 | $4,800 | $2.15 | 26d | 1 | 0.15mi |
| 6039 Sunberry Cir Boynton Beach, FL | 4.0 | 2.0 | 2149 | $3,650 | $1.70 | 7d | 1 | 0.30mi |
| 9654 Sun Pointe Dr Boynton Beach, FL | 4.0 | 2.0 | 2142 | $4,400 | $2.05 | 26d | 1 | 0.30mi |
| 9121 Paragon Way Boynton Beach, FL | 4.0 | 2.0 | 2154 | $4,950 | $2.30 | 26d | 1 | 0.48mi |
| 8520 Tourmaline Blvd Boynton Beach, FL | 4.0 | 2.0 | 1699 | $4,000 | $2.35 | 21d | 1 | 0.75mi |
| 6143 Windlass Cir Boynton Beach, FL | 4.0 | 2.5 | 2245 | $4,200 | $1.87 | 21d | 1 | 0.87mi |
| 8657 Rosalie Ct Boynton Beach, FL | 4.0 | 2.0 | 2021 | $3,499 | $1.73 | 21d | 1 | 0.99mi |
HOA detail
- Monthly dues
- $180 · $2,160/yr
- Likely covers
- water
Listing history 14 events
-
2026-06-21days on market $535,000 Active 23 DOM
-
2026-06-18days on market $535,000 Active 20 DOM
-
2026-06-17days on market $535,000 Active 19 DOM
-
2026-06-16days on market $535,000 Active 18 DOM
-
2026-06-15days on market $535,000 Active 17 DOM
-
2026-06-13pricedays on market $535,000 Active 15 DOM
-
2026-06-09days on market $550,000 Active 11 DOM
-
2026-06-08days on market $550,000 Active 10 DOM
-
2026-06-07days on market $550,000 Active 9 DOM
-
2026-06-04days on market $550,000 Active 6 DOM
-
2026-06-03days on market $550,000 Active 5 DOM
-
2026-06-02days on market $550,000 Active 4 DOM
-
2026-06-01days on market $550,000 Active 3 DOM
-
2026-05-31days on market $550,000 Active 2 DOM
ⓘ Source: listings_history table (triggers on properties + properties_extension) + one-shot
backfill from property_details.listing_events for pre-trigger history.
Tax reassessment forecast FL · Resets to sale price
- Current annual tax
- $3,390 · $282/mo
- Projected year-2 tax
- $4,440 · $370/mo
- Expected delta
- +$1,051/yr (+$88/mo · 31.0%)
ⓘ Screening estimate from a state-policy table — verify with the county assessor before closing.
Climate risk First Street
- Flood 1/10 Low FEMA zone X (unshaded) · 0% chance over 30 yrs
- Wildfire 1/10 Low
- Heat 9/10 Extreme 7 d/yr ≥106°F today · 25 d/yr by 30 yrs out
- Wind 10/10 Extreme 99% chance of damaging wind over 30 yrs
- Air quality 2/10 Low 1 unhealthy d/yr today · 2 by 30 yrs out
Nearby sold comps map
Loading sold comps map…
Walkable amenities ~0.75 mi
Loading nearby amenities…
Taxation est. · year 1
- Rental income
- $53,743
- − Mortgage interest
- −$29,968
- − Property taxes
- −$3,390
- − Insurance
- −$2,675
- − Repairs & maintenance
- −$4,299
- − Management
- −$4,299
- − HOA
- −$2,160
- − Depreciation
- −$15,564
- Taxable loss
- −$8,612
- Est. tax savings @ 24.0%
- +$2,067
- After-tax cash flow
- $2,632/yr
For passive investors: Depreciation is non-cash, so a rental often shows a tax loss while cash-flowing — sheltering income. Rental losses are passive: they offset passive income freely, and up to $25,000/yr can offset ordinary (W-2) income if you actively participate and your MAGI is under $100k (phasing out to $0 by $150k); unused losses carry forward. On sale, claimed depreciation is recaptured at up to 25%, and gains may owe capital-gains tax (a 1031 exchange can defer both). Figures are a year-1 estimate at your 24.0% rate — not tax advice; consult a CPA.
Schools (NCES district)
- District
- Palm Beach
- NCES district ID
- 1201500
- Math proficiency
- 46% ▼ -16.00%
- Reading proficiency
- 53% ▼ -4.00%
- Median HH income
- $53,943
- Composite
- 42.72/100
- National rank
- #3160
- State rank
- #34 of 73 in FL
Livability — Boynton Beach
- Score
- 72/100
- State rank
- #351
- US rank
- #6098
Category grades
Schools grade is shown separately in the Schools card above.
Census & demographics
- County
- Palm Beach County · 1,438,312 people
- City population
- 148,060
- Metro
- Miami-Fort Lauderdale-Pompano Beach, FL
- Population (ZIP)
- 37,229
- Household income
- $80,710
- Rent vs Own
- Severe rent burden
- 902.0
Population outlook (Palm Beach County) Hauer SSP2
- Today (2025)
- 1,637,487 people
- By 2030
- 1,743,255 · +6.5%
- By 2040
- 1,948,712 · +19.0%
- By 2050
- 2,132,979 · +30.3%
- By 2075
- 2,530,027 · +54.5%
- By 2100
- 2,706,979 · +65.3%
Race, ethnicity, and origin ACS 2023
- Neighborhood character
- Predominantly White (68%)
- Race & ethnicity
- White 68% Two or more races 13% Hispanic / Latino 12% Black 10% Asian 3%
- Hispanic origin (detail)
- Mexican 1% Puerto Rican 2% Cuban 1% Dominican 1%
- Common ancestry
- Scotch-Irish 8% Romanian 8% Hispanic 6%
- Foreign-born
- 18% · Canada, Jamaica, Vietnam
- Languages at home
- 78% English-only · Spanish 10% French/Haitian/Cajun 6% Other Indo-European 2%
Political lean MEDSL · Palm Beach
- 2024 margin
- Toss-up / Even · D 50.0% · R 49.2%
- 2008→2024 swing
- -22.1pp toward R · 2008: 22.9pp · 2024: 0.8pp
- All cycles
- 2024: D+0.8 2020: D+12.8 2016: D+15.3 2012: D+17.0 2008: D+22.9
Not yet ingested
- Civics
- —
Market trends
- HPI YoY
- ▼ -0.24%
- Current HPI
- 257.5891
- Rent YoY
- ▲ 1.28%
- Metro
- Miami-Fort Lauderdale-Pompano Beach, FL
- State GDP YoY
- ▲ 3.28%
- F500 in state
- 36
Industry mix (Fortune 500 HQ in FL)
| Industry | F500 HQs | Revenue |
|---|---|---|
| Industrial Technology | 2 | $29B |
|
||
| Insurance | 2 | $17B |
|
||
| Retail | 1 | $60B |
|
||
| Technology Distribution | 1 | $58B |
|
||
| Homebuilding | 1 | $35B |
|
||
| Technology Manufacturing | 1 | $35B |
|
||
Price history
+313.5% since first listed2 events — show timeline
- 2026-05-29 Listed $550,000 Beaches MLS
- 1988-06-13 Sold (Public Records) $133,000 Public Records
Property tax history
+1.4%/yrLatest (2025): $3,390 · +3.3% YoY. Source: county tax records.
Cash-flow waterfall
monthlySold comps — $/sqft
last 12 mo · ≤1 miLoading sold comps…