 Multi-family
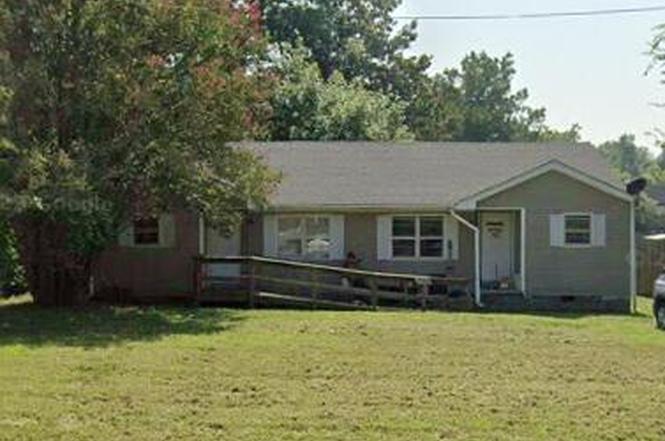
5987 Tennessee 104 · Dyersburg, TN
Flood risk 1/10 · Minimal
- FEMA flood zone
- X (unshaded)
- Chance of flooding over 30 yrs
- 0.0%
- Est. flood insurance / yr
- $507 – $1,088
Fire risk 2/10 · Minimal
- Est. fire insurance / yr
- $949 – $1,763
Heat risk 6/10 · Moderate
- Hot days now (above 107°F)
- 7 days/yr
- Hot days in 30 yrs
- 21 days/yr
Wind risk 4/10 · Minor
- Chance of severe wind over 30 yrs
- 12.0%
Air-quality risk 2/10 · Minimal
- Unhealthy air days now
- 0 days/yr
- Unhealthy air days in 30 yrs
- 1 days/yr
Risk factors via First Street. Map © Google.
Why this score? — see what drove the C grade
The composite is a weighted blend of 9 inputs, each scored 0–100. Each bar is that input's sub-score; the figure is the points it added to the 100-point composite (weight × sub-score).
- Cash flow +25.8/30.0
- DSCR +8.7/10.0
- ARV discount +7.5/15.0
- 1% rule +5.8/10.0
- Schools +3.3/10.0
- Livability +3.2/5.0
- Rent growth +2.5/5.0
- Condition / age +2.5/5.0
- Appreciation +0.0/10.0
$124,000
🖨 Deal sheet (PDF) 📄 Offer letter ✓ Due diligence
Multi-family units
County records classify this as Multi-Family (2-4 Unit). Listing-text estimate: 1 unit. estimate disagrees with records
Listing remarks
Solid turn-key income-producing property located at 5987 E Hwy 104, Dyersburg, TN currently renting for $1,300 per month. This single-family home offers steady cash flow with strong rental demand and convenient access to local amenities and major routes. A great opportunity for investors looking to expand their rental portfolio. Can be purchased with other properties for an even better deal!
Key facts
- Strong rental demand
- Steady cash flow
- 9,450 sq ft lot
Tags
Neighborhood map
What this means for you Summary
Snapshot
- This is a 4-bed/2.0-bath multifamily listed at $124k.
Deal economics
- At list price, monthly cash flow is $303 ($4k/yr) — positive.
- The deal already cash-flows at list — no discount required.
- Meets the 1% rule at list price ($1k rent vs $124k).
- Recommended offer: $113k (9.0% below list) — sets the bar for market timing.
Location & tenants
- Location reads 64/100 on livability (#177 in TN) — a middle-class / working-renter tenant base. Strengths: cost of living A+, housing A+, health & safety A+; Watch: crime F, amenities F, commute F.
- Dyer County (rural): math 40% / reading 38% proficiency, ranked #16 of 139 in TN (top 12%) — families likely to look elsewhere, expect single-tenant / working-renter base with shorter leases.
- Zoned schools: Newbern Elementary School (math 39% / reading 33%, grade F, #305 of 952 statewide, top 32%, 561 students, 0% FRL); Northview Middle School (math 40% / reading 32%, grade F, #60 of 333 statewide, top 19%, 413 students, 0% FRL); Dyer County High School (math 21% / reading 48%, grade F, #41 of 332 statewide, top 15%, 1,070 students, 0% FRL) — zoned schools average 0% FRL vs 54% district-wide (54 pts lower); this property's tenant base skews higher-income than the district average.
- Market conditions: 66 active listings in the ZIP; 74 units permitted in Dyer County in 2024 (6 in 5+ unit buildings).
Forward outlook
- Local home prices are declining (-3.0%/yr); year-one equity from $857 of loan paydown is wiped out by about $4k of value loss. Plan a longer hold.
- Dyer County population projected at -13% by 2050 — secular population decline; favor cash flow + early exit over multi-decade hold.
Negotiation context
- It's been on market 96 days — a 9% lower offer ($113k) is reasonable based on typical stale-listing flexibility.
- Current owner paid $50k; list at $124k implies a 151% gain — meaningful room to come down on a strong offer.
Risks & watch-outs
- Climate carrying-cost: extreme-heat days projected 7→21/yr by 2055 (HVAC capex compounding) — expect insurance premiums to compound above CPI over the hold.
Questions for the listing agent
- It's been on market 96 days. Have you received any prior offers? Is the seller open to a 9% concession, seller financing, or rate buy-down credit?
- Built in 1960 — when were the roof, HVAC, electrical panel, plumbing, and water heater last replaced?
- Why hasn't it sold? Are there any deal-killer items the seller is aware of (foundation, flood, title, zoning, code violations)?
- Is there a deadline driving the sale (1031 exchange, divorce, estate, relocation)? That informs how much negotiation room exists.
- Schools are D-rated, which usually means shorter tenancies and higher turnover. Who's the typical renter profile here, and what's been the actual vacancy rate?
- Crime grade is F in this area — have there been break-ins, vandalism, or insurance claims at this property in the last 3 years? What carrier currently insures it and at what premium?
- What's the average days-on-market for RENTAL listings here right now (not sales)? A rising rental-DOM trend means longer vacancies and softer asking-rent achievability than the comps imply.
- What's the recent tenant-quality profile in this submarket — average credit score on applications, eviction rate, late-payment / NSF rate, and stable-employment percentage? A property-management company in the area should have these aggregated.
- How much new apartment / multifamily construction is in the pipeline within 1–3 miles? Heavy new supply (>2% of stock underway) typically softens rents 12–24 months out; light construction supports rent growth.
Investment metrics
- 1% rule
- 1.08% ✓
- Cap rate
- 9.22%
- Cash-on-cash
- 10.46%
- DSCR
- 1.47
- GRM
- 7.8
CMA / ARV
No comps found within radius.
Projected returns pro-forma
-3.0% appreciation · 3.0% rent growth · sell at horizon
- IRR
- -0.7%
- Equity multiple
- 0.98×
- Total profit
- $-859
- Equity at exit
- $18,489
- IRR
- 9.0%
- Equity multiple
- 1.69×
- Total profit
- $23,893
- Equity at exit
- $10,721
Cash invested: $34,720 (down + closing). Projections, not guarantees.
Landlord ↔ Tenant lean methodology
- Overall (STATE)
- 87 Strongly Landlord-Friendly
- State Tennessee
- 87 Strongly Landlord-Friendly · R+13
- County
- — inherits STATE
- City
- — inherits STATE
ZIP-level market 38024
- Home prices YoY
- -28.5%
- Active inventory
- 66
- Price-to-rent
- 7.8×
Monthly cashflow live
- Estimated rent
- $1,333 medium interval (Pro) →
- Mortgage (P&I)
- −$650
- Tax from tax record
- −$49 /mo · $583/yr
- Insurance
- −$52
- HOA
- −$0
- Vacancy / Maint / Mgmt
- −$280
- Net cashflow
- $303
Break-even live
Sensitivity live
| Price | -10% $373 | -5% $338 | +0% $303 | +5% $268 | +10% $233 |
|---|---|---|---|---|---|
| Rent | -10% $197 | -5% $250 | +0% $303 | +5% $355 | +10% $408 |
| Rate | -1.0pp $365 | -0.5pp $334 | base $303 | +0.5pp $271 | +1.0pp $238 |
UW: 25.0% down · 7.5% · 30yr · 1.5% tax · 5.0% vac · 8.0% maint · 8.0% mgmt
Financing live
Cash to close
- Down payment
- $31,000
- Closing costs
- $3,720
- Reserves months
- —
- Total cash needed
- —
Loan-product check · same deal, 3 products live
Conventional
25% down · 7.5% · 30yr
- Down + closing
- —
- Monthly P&I
- —
- Monthly cashflow
- —
- DSCR
- —
- Eligible?
- —
Personal DTI + credit; lowest rate.
DSCR
20% down · 8.5% · 30yr
- Down + closing
- —
- Monthly P&I
- —
- Monthly cashflow
- —
- DSCR
- —
- Eligible?
- —
No personal income docs; deal must DSCR.
Hard money
10% down · 12.0% · 12mo
- Down + closing
- —
- Monthly P&I
- —
- Monthly cashflow
- —
- DSCR
- —
- Eligible?
- —
Short-term bridge; refi at stabilization.
Listing history 14 events
-
2026-04-16status Pending
-
2026-04-15price $124,000
-
2026-03-07price $126,000
-
2026-01-10$129,000 Active
-
2025-09-04price $499,000
-
2025-07-12price $550,000
-
2025-06-18price $599,999
-
2025-06-13price $629,999
-
2025-06-03price $640,000
-
2021-06-09soldstatus $49,500
-
2010-11-08soldstatus $109,000
-
2007-10-17soldstatus $70,000
-
2007-04-30soldstatus $52,500
-
1985-07-31soldstatus $27,500
ⓘ Source: listings_history table (triggers on properties + properties_extension) + one-shot
backfill from property_details.listing_events for pre-trigger history.
Tax reassessment forecast TN · Resets to sale price
- Current annual tax
- $583 · $49/mo
- Projected year-2 tax
- $880 · $73/mo
- Expected delta
- +$297/yr (+$25/mo · 51.0%)
ⓘ Screening estimate from a state-policy table — verify with the county assessor before closing.
Climate risk First Street
- Flood 1/10 Low FEMA zone X (unshaded) · 0% chance over 30 yrs
- Wildfire 2/10 Low
- Heat 6/10 Major 7 d/yr ≥107°F today · 21 d/yr by 30 yrs out
- Wind 4/10 Moderate 12% chance of damaging wind over 30 yrs
- Air quality 2/10 Low 0 unhealthy d/yr today · 1 by 30 yrs out
Nearby sold comps map
Loading sold comps map…
Walkable amenities ~0.75 mi
Loading nearby amenities…
Taxation est. · year 1
- Rental income
- $15,998
- − Mortgage interest
- −$6,946
- − Property taxes
- −$583
- − Insurance
- −$620
- − Repairs & maintenance
- −$1,280
- − Management
- −$1,280
- − Depreciation
- −$3,607
- Taxable income
- $1,682
- Est. tax owed @ 24.0%
- −$404
- After-tax cash flow
- $3,229/yr
For passive investors: Depreciation is non-cash, so a rental often shows a tax loss while cash-flowing — sheltering income. Rental losses are passive: they offset passive income freely, and up to $25,000/yr can offset ordinary (W-2) income if you actively participate and your MAGI is under $100k (phasing out to $0 by $150k); unused losses carry forward. On sale, claimed depreciation is recaptured at up to 25%, and gains may owe capital-gains tax (a 1031 exchange can defer both). Figures are a year-1 estimate at your 24.0% rate — not tax advice; consult a CPA.
Schools (NCES district)
- District
- Dyer County
- NCES district ID
- 4701050
- Math proficiency
- 40% ▼ -14.00%
- Reading proficiency
- 38% ▼ -1.00%
- Median HH income
- $44,865
- Composite
- 33.19/100
- National rank
- #5536
- State rank
- #16 of 139 in TN
Livability — Dyersburg
- Score
- 64/100
- State rank
- #177
- US rank
- #14658
Category grades
Schools grade is shown separately in the Schools card above.
Census & demographics
- County
- Dyer County · 25,952 people
- City population
- 25,952
- Metro
- Dyersburg, TN
- Population (ZIP)
- 25,952
- Household income
- $57,061
- Rent vs Own
- Severe rent burden
- 939.0
Population outlook (Dyer County) Hauer SSP2
- Today (2025)
- 36,770 people
- By 2030
- 35,863 · -2.5%
- By 2040
- 33,989 · -7.6%
- By 2050
- 32,124 · -12.6%
- By 2075
- 28,702 · -21.9%
- By 2100
- 25,745 · -30.0%
Race, ethnicity, and origin ACS 2023
- Neighborhood character
- Predominantly White (74%)
- Race & ethnicity
- White 74% Black 19% Two or more races 4% Hispanic / Latino 3%
- Common ancestry
- Italian 2% Romanian 2% Serbian 2%
- Foreign-born
- 2% · Canada
- Languages at home
- 97% English-only · Spanish 2%
Political lean MEDSL · Dyer
- 2024 margin
- Solid R (+61.8) · D 18.8% · R 80.6%
- 2008→2024 swing
- -24.1pp toward R · 2008: -37.7pp · 2024: -61.8pp
- All cycles
- 2024: R+61.8 2020: R+57.1 2016: R+55.4 2012: R+44.7 2008: R+37.7
Not yet ingested
- Civics
- —
Market trends
- HPI YoY
- ▼ -64.52%
- Current HPI
- 162.1695
- Rent YoY
- —
- Metro
- Dyersburg, TN
- State GDP YoY
- ▲ 2.78%
- F500 in state
- 22
Industry mix (Fortune 500 HQ in TN)
| Industry | F500 HQs | Revenue |
|---|---|---|
| Healthcare | 3 | $91B |
|
||
| Retail | 3 | $72B |
|
||
| Transportation / Logistics | 1 | $88B |
|
||
| Paper / Packaging | 1 | $19B |
|
||
| Insurance | 1 | $13B |
|
||
| Energy | 1 | $12B |
|
||
Price history
+350.9% since first listed14 events — show timeline
- 2026-04-16 Pending — CWTAR
- 2026-04-15 Price Changed $124,000 CWTAR
- 2026-03-07 Price Changed $126,000 CWTAR
- 2026-01-10 Listed $129,000 CWTAR
- 2025-09-04 Price Changed $499,000 CWTAR
- 2025-07-12 Price Changed $550,000 CWTAR
- 2025-06-18 Price Changed $599,999 CWTAR
- 2025-06-13 Price Changed $629,999 CWTAR
- 2025-06-03 Price Changed $640,000 CWTAR
- 2021-06-09 Sold (Public Records) $49,500 Public Records
- 2010-11-08 Sold (Public Records) $109,000 Public Records
- 2007-10-17 Sold (Public Records) $70,000 Public Records
- 2007-04-30 Sold (Public Records) $52,500 Public Records
- 1985-07-31 Sold (Public Records) $27,500 Public Records
Property tax history
+3.7%/yrLatest (2025): $583 · -13.2% YoY. Source: county tax records.
Cash-flow waterfall
monthlySold comps — $/sqft
last 12 mo · ≤1 miLoading sold comps…