 Fourplex
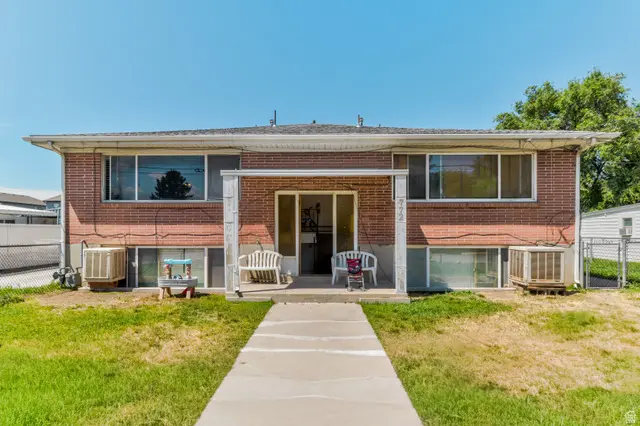
772 W Lennox St · Midvale, UT
Flood risk 3/10 · Minor
- FEMA flood zone
- X (unshaded)
- Chance of flooding over 30 yrs
- 0.2%
- Est. flood insurance / yr
- $507 – $1,088
Fire risk 1/10 · Minimal
- Est. fire insurance / yr
- $453 – $841
Heat risk 4/10 · Minor
- Hot days now (above 95°F)
- 7 days/yr
- Hot days in 30 yrs
- 19 days/yr
Wind risk 1/10 · Minimal
- Chance of severe wind over 30 yrs
- —
Air-quality risk 3/10 · Minor
- Unhealthy air days now
- 3 days/yr
- Unhealthy air days in 30 yrs
- 5 days/yr
Risk factors via First Street. Map © Google.
Why this score? — see what drove the C- grade
The composite is a weighted blend of 9 inputs, each scored 0–100. Each bar is that input's sub-score; the figure is the points it added to the 100-point composite (weight × sub-score).
- Cash flow +20.6/30.0
- ARV discount +7.5/15.0
- DSCR +6.5/10.0
- Schools +4.6/10.0
- 1% rule +4.4/10.0
- Livability +4.0/5.0
- Condition / age +2.5/5.0
- Rent growth +2.4/5.0
- Appreciation +0.0/10.0
$925,000
🖨 Deal sheet (PDF) 📄 Offer letter ✓ Due diligence
Multi-family units
County records classify this as Multi-Family (5+ Unit). Listing-text estimate: 4 units. estimate disagrees with records
5+ unit building — per-unit beds/baths from public records are typically unavailable; the breakdown below (if shown) is an estimate from the listing text.
Listing remarks MLS
There are no remarks available.
Key facts
- Brand new roof
- All brick fourplex
- Remodeled kitchen
Tags
Property features AI
Finance
- Other: Zoned Multi-Family (RM-25)
- Financial info: Unit rents (current actual rents): $1,605; $1,244; $1,075; $1,244
- HOA & community: HOA/community details not provided
Exterior
- Parking: Covered parking available; Also has open/uncovered parking; Total of 4 parking spaces (4 garage spaces, 4 covered spaces listed)
- Security: Security details not provided
- Utilities: Natural gas connected; Electricity connected; Sewer connected; Culinary (municipal) water
- Home design: 2-story multi-family building
- Construction: Brick construction; Asphalt roof
- Exterior features: Automatic full sprinklers; South-facing
Interior
- Kitchen: Kitchens included in each unit (appliance details not provided)
- Bedrooms: Unit mix includes three 2-bedroom units and one 1-bedroom unit
- Flooring: Flooring details not provided
- Bathrooms: Each unit has one bathroom
- Heating & cooling: Gas radiant heating
- Interior features: Residential multi-family property; Total of 4 dwelling units; Property condition: Built/Standing
- Laundry & utility: Laundry/utility details not provided
Neighborhood map
What this means for you Summary
Snapshot
- This is a 4 × 7-bed/4.0-bath units multifamily listed at $925k.
Deal economics
- At list price, monthly cash flow is $1k ($15k/yr) — positive. Per door: $308/mo.
- The deal already cash-flows at list — no discount required.
- To meet the 1% rule (rent ≥ 1% of price), the offer needs to be $872k (5.7% below list).
- Recommended offer: $872k (5.7% below list) — sets the bar for 1% rule.
Location & tenants
- Location reads 80/100 on livability (#35 in UT, #1,704 nationally) — a professional / high-income tenant draw. Strengths: amenities A+, commute A+, housing A+.
- Canyons District (suburban): math 49% / reading 53% proficiency, ranked #12 of 80 in UT (top 15%) — acceptable for families but not a draw, mixed tenant base, ~2y average lease.
- Zoned schools: Midvale School (math 17% / reading 17%, grade F, #542 of 585 statewide, top 93%, 722 students, 99% FRL); Midvale Middle (math 24% / reading 28%, grade F, #119 of 138 statewide, top 87%, 907 students, 98% FRL); Hillcrest High (math 23% / reading 50%, grade F, #86 of 171 statewide, top 52%, 2,296 students, 37% FRL) — zoned schools average 78% FRL vs 27% district-wide (51 pts higher); higher-poverty schools than district average — tighter screening recommended.
- Zoned-school proficiency averages 26% at this address vs 51% district-wide (-24 pts) — the specific schools serving this property underperform the Canyons District average; the district grade overstates school quality for this exact location.
- Market conditions: Rents soft (-0.3%/yr); 208 active listings in the ZIP; solid renter incomes; 4,970 units permitted in Salt Lake County in 2024 (1,963 in 5+ unit buildings).
- At $8,723/mo this rent would consume 138% of the median local household income ($76k/yr) (locally 2050% of renters already pay >50% of income on rent) — very limited rent-growth headroom before tenants either downsize or default.
Forward outlook
- Local home prices are declining (-3.0%/yr); year-one equity from $6k of loan paydown is wiped out by about $28k of value loss. Plan a longer hold.
- Salt Lake County population projected at +37% by 2050 — long-run rental-demand tailwind backs the buy-and-hold thesis.
Negotiation context
- Only 10 days on market — expect competitive offers; lowballing is unlikely to land.
- 7 sale attempts since 20y ago with the ask held roughly flat each time — persistent listings suggest the price (not the market) is what's stuck; bring a comps-based counter.
Risks & watch-outs
- Watch-outs: built in 1956 — expect roof / HVAC / electrical / plumbing capex.
Questions for the listing agent
- Can we see the unit-by-unit rent roll, current vacancy, and any below-market leases? What's the average tenancy length?
- What capital expenditures (roof, boiler, parking lot, exteriors) have been made in the last 5 years, and what's planned in the next 2?
- Built in 1956 — when were the roof, HVAC, electrical panel, plumbing, and water heater last replaced?
- Is there a deadline driving the sale (1031 exchange, divorce, estate, relocation)? That informs how much negotiation room exists.
- Schools are D-rated, which usually means shorter tenancies and higher turnover. Who's the typical renter profile here, and what's been the actual vacancy rate?
- What's the average days-on-market for RENTAL listings here right now (not sales)? A rising rental-DOM trend means longer vacancies and softer asking-rent achievability than the comps imply.
- What's the recent tenant-quality profile in this submarket — average credit score on applications, eviction rate, late-payment / NSF rate, and stable-employment percentage? A property-management company in the area should have these aggregated.
- How much new apartment / multifamily construction is in the pipeline within 1–3 miles? Heavy new supply (>2% of stock underway) typically softens rents 12–24 months out; light construction supports rent growth.
Investment metrics
- 1% rule
- 0.94% ✗
- Cap rate
- 7.89%
- Cash-on-cash
- 5.72%
- DSCR
- 1.25
- GRM
- 8.8
CMA / ARV
No comps found within radius.
Projected returns pro-forma
-3.0% appreciation · 0.0% rent growth · sell at horizon
- IRR
- -10.6%
- Equity multiple
- 0.62×
- Total profit
- $-97,207
- Equity at exit
- $137,921
- IRR
- -5.7%
- Equity multiple
- 0.68×
- Total profit
- $-83,573
- Equity at exit
- $79,977
Cash invested: $259,000 (down + closing). Projections, not guarantees.
Landlord ↔ Tenant lean methodology
- Overall (STATE)
- 86 Strongly Landlord-Friendly
- State Utah
- 86 Strongly Landlord-Friendly · R+15
- County
- — inherits STATE
- City
- — inherits STATE
ZIP-level market 84047
- Rents YoY
- -0.3%
- Active inventory
- 208
- Price-to-rent
- 35.3×
Monthly cashflow live
- Estimated rent
- $8,723 medium interval (Pro) →
- Mortgage (P&I)
- −$4,851
- Tax from tax record
- −$421 /mo · $5,057/yr
- Insurance
- −$385
- HOA
- −$0
- Vacancy / Maint / Mgmt
- −$1,832
- Net cashflow
- $1,234
Break-even live
Sensitivity live
| Price | -10% $1,757 | -5% $1,495 | +0% $1,234 | +5% $972 | +10% $710 |
|---|---|---|---|---|---|
| Rent | -10% $544 | -5% $889 | +0% $1,234 | +5% $1,578 | +10% $1,923 |
| Rate | -1.0pp $1,699 | -0.5pp $1,469 | base $1,234 | +0.5pp $994 | +1.0pp $750 |
4-unit breakdown (identical units grouped — click to expand)
| Units | Beds | Baths | Est. rent |
|---|---|---|---|
| 4× units | 7 | 4 | $8,724 |
| #1 | 7 | 4 | $2,181 |
| #2 | 7 | 4 | $2,181 |
| #3 | 7 | 4 | $2,181 |
| #4 | 7 | 4 | $2,181 |
| Total (4 units) | $8,723 | ||
UW: 25.0% down · 7.5% · 30yr · 1.5% tax · 5.0% vac · 8.0% maint · 8.0% mgmt
Financing live
Cash to close
- Down payment
- $231,250
- Closing costs
- $27,750
- Reserves months
- —
- Total cash needed
- —
Loan-product check · same deal, 3 products live
Conventional
25% down · 7.5% · 30yr
- Down + closing
- —
- Monthly P&I
- —
- Monthly cashflow
- —
- DSCR
- —
- Eligible?
- —
Personal DTI + credit; lowest rate.
DSCR
20% down · 8.5% · 30yr
- Down + closing
- —
- Monthly P&I
- —
- Monthly cashflow
- —
- DSCR
- —
- Eligible?
- —
No personal income docs; deal must DSCR.
Hard money
10% down · 12.0% · 12mo
- Down + closing
- —
- Monthly P&I
- —
- Monthly cashflow
- —
- DSCR
- —
- Eligible?
- —
Short-term bridge; refi at stabilization.
Listing history 7 events
-
2026-06-21days on market $925,000 Active 10 DOM
-
2026-06-18days on market $925,000 Active 7 DOM
-
2026-06-17days on market $925,000 Active 6 DOM
-
2026-06-16days on market $925,000 Active 5 DOM
-
2026-06-15days on market $925,000 Active 4 DOM
-
2026-06-13remarks 699-char remark
-
2026-06-13$925,000 Active 2 DOM
ⓘ Source: listings_history table (triggers on properties + properties_extension) + one-shot
backfill from property_details.listing_events for pre-trigger history.
Tax reassessment forecast UT · Resets to sale price
- Current annual tax
- $5,057 · $421/mo
- Projected year-2 tax
- $6,105 · $509/mo
- Expected delta
- +$1,048/yr (+$87/mo · 20.7%)
ⓘ Screening estimate from a state-policy table — verify with the county assessor before closing.
Climate risk First Street
- Flood 3/10 Moderate FEMA zone X (unshaded) · 20% chance over 30 yrs
- Wildfire 1/10 Low
- Heat 4/10 Moderate 7 d/yr ≥95°F today · 19 d/yr by 30 yrs out
- Wind 1/10 Low
- Air quality 3/10 Moderate 3 unhealthy d/yr today · 5 by 30 yrs out
Nearby sold comps map
Loading sold comps map…
Walkable amenities ~0.75 mi
Loading nearby amenities…
Taxation est. · year 1
- Rental income
- $104,676
- − Mortgage interest
- −$51,814
- − Property taxes
- −$5,057
- − Insurance
- −$4,625
- − Repairs & maintenance
- −$8,374
- − Management
- −$8,374
- − Depreciation
- −$26,909
- Taxable loss
- −$477
- Est. tax savings @ 24.0%
- +$115
- After-tax cash flow
- $14,917/yr
For passive investors: Depreciation is non-cash, so a rental often shows a tax loss while cash-flowing — sheltering income. Rental losses are passive: they offset passive income freely, and up to $25,000/yr can offset ordinary (W-2) income if you actively participate and your MAGI is under $100k (phasing out to $0 by $150k); unused losses carry forward. On sale, claimed depreciation is recaptured at up to 25%, and gains may owe capital-gains tax (a 1031 exchange can defer both). Figures are a year-1 estimate at your 24.0% rate — not tax advice; consult a CPA.
Schools (NCES district)
- District
- Canyons District
- NCES district ID
- 4900142
- Math proficiency
- 49% ▼ -5.00%
- Reading proficiency
- 53% ▼ -3.00%
- Median HH income
- $74,107
- Composite
- 45.91/100
- National rank
- #2548
- State rank
- #12 of 80 in UT
Livability — Midvale
- Score
- 80/100
- State rank
- #35
- US rank
- #1704
Category grades
Schools grade is shown separately in the Schools card above.
Census & demographics
- Census place
- Midvale, UT
- County
- Salt Lake County · 1,195,750 people
- City population
- 37,411
- Metro
- Salt Lake City, UT
- Population (ZIP)
- 37,411
- Household income
- $75,954
- Rent vs Own
- Severe rent burden
- 2050.0
Population outlook (Salt Lake County) Hauer SSP2
- Today (2025)
- 1,305,860 people
- By 2030
- 1,402,611 · +7.4%
- By 2040
- 1,594,533 · +22.1%
- By 2050
- 1,787,244 · +36.9%
- By 2075
- 2,224,138 · +70.3%
- By 2100
- 2,551,390 · +95.4%
Race, ethnicity, and origin ACS 2023
- Neighborhood character
- Predominantly White (66%)
- Race & ethnicity
- White 66% Hispanic / Latino 17% Two or more races 13% Asian 4% Pacific Islander 3% Black 2% Native American 1%
- Hispanic origin (detail)
- Mexican 12%
- Common ancestry
- Italian 4% Slovak 4% Portuguese 2%
- Foreign-born
- 13% · Canada, China
- Languages at home
- 80% English-only · Spanish 10% Russian/Polish/Slavic 2% Other Asian/Pacific 2%
Political lean MEDSL · Salt Lake
- 2024 margin
- D (+10.2) · D 53.7% · R 43.5% · Other 2.8%
- 2008→2024 swing
- +10.1pp toward D · 2008: 0.1pp · 2024: 10.2pp
- All cycles
- 2024: D+10.2 2020: D+11.0 2016: D+10.2 2012: R+19.3 2008: D+0.1
Not yet ingested
- Civics
- —
Market trends
- HPI YoY
- ▼ -175.42%
- Current HPI
- 313.2184
- Rent YoY
- ▼ -0.30%
- Metro
- Salt Lake City, UT
- State GDP YoY
- ▲ 3.54%
- F500 in state
- 2
Industry mix (Fortune 500 HQ in UT)
| Industry | F500 HQs | Revenue |
|---|---|---|
| Financial Services | 1 | $3B |
|
||
Price history
+189.2% since first listed18 events — show timeline
- 2026-06-11 Listed $925,000 WFRMLS
- 2024-04-10 Rental Removed $1,195 APPFOLIO
- 2024-03-15 Price Changed $1,195 APPFOLIO
- 2024-03-13 Listed for Rent $1,250 APPFOLIO
- 2024-01-13 Rental Removed $1,145 APPFOLIO
- 2024-01-04 Price Changed $1,145 APPFOLIO
- 2023-12-01 Listed for Rent $1,195 APPFOLIO
- 2022-09-19 Sold (MLS) — WFRMLS
- 2022-09-16 Sold (Public Records) — Public Records
- 2022-08-18 Pending — WFRMLS
- 2022-08-04 Listed $855,000 WFRMLS
- 2011-04-29 Listing Removed — WFRMLS
- 2010-10-30 Listed $345,873 WFRMLS
- 2006-10-20 Sold (Public Records) — Public Records
- 2006-10-13 Sold (MLS) — WFRMLS
- 2006-08-02 Listing Removed — WFRMLS
- 2006-08-01 Listed $319,900 WFRMLS
- 2006-07-14 Listed $319,900 WFRMLS
Property tax history
+6.3%/yrLatest (2025): $5,057 · +9.5% YoY. Source: county tax records.
Cash-flow waterfall
monthlySold comps — $/sqft
last 12 mo · ≤1 miLoading sold comps…