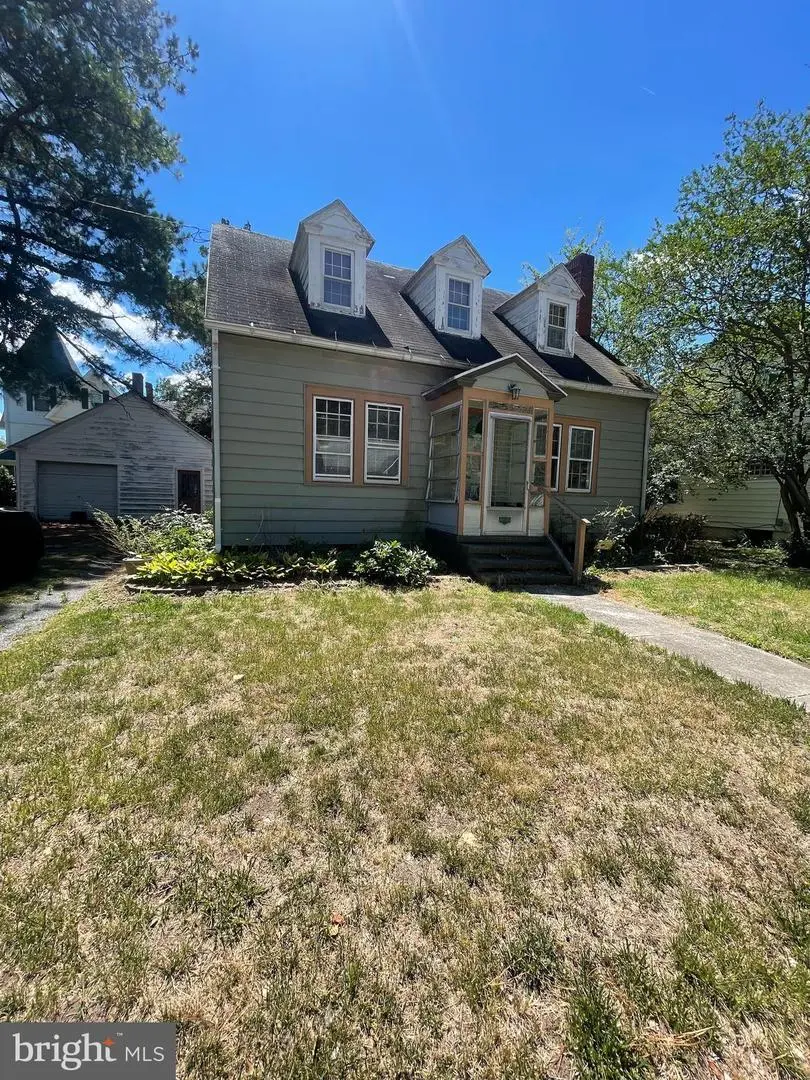
203 8th St · Pocomoke City, MD
Flood risk No data
- FEMA flood zone
- —
- Chance of flooding over 30 yrs
- %
- Est. flood insurance / yr
- —
Fire risk No data
- Est. fire insurance / yr
- —
Heat risk No data
- Hot days now (above °F)
- days/yr
- Hot days in 30 yrs
- days/yr
Wind risk No data
- Chance of severe wind over 30 yrs
- %
Air-quality risk No data
- Unhealthy air days now
- days/yr
- Unhealthy air days in 30 yrs
- days/yr
Risk factors via First Street. Map © Google.
Why this score? — see what drove the B- grade
The composite is a weighted blend of 9 inputs, each scored 0–100. Each bar is that input's sub-score; the figure is the points it added to the 100-point composite (weight × sub-score).
- Cash flow +30.0/30.0
- 1% rule +10.0/10.0
- DSCR +10.0/10.0
- ARV discount +7.5/15.0
- Livability +3.6/5.0
- Schools +3.3/10.0
- Rent growth +2.5/5.0
- Condition / age +2.5/5.0
- Appreciation +0.0/10.0
$109,900
🖨 Deal sheet (PDF) 📄 Offer letter ✓ Due diligence
Listing remarks
CALLING ALL INVESTORS! This property is the one you have been waiting for! This one will not last! This Property is being sold As-Is condition. Buyer is responsible for all certifications. Seller never occupied. Neither the seller or listing agent make any representation as to the accuracy of any information contained herein. Buyer must conduct their own due diligence, verification, research and inspections and are relying solely on the results thereof. Buyer to pay all closing costs and transfer tax.
Key facts
- 6,739 sq ft lot
- Garage
- Built 1930
Neighborhood map
What this means for you Summary
Snapshot
- This is a 3-bed/1.0-bath single-family listed at $110k.
Deal economics
- At list price, monthly cash flow is $758 ($9k/yr) — positive.
- The deal already cash-flows at list — no discount required.
- Meets the 1% rule at list price ($2k rent vs $110k).
- Cap rate 14.6% vs local median 5.6% in Pocomoke City — top-decile yield for the area; either an underpriced asset or a hidden risk that comps aren't pricing in. Stress-test before assuming the spread holds.
Location & tenants
- Location reads 71/100 on livability (#157 in MD) — a middle-class / working-renter tenant base. Strengths: cost of living A+, health & safety A+, housing A-; Watch: employment D+, crime F, amenities F.
- Worcester County Public Schools (town): math 30% / reading 44% proficiency, ranked #6 of 24 in MD (top 25%) — families likely to look elsewhere, expect single-tenant / working-renter base with shorter leases.
- Market conditions: 69 active listings in the ZIP; 7 comparable units currently listed for rent nearby; rentals at typical pace (median 15d on market — plan ~3-4 weeks tenant-placement turnaround); 354 units permitted in Worcester County in 2024 (6 in 5+ unit buildings).
Forward outlook
- Local home prices are declining (-3.0%/yr); year-one equity from $760 of loan paydown is wiped out by about $3k of value loss. Plan a longer hold.
- Worcester County population projected to shrink 4% by 2050 — rents likely to lag national; underwrite the cash flow, not the appreciation.
- At projected returns (-3.0% appreciation + 3.0% rent growth), your $31k cash investment doubles in ~5 years — after that, you're playing with house money.
Negotiation context
- Only 1 days on market — expect competitive offers; lowballing is unlikely to land.
Risks & watch-outs
- Watch-outs: built in 1930 — expect roof / HVAC / electrical / plumbing capex.
Questions for the listing agent
- Built in 1930 — when were the roof, HVAC, electrical panel, plumbing, and water heater last replaced?
- Is there a deadline driving the sale (1031 exchange, divorce, estate, relocation)? That informs how much negotiation room exists.
- Crime grade is F in this area — have there been break-ins, vandalism, or insurance claims at this property in the last 3 years? What carrier currently insures it and at what premium?
- What's the average days-on-market for RENTAL listings here right now (not sales)? A rising rental-DOM trend means longer vacancies and softer asking-rent achievability than the comps imply.
- What's the recent tenant-quality profile in this submarket — average credit score on applications, eviction rate, late-payment / NSF rate, and stable-employment percentage? A property-management company in the area should have these aggregated.
- How much new for-sale + rental construction is in the pipeline within 1–3 miles? Heavy new supply typically softens prices + rents 12–24 months out; constrained supply supports both.
Investment metrics
- 1% rule
- 1.75% ✓
- Cap rate
- 14.57%
- Cash-on-cash
- 29.57%
- DSCR
- 2.32
- GRM
- 4.8
CMA / ARV
- ARV (on-the-fly)
- $252,450
- Comps found
- 12
Show comp detail 12 sales within ~0.75 mi
| Address | Dist | Beds/Ba | Sqft | Sold | Price | $/sf | Match |
|---|---|---|---|---|---|---|---|
| 621 Cedar St | 0.16mi | 3/2.5 | 1,350 (0%) | 6mo | $220,000 | $163 | 82 |
| 1403 Linden Dr | 0.54mi | 3/2.0 | 1,312 (-3%) | 5mo | $175,000 | $133 | 62 |
| 1298 Dorchester Ave | 0.40mi | 3/2.0 | 1,420 (+5%) | 8mo | $283,000 | $199 | 62 |
| 1411 Cedar Run | 0.60mi | 3/2.5 | 1,331 (-1%) | 4mo | $280,000 | $210 | 61 |
| 1410 Cedar Run | 0.61mi | 3/2.0 | 1,311 (-3%) | 3mo | $289,900 | $221 | 60 |
| 427 Bank St | 0.35mi | 2/1.0 (-1) | 1,260 (-7%) | 10mo | $150,000 | $119 | 59 |
| 401 4th St | 0.37mi | 3/1.5 | 1,495 (+11%) | 8mo | $190,000 | $127 | 57 |
| 1296 Dorchester Ave | 0.38mi | 3/2.0 | 1,506 (+12%) | 8mo | $282,100 | $187 | 52 |
| 710 2nd St | 0.52mi | 3/2.0 | 1,232 (-9%) | 6mo | $220,000 | $179 | 52 |
| 1406 Cedar Run | 0.58mi | 3/2.5 | 1,475 (+9%) | 1mo | $289,900 | $197 | 50 |
| 1401 Cedar Run | 0.54mi | 3/2.5 | 1,475 (+9%) | 5mo | $289,900 | $197 | 49 |
| 8 14th St | 0.55mi | 3/2.0 | 1,170 (-13%) | 5mo | $213,090 | $182 | 44 |
Match score weights: distance 35% · size 25% · config 20% · recency 20%. Top-matched comps best support the ARV.
Projected returns pro-forma
-3.0% appreciation · 3.0% rent growth · sell at horizon
- IRR
- 24.1%
- Equity multiple
- 1.99×
- Total profit
- $30,511
- Equity at exit
- $16,386
- IRR
- 31.9%
- Equity multiple
- 3.89×
- Total profit
- $88,867
- Equity at exit
- $9,502
Cash invested: $30,772 (down + closing). Projections, not guarantees.
Landlord ↔ Tenant lean methodology
- Overall (STATE)
- 27 Tenant-Leaning
- State Maryland
- 27 Tenant-Leaning · D+14
- County
- — inherits STATE
- City
- — inherits STATE
ZIP-level market 21851
- Home prices YoY
- -4.0%
- Active inventory
- 69
- Price-to-rent
- 4.8×
Monthly cashflow live
- Estimated rent
- $1,921 high interval (Pro) →
- Mortgage (P&I)
- −$576
- Tax est. 1.5%
- −$137 /mo · $1,648/yr
- Insurance
- −$46
- HOA
- −$0
- Vacancy / Maint / Mgmt
- −$403
- Net cashflow
- $758
Break-even live
Sensitivity live
| Price | -10% $834 | -5% $796 | +0% $758 | +5% $720 | +10% $682 |
|---|---|---|---|---|---|
| Rent | -10% $606 | -5% $682 | +0% $758 | +5% $834 | +10% $910 |
| Rate | -1.0pp $814 | -0.5pp $786 | base $758 | +0.5pp $730 | +1.0pp $701 |
UW: 25.0% down · 7.5% · 30yr · 1.5% tax · 5.0% vac · 8.0% maint · 8.0% mgmt
Financing live
Cash to close
- Down payment
- $27,475
- Closing costs
- $3,297
- Reserves months
- —
- Total cash needed
- —
Loan-product check · same deal, 3 products live
Conventional
25% down · 7.5% · 30yr
- Down + closing
- —
- Monthly P&I
- —
- Monthly cashflow
- —
- DSCR
- —
- Eligible?
- —
Personal DTI + credit; lowest rate.
DSCR
20% down · 8.5% · 30yr
- Down + closing
- —
- Monthly P&I
- —
- Monthly cashflow
- —
- DSCR
- —
- Eligible?
- —
No personal income docs; deal must DSCR.
Hard money
10% down · 12.0% · 12mo
- Down + closing
- —
- Monthly P&I
- —
- Monthly cashflow
- —
- DSCR
- —
- Eligible?
- —
Short-term bridge; refi at stabilization.
Rent comps 7 comps
| Address | Beds | Baths | Sqft | Rent | $/sqft | DOM | Units | Dist |
|---|---|---|---|---|---|---|---|---|
| 621 Cedar St Pocomoke City, MD | 3.0 | 2.5 | 1352 | $2,195 | $1.62 | 14d | 1 | 0.17mi |
| 242 Morgans Ct Pocomoke City, MD | 3.0 | 2.5 | 1304 | $1,795 | $1.38 | 14d | 1 | 0.26mi |
| 241 Morgans Ct Pocomoke City, MD | 3.0 | 2.5 | 1304 | $1,795 | $1.38 | 14d | 1 | 0.26mi |
| 202 Carsons Ct Pocomoke City, MD | 3.0 | 2.0 | 1472 | $1,695 | $1.15 | 14d | 1 | 0.31mi |
| 1513 Princess Anne Ln Pocomoke City, MD | 3.0 | 2.0 | 1542 | $1,950 | $1.26 | 44d | 1 | 0.68mi |
| 2005 S Old Mill Dr Pocomoke City, MD | 3.0 | 2.0 | 1373 | $1,895 | $1.38 | 14d | 1 | 1.22mi |
| 2007 S Old Mill Dr Pocomoke City, MD | 3.0 | 2.0 | 1302 | $1,895 | $1.46 | 14d | 1 | 1.23mi |
Listing history 2 events
-
2026-06-18remarks 506-char remark
-
2026-06-18$109,900 Active 1 DOM
ⓘ Source: listings_history table (triggers on properties + properties_extension) + one-shot
backfill from property_details.listing_events for pre-trigger history.
Nearby sold comps map
Loading sold comps map…
Walkable amenities ~0.75 mi
Loading nearby amenities…
Taxation est. · year 1
- Rental income
- $23,054
- − Mortgage interest
- −$6,156
- − Property taxes
- −$1,648
- − Insurance
- −$550
- − Repairs & maintenance
- −$1,844
- − Management
- −$1,844
- − Depreciation
- −$3,197
- Taxable income
- $7,814
- Est. tax owed @ 24.0%
- −$1,875
- After-tax cash flow
- $7,223/yr
For passive investors: Depreciation is non-cash, so a rental often shows a tax loss while cash-flowing — sheltering income. Rental losses are passive: they offset passive income freely, and up to $25,000/yr can offset ordinary (W-2) income if you actively participate and your MAGI is under $100k (phasing out to $0 by $150k); unused losses carry forward. On sale, claimed depreciation is recaptured at up to 25%, and gains may owe capital-gains tax (a 1031 exchange can defer both). Figures are a year-1 estimate at your 24.0% rate — not tax advice; consult a CPA.
Schools (NCES district)
- District
- Worcester County Public Schools
- NCES district ID
- 2400720
- Math proficiency
- 30% ▼ -25.00%
- Reading proficiency
- 44% ▼ -20.00%
- Median HH income
- $56,748
- Composite
- 32.6/100
- National rank
- #5672
- State rank
- #6 of 24 in MD
Livability — Pocomoke City
- Score
- 71/100
- State rank
- #157
- US rank
- #7066
Category grades
Schools grade is shown separately in the Schools card above.
Census & demographics
- Census place
- Pocomoke City, MD
- Population (ZIP)
- 7,252
Population outlook (Worcester County) Hauer SSP2
- Today (2025)
- 51,363 people
- By 2030
- 51,191 · -0.3%
- By 2040
- 50,459 · -1.8%
- By 2050
- 49,451 · -3.7%
- By 2075
- 48,533 · -5.5%
- By 2100
- 44,223 · -13.9%
Race, ethnicity, and origin ACS 2023
- Neighborhood character
- Diverse neighborhood (Simpson 0.58)
- Race & ethnicity
- White 54% Black 37% Two or more races 5% Asian 2% Hispanic / Latino 2%
- Common ancestry
- Scandinavian 2% Romanian 2% Scotch-Irish 2%
- Foreign-born
- 5% · Canada, Dominican Republic, Mexico
- Languages at home
- 93% English-only · Other Asian/Pacific 1% Spanish 1% Vietnamese 1%
Political lean MEDSL · Worcester
- 2024 margin
- Strong R (+22.0) · D 38.0% · R 60.0% · Other 2.0%
- 2008→2024 swing
- -6.5pp toward R · 2008: -15.5pp · 2024: -22.0pp
- All cycles
- 2024: R+22.0 2020: R+19.0 2016: R+27.9 2012: R+18.3 2008: R+15.5
Not yet ingested
- Civics
- —
Market trends
- HPI YoY
- ▼ -10.03%
- Current HPI
- 243.2329
- Rent YoY
- —
- Metro
- —
- State GDP YoY
- ▲ 2.97%
- F500 in state
- 12
Industry mix (Fortune 500 HQ in MD)
| Industry | F500 HQs | Revenue |
|---|---|---|
| Aerospace / Defense | 1 | $71B |
|
||
| Utilities | 1 | $25B |
|
||
| Hotels | 1 | $24B |
|
||
| Consumer Goods | 1 | $7B |
|
||
| Real Estate | 1 | $6B |
|
||
| Chemicals | 1 | $2B |
|
||
Cash-flow waterfall
monthlySold comps — $/sqft
last 12 mo · ≤1 miLoading sold comps…