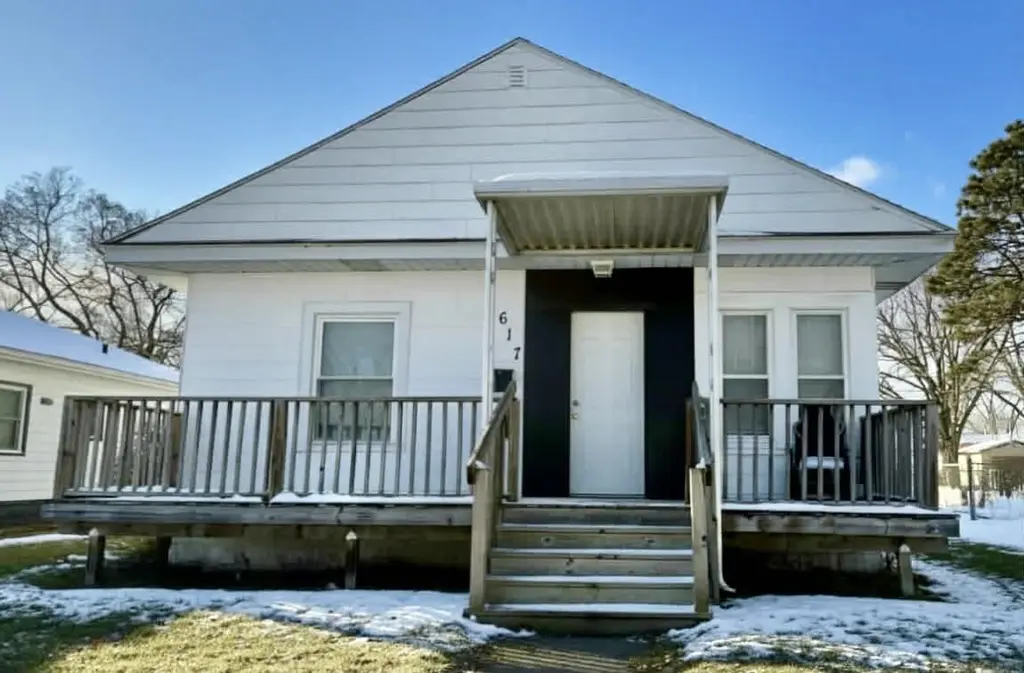
617 Boston Ave · Waterloo, IA
Flood risk 1/10 · Minimal
- FEMA flood zone
- X (unshaded)
- Chance of flooding over 30 yrs
- 0.0%
- Est. flood insurance / yr
- $473 – $860
Fire risk 2/10 · Minimal
- Est. fire insurance / yr
- $902 – $1,676
Heat risk 3/10 · Minor
- Hot days now (above 101°F)
- 7 days/yr
- Hot days in 30 yrs
- 16 days/yr
Wind risk 2/10 · Minimal
- Chance of severe wind over 30 yrs
- —
Air-quality risk 1/10 · Minimal
- Unhealthy air days now
- 0 days/yr
- Unhealthy air days in 30 yrs
- 0 days/yr
Risk factors via First Street. Map © Google.
Why this score? — see what drove the B+ grade
The composite is a weighted blend of 9 inputs, each scored 0–100. Each bar is that input's sub-score; the figure is the points it added to the 100-point composite (weight × sub-score).
- Cash flow +29.4/30.0
- ARV discount +15.0/15.0
- DSCR +10.0/10.0
- 1% rule +8.0/10.0
- Schools +4.4/10.0
- Rent growth +4.2/5.0
- Livability +4.0/5.0
- Condition / age +2.5/5.0
- Appreciation +0.0/10.0
$64,900
🖨 Deal sheet 📄 Offer letter ✓ Due diligence
Listing remarks MLS
Rented till July 2026. Updated floors.
Key facts
- 6,500 sq ft lot
- Parking
- Built 1919
Neighborhood map
What this means for you Summary
Snapshot
- This is a 2-bed/1.0-bath single-family listed at $65k.
Deal economics
- At list price, monthly cash flow is $230 ($3k/yr) — positive.
- The deal already cash-flows at list — no discount required.
- Meets the 1% rule at list price ($845 rent vs $65k).
- Recommended offer: $57k (12.0% below list) — sets the bar for market timing.
- Cap rate 10.6% vs local median 4.2% in Waterloo — top-decile yield for the area; either an underpriced asset or a hidden risk that comps aren't pricing in. Stress-test before assuming the spread holds.
Location & tenants
- Location reads 81/100 on livability (#74 in IA, #1,589 nationally) — a professional / high-income tenant draw. Strengths: commute A+, cost of living A+, housing A+; Watch: schools C-, crime F, employment D-.
- Waterloo Community School District (urban): math 50% / reading 54% proficiency, ranked #276 of 289 in IA (top 96%) — acceptable for families but not a draw, mixed tenant base, ~2y average lease.
- Market conditions: Rents rising fast (+6.7%/yr); 98 active listings in the ZIP; 17 comparable units currently listed for rent nearby; rentals lingering (median 44d on market — plan ~5-8 weeks vacancy on turnover, expect pricing pressure); 76% of comp listings sitting > 30 days — soft ceiling on asking rent; 287 units permitted in Black Hawk County in 2024 (67 in 5+ unit buildings).
Forward outlook
- Local home prices are declining (-3.0%/yr); year-one equity from $449 of loan paydown is wiped out by about $2k of value loss. Plan a longer hold.
- Black Hawk County population projected at +10% by 2050 — modest demand growth; plan on rents tracking national, not racing it.
- At projected returns (-3.0% appreciation + 6.7% rent growth), your $18k cash investment doubles in ~7 years — after that, you're playing with house money.
Negotiation context
- It's been on market 165 days — a 12% lower offer ($57k) is reasonable based on typical stale-listing flexibility.
- 2 sale attempts since 8y ago; this cycle's ask has dropped $5k (7%) from the opening price — seller is motivated, your offer sets the floor, not the list.
- Current owner paid $45k; 44% above their basis — modest negotiation headroom, anchor on the comps not their cost.
Risks & watch-outs
- Watch-outs: built in 1919 — expect roof / HVAC / electrical / plumbing capex.
Questions for the listing agent
- It's been on market 165 days. Have you received any prior offers? Is the seller open to a 12% concession, seller financing, or rate buy-down credit?
- Built in 1919 — when were the roof, HVAC, electrical panel, plumbing, and water heater last replaced?
- Why hasn't it sold? Are there any deal-killer items the seller is aware of (foundation, flood, title, zoning, code violations)?
- Is there a deadline driving the sale (1031 exchange, divorce, estate, relocation)? That informs how much negotiation room exists.
- Crime grade is F in this area — have there been break-ins, vandalism, or insurance claims at this property in the last 3 years? What carrier currently insures it and at what premium?
- What's the average days-on-market for RENTAL listings here right now (not sales)? A rising rental-DOM trend means longer vacancies and softer asking-rent achievability than the comps imply.
- What's the recent tenant-quality profile in this submarket — average credit score on applications, eviction rate, late-payment / NSF rate, and stable-employment percentage? A property-management company in the area should have these aggregated.
- How much new for-sale + rental construction is in the pipeline within 1–3 miles? Heavy new supply typically softens prices + rents 12–24 months out; constrained supply supports both.
Investment metrics
- 1% rule
- 1.30% ✓
- Cap rate
- 10.55%
- Cash-on-cash
- 15.21%
- DSCR
- 1.68
- GRM
- 6.4
CMA / ARV
- ARV (median comp)
- $87,771
- List price
- $64,900
- Delta
- -26.06%
- Verdict
- UNDERPRICED
- Comps
- 20 within 1.0 mi
Show comp detail 12 sales within ~0.75 mi
| Address | Dist | Beds/Ba | Sqft | Sold | Price | $/sf | Match |
|---|---|---|---|---|---|---|---|
| 537 Mildred Ave | 0.20mi | 2/1.0 | 876 (+1%) | 9mo | $90,000 | $103 | 81 |
| 543 Mildred Ave | 0.21mi | 3/1.0 (+1) | 864 (0%) | 9mo | $90,000 | $104 | 78 |
| 2421 E 4th St | 0.25mi | 2/2.0 | 908 (+5%) | 3mo | $61,000 | $67 | 73 |
| 211 Boston Ave Ave | 0.39mi | 3/1.0 (+1) | 932 (+8%) | 2mo | $90,100 | $97 | 62 |
| 1036 Columbia St | 0.70mi | 2/1.0 | 848 (-2%) | 4mo | $60,000 | $71 | 61 |
| 4027 Niles St St | 0.48mi | 3/1.0 (+1) | 912 (+6%) | 3mo | $147,900 | $162 | 61 |
| 4009 Homer St | 0.42mi | 3/1.0 (+1) | 928 (+7%) | 6mo | $68,000 | $73 | 58 |
| 330 Cutler St | 0.61mi | 2/1.0 | 816 (-6%) | 11mo | $45,000 | $55 | 53 |
| 1120 N Barclay St | 0.69mi | 2/1.0 | 808 (-6%) | 9mo | $89,000 | $110 | 50 |
| 1622 Columbia St | 0.43mi | 3/1.0 (+1) | 988 (+14%) | 6mo | $127,500 | $129 | 46 |
| 319 Oliver St St | 0.59mi | 3/1.0 (+1) | 964 (+12%) | 3mo | $55,000 | $57 | 45 |
| 926 Lincoln St | 0.75mi | 1/1.0 (-1) | 956 (+11%) | 8mo | $39,000 | $41 | 36 |
Match score weights: distance 35% · size 25% · config 20% · recency 20%. Top-matched comps best support the ARV.
Projected returns pro-forma
-3.0% appreciation · 6.67% rent growth · sell at horizon
- IRR
- 9.9%
- Equity multiple
- 1.41×
- Total profit
- $7,389
- Equity at exit
- $9,677
- IRR
- 21.8%
- Equity multiple
- 3.18×
- Total profit
- $39,659
- Equity at exit
- $5,611
Cash invested: $18,172 (down + closing). Projections, not guarantees.
Landlord ↔ Tenant lean methodology
- Overall (STATE)
- 83 Strongly Landlord-Friendly
- State Iowa
- 83 Strongly Landlord-Friendly · R+6
- County
- — inherits STATE
- City
- — inherits STATE
ZIP-level market 50703
- Rents YoY
- 6.7%
- Active inventory
- 98
- Price-to-rent
- 6.4×
Monthly cashflow live
- Estimated rent
- $845 high interval (Pro) →
- Mortgage (P&I)
- −$340
- Tax from tax record
- −$70 /mo · $838/yr
- Insurance
- −$27
- HOA
- −$0
- Vacancy / Maint / Mgmt
- −$177
- Net cashflow
- $230
Break-even live
UW: 25.0% down · 7.5% · 30yr · 1.5% tax · 5.0% vac · 8.0% maint · 8.0% mgmt
Financing live
Cash to close
- Down payment
- $16,225
- Closing costs
- $1,947
- Reserves months
- —
- Total cash needed
- —
Loan-product check · same deal, 3 products live
Conventional
25% down · 7.5% · 30yr
- Down + closing
- —
- Monthly P&I
- —
- Monthly cashflow
- —
- DSCR
- —
- Eligible?
- —
Personal DTI + credit; lowest rate.
DSCR
20% down · 8.5% · 30yr
- Down + closing
- —
- Monthly P&I
- —
- Monthly cashflow
- —
- DSCR
- —
- Eligible?
- —
No personal income docs; deal must DSCR.
Hard money
10% down · 12.0% · 12mo
- Down + closing
- —
- Monthly P&I
- —
- Monthly cashflow
- —
- DSCR
- —
- Eligible?
- —
Short-term bridge; refi at stabilization.
Rent comps 17 comps
| Address | Beds | Baths | Sqft | Rent | $/sqft | DOM | Units | Dist |
|---|---|---|---|---|---|---|---|---|
| 613 Hope Ave Waterloo, IA | 2.0 | 1.0 | 812 | $795 | $0.98 | 43d | 1 | 0.14mi |
| 739 Sherman Ave Waterloo, IA | 3.0 | 1.0 | 875 | $925 | $1.06 | 43d | 1 | 0.21mi |
| 322 Lester St Waterloo, IA | 2.0 | 1.0 | 672 | $850 | $1.26 | 43d | 1 | 0.46mi |
| 306 Charles St Waterloo, IA | 3.0 | 1.0 | 916 | $925 | $1.01 | 43d | 1 | 0.51mi |
| 405 W Donald St Waterloo, IA | 2.0–3.0 | 1.0 | 880 | $900 | $1.02 | 21d | 4 | 0.54mi |
| 1148 Columbia St Waterloo, IA | 2.0 | 1.0 | 816 | $850 | $1.04 | 43d | 1 | 0.60mi |
| 1137 Columbia St Waterloo, IA | 1.0 | 1.0 | 588 | $725 | $1.23 | 21d | 1 | 0.63mi |
| 515 Stokes Dr Waterloo, IA | 1.0 | 1.0 | 664 | $675 | $1.02 | 43d | 1 | 0.65mi |
| 1132 Ackermant St Waterloo, IA | 2.0 | 1.0 | 685 | $825 | $1.20 | 43d | 1 | 0.66mi |
| 307 Riehl St Waterloo, IA | 2.0 | 1.0 | 640 | $825 | $1.29 | 21d | 1 | 0.86mi |
| 314 Conger St Waterloo, IA | 2.0 | 1.0 | 840 | $875 | $1.04 | 43d | 1 | 0.90mi |
| 657 Dawson St Waterloo, IA | 2.0 | 1.0 | 692 | $810 | $1.17 | 43d | 1 | 1.07mi |
| 661 Dawson St Waterloo, IA | 2.0 | 1.0 | 704 | $895 | $1.27 | 21d | 1 | 1.08mi |
| 118 Harrison St Waterloo, IA | 2.0 | 1.0 | 600 | $500 | $0.83 | 43d | 1 | 1.19mi |
| 401 Argyle St Waterloo, IA | 2.0 | 1.0 | 800 | $800 | $1.00 | 43d | 1 | 1.25mi |
| 716 Beech St Waterloo, IA | 2.0 | 1.0 | 672 | $875 | $1.30 | 43d | 1 | 1.38mi |
| 303 Franklin St Apt 2 Waterloo, IA | 2.0 | 1.0 | 600 | $650 | $1.08 | 43d | 1 | 1.47mi |
Listing history 5 events
-
2026-05-18status Pending 38-char remark
Show marketing remark (38 chars)
Rented till July 2026. Updated floors.
-
2026-01-02price $64,900 38-char remark
Show marketing remark (38 chars)
Rented till July 2026. Updated floors.
-
2025-12-04$69,999 Active 38-char remark
Show marketing remark (38 chars)
Rented till July 2026. Updated floors.
-
2018-04-02soldstatus $45,000 180-char remark
Show marketing remark (180 chars)
Nicely updated 2 bedroom home in quiet neighborhood. Many recent updates including new kitchen, new front porch, and hardwood floors. Ideal for owner occupant or a rental property.
-
2018-01-30$49,000 180-char remark
Show marketing remark (180 chars)
Nicely updated 2 bedroom home in quiet neighborhood. Many recent updates including new kitchen, new front porch, and hardwood floors. Ideal for owner occupant or a rental property.
ⓘ Source: listings_history table (triggers on properties + properties_extension) + one-shot
backfill from property_details.listing_events for pre-trigger history.
Tax reassessment forecast IA · Partial reset (capped growth)
- Current annual tax
- $838 · $70/mo
- Projected year-2 tax
- $928 · $77/mo
- Expected delta
- +$90/yr (+$8/mo · 10.8%)
ⓘ Screening estimate from a state-policy table — verify with the county assessor before closing.
Climate risk First Street
- Flood 1/10 Low FEMA zone X (unshaded) · 0% chance over 30 yrs
- Wildfire 2/10 Low
- Heat 3/10 Moderate 7 d/yr ≥101°F today · 16 d/yr by 30 yrs out
- Wind 2/10 Low
- Air quality 1/10 Low 0 unhealthy d/yr today · 0 by 30 yrs out
Nearby sold comps map
Loading sold comps map…
Walkable amenities ~0.75 mi
Loading nearby amenities…
Taxation est. · year 1
- Rental income
- $10,139
- − Mortgage interest
- −$3,635
- − Property taxes
- −$838
- − Insurance
- −$324
- − Repairs & maintenance
- −$811
- − Management
- −$811
- − Depreciation
- −$1,888
- Taxable income
- $1,831
- Est. tax owed @ 24.0%
- −$439
- After-tax cash flow
- $2,324/yr
For passive investors: Depreciation is non-cash, so a rental often shows a tax loss while cash-flowing — sheltering income. Rental losses are passive: they offset passive income freely, and up to $25,000/yr can offset ordinary (W-2) income if you actively participate and your MAGI is under $100k (phasing out to $0 by $150k); unused losses carry forward. On sale, claimed depreciation is recaptured at up to 25%, and gains may owe capital-gains tax (a 1031 exchange can defer both). Figures are a year-1 estimate at your 24.0% rate — not tax advice; consult a CPA.
Schools (NCES district)
- District
- Waterloo Community School District
- NCES district ID
- 1930480
- Math proficiency
- 50% ▼ -4.00%
- Reading proficiency
- 54% ▲ 1.00%
- Median HH income
- $42,545
- Composite
- 43.72/100
- National rank
- #2950
- State rank
- #276 of 289 in IA
Livability — Waterloo
- Score
- 81/100
- State rank
- #74
- US rank
- #1589
Category grades
Schools grade is shown separately in the Schools card above.
Census & demographics
- Census place
- Waterloo, IA
- County
- Black Hawk County · 112,933 people
- City population
- 69,066
- Metro
- Waterloo-Cedar Falls, IA
- Population (ZIP)
- 17,952
- Household income
- $50,060
- Rent vs Own
- Severe rent burden
- 871.0
Population outlook (Black Hawk County) Hauer SSP2
- Today (2025)
- 139,716 people
- By 2030
- 142,853 · +2.2%
- By 2040
- 147,843 · +5.8%
- By 2050
- 153,247 · +9.7%
- By 2075
- 167,977 · +20.2%
- By 2100
- 177,320 · +26.9%
Race, ethnicity, and origin ACS 2023
- Neighborhood character
- Diverse neighborhood (Simpson 0.62)
- Race & ethnicity
- White 55% Black 26% Hispanic / Latino 10% Two or more races 7% Asian 2%
- Hispanic origin (detail)
- Mexican 6%
- Common ancestry
- Iranian 1% Portuguese 1% Lithuanian 1%
- Foreign-born
- 7% · Canada, Philippines, China
- Languages at home
- 89% English-only · Spanish 7% Other Asian/Pacific 2% Russian/Polish/Slavic 1%
Political lean MEDSL · Black Hawk
- 2024 margin
- Toss-up / Even · D 50.0% · R 48.8% · Other 1.2%
- 2008→2024 swing
- -21.3pp toward R · 2008: 22.4pp · 2024: 1.2pp
- All cycles
- 2024: D+1.2 2020: D+9.0 2016: D+7.3 2012: D+20.0 2008: D+22.4
Not yet ingested
- Civics
- —
Market trends
- HPI YoY
- ▼ -117.18%
- Current HPI
- 132.9478
- Rent YoY
- ▲ 6.67%
- Metro
- Waterloo-Cedar Falls, IA
- State GDP YoY
- ▲ 2.48%
- F500 in state
- 4
Industry mix (Fortune 500 HQ in IA)
| Industry | F500 HQs | Revenue |
|---|---|---|
| Financial Services | 1 | $16B |
|
||
| Retail / Convenience | 1 | $15B |
|
||
Price history
+32.4% since first listed5 events — show timeline
- 2026-05-18 Pending — NEIRBR as distributed by MLS GRID
- 2026-01-02 Price Changed $64,900 NEIRBR as distributed by MLS GRID
- 2025-12-04 Listed $69,999 NEIRBR as distributed by MLS GRID
- 2018-04-02 Sold (MLS) $45,000 NEIRBR as distributed by MLS GRID
- 2018-01-30 Listed $49,000 NEIRBR as distributed by MLS GRID
Property tax history
+0.0%/yrLatest (2025): $838 · +8.5% YoY. Source: county tax records.
Cash-flow waterfall
monthlySold comps — $/sqft
last 12 mo · ≤1 miLoading sold comps…