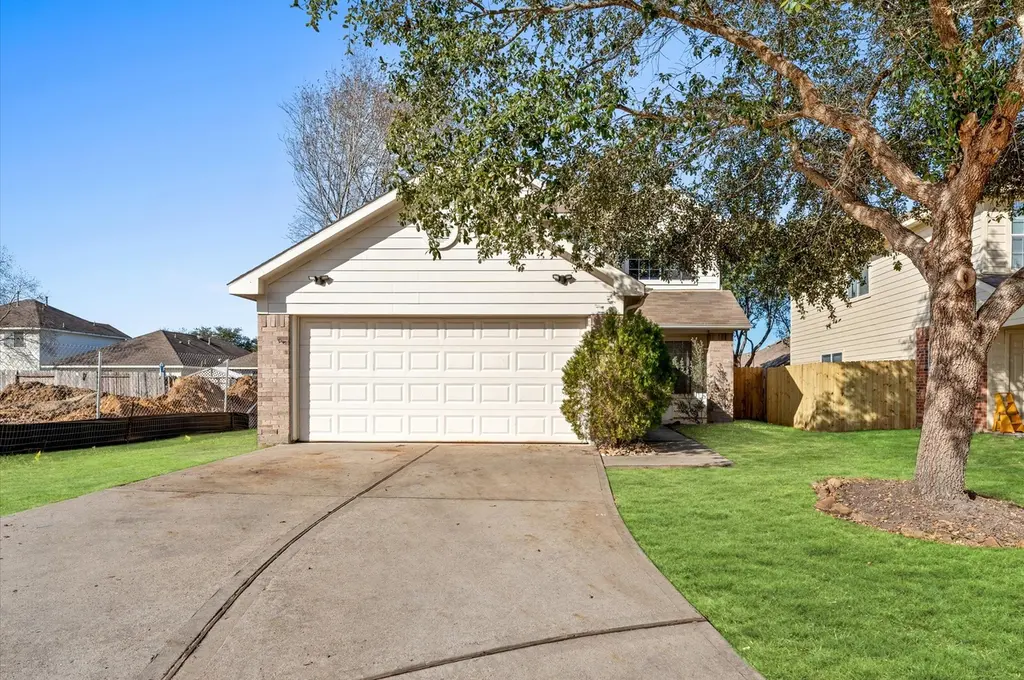
7218 Cool Springs Ct · The Woodlands, TX
Flood risk 1/10 · Minimal
- FEMA flood zone
- X (unshaded)
- Chance of flooding over 30 yrs
- 0.0%
- Est. flood insurance / yr
- $507 – $1,088
Fire risk 4/10 · Minor
- Est. fire insurance / yr
- $1,222 – $2,270
Heat risk 9/10 · Severe
- Hot days now (above 111°F)
- 7 days/yr
- Hot days in 30 yrs
- 24 days/yr
Wind risk 8/10 · Major
- Chance of severe wind over 30 yrs
- 99.0%
Air-quality risk 2/10 · Minimal
- Unhealthy air days now
- 2 days/yr
- Unhealthy air days in 30 yrs
- 2 days/yr
Risk factors via First Street. Map © Google.
Why this score? — see what drove the C- grade
The composite is a weighted blend of 9 inputs, each scored 0–100. Each bar is that input's sub-score; the figure is the points it added to the 100-point composite (weight × sub-score).
- Cash flow +12.3/30.0
- Appreciation +10.0/10.0
- ARV discount +7.1/15.0
- Livability +4.5/5.0
- Schools +3.9/10.0
- 1% rule +3.8/10.0
- DSCR +3.7/10.0
- Rent growth +2.6/5.0
- Condition / age +2.5/5.0
$265,000
🖨 Deal sheet 📄 Offer letter ✓ Due diligence
Listing remarks MLS
Move in Ready. Welcome to 7218 Cool Springs, a beautiful and immaculate 2-story home located in the desirable Forest Crossing community. Nestled in a quiet cul-de-sac, this home offers both privacy and convenience. With 4 bedrooms and 2 1/2 bathrooms, there is plenty of space for the whole family. The primary bedroom is located downstairs, providing a peaceful retreat. The spacious game room upstairs is perfect for entertaining or relaxation. The lovely laminate floors downstairs add a touch of elegance. This home is also conveniently located just minutes away from great shopping, a variety of restaurants, and a movie theater. Don't miss the opportunity to make this your dream home.
Key facts
- Laminate floors
- Move in ready
- Cul-de-sac
Tags
Neighborhood map
What this means for you Summary
Snapshot
- This is a 4-bed/2.5-bath single-family listed at $265k.
Deal economics
- At list price, monthly cash flow is $-48 ($-579/yr) — negative.
- To cash-flow at today's rent, offer at most $256k (3.2% below list).
- To meet the 1% rule (rent ≥ 1% of price), the offer needs to be $234k (11.6% below list).
- Recommended offer: $233k (12.0% below list) — sets the bar for market timing.
- Cap rate 6.1% vs local median 2.3% in The Woodlands — top-decile yield for the area; either an underpriced asset or a hidden risk that comps aren't pricing in. Stress-test before assuming the spread holds.
Location & tenants
- Location reads 91/100 on livability (#1 in TX, #47 nationally) — a professional / high-income tenant draw. Strengths: schools A+, amenities A+, commute A+; Watch: cost of living D-.
- Magnolia ISD (rural): math 42% / reading 45% proficiency, ranked #247 of 826 in TX (top 30%) — families likely to look elsewhere, expect single-tenant / working-renter base with shorter leases.
- Market conditions: Rents flat; 1604 active listings in the ZIP; 13 comparable units currently listed for rent nearby; rentals leasing fast (median 5d on market — plan ~1-2 weeks tenant-placement turnaround); high-income renter base; 13,259 units permitted in Montgomery County in 2024 (1,402 in 5+ unit buildings).
Forward outlook
- In year one you build about $28k of equity ($2k loan paydown + $26k appreciation (10.0% local appreciation)).
- Montgomery County population projected at +65% by 2050 — long-run rental-demand tailwind backs the buy-and-hold thesis.
- At projected returns (10.0% appreciation + 0.3% rent growth), your $74k cash investment doubles in ~3 years — after that, you're playing with house money.
- By year 2, paydown + projected appreciation supports a ~$46k cash-out refi (75% LTV) — recoverable capital for the next deal without selling this one.
Negotiation context
- It's been on market 127 days — a 12% lower offer ($233k) is reasonable based on typical stale-listing flexibility.
- 8 sale attempts since 10y ago; this cycle's ask is 12519% above the opening price — seller raised mid-cycle; expect resistance to lowballs.
Risks & watch-outs
- Climate carrying-cost: severe wind risk, 99% chance of damaging wind over 30y; extreme-heat days projected 7→24/yr by 2055 (HVAC capex compounding) — expect insurance premiums to compound above CPI over the hold.
Questions for the listing agent
- What do current leases actually rent for vs. the listed asking? Can we see a recent rent roll and the last 12 months of T-12 income?
- It's been on market 127 days. Have you received any prior offers? Is the seller open to a 12% concession, seller financing, or rate buy-down credit?
- What does the HOA fee cover, when was the last increase, and are there any pending special assessments or reserve-fund shortfalls?
- Why hasn't it sold? Are there any deal-killer items the seller is aware of (foundation, flood, title, zoning, code violations)?
- Is there a deadline driving the sale (1031 exchange, divorce, estate, relocation)? That informs how much negotiation room exists.
- Schools are A-rated — typically a magnet for longer-tenancy family renters. What's the average tenant stay here, and is there a school-zone premium baked into asking?
- What's the average days-on-market for RENTAL listings here right now (not sales)? A rising rental-DOM trend means longer vacancies and softer asking-rent achievability than the comps imply.
- What's the recent tenant-quality profile in this submarket — average credit score on applications, eviction rate, late-payment / NSF rate, and stable-employment percentage? A property-management company in the area should have these aggregated.
- How much new for-sale + rental construction is in the pipeline within 1–3 miles? Heavy new supply typically softens prices + rents 12–24 months out; constrained supply supports both.
Investment metrics
- 1% rule
- 0.88% ✗
- Cap rate
- 6.07%
- Cash-on-cash
- -0.78%
- DSCR
- 0.97
- GRM
- 9.4
CMA / ARV
- ARV (median comp)
- $262,793
- List price
- $265,000
- Delta
- 0.84%
- Verdict
- FAIR
- Comps
- 20 within 1.0 mi
Show comp detail 12 sales within ~0.75 mi
| Address | Dist | Beds/Ba | Sqft | Sold | Price | $/sf | Match |
|---|---|---|---|---|---|---|---|
| 33127 Cottonwood Bnd | 0.17mi | 4/2.5 | 1,834 (0%) | 1mo | $225,000 | $123 | 91 |
| 723 Hinsdale | 0.38mi | 4/2.0 | 1,841 (+0%) | 3mo | $299,000 | $162 | 78 |
| 7127 Hayden Dr | 0.53mi | 4/2.5 | 1,869 (+2%) | 4mo | $315,000 | $169 | 69 |
| 6806 Woodland Oaks | 0.35mi | 4/2.0 | 2,005 (+9%) | 0mo | $325,000 | $162 | 66 |
| 6846 Durango Creek Dr | 0.37mi | 3/2.0 (-1) | 1,910 (+4%) | 3mo | $285,000 | $149 | 66 |
| 7407 Nickaburr Creek Dr | 0.63mi | 4/2.5 | 1,874 (+2%) | 4mo | $399,000 | $213 | 64 |
| 7022 Dillon Dr | 0.67mi | 4/2.0 | 1,867 (+2%) | 4mo | $300,000 | $161 | 61 |
| 7402 Nickaburr Creek Dr | 0.58mi | 3/2.0 (-1) | 1,824 (-0%) | 6mo | $339,999 | $186 | 60 |
| 6622 Dillon Dr | 0.72mi | 3/3.0 (-1) | 1,896 (+3%) | 0mo | $318,000 | $168 | 54 |
| 6711 Durango Creek Dr | 0.56mi | 3/2.0 (-1) | 1,654 (-10%) | 1mo | $268,000 | $162 | 50 |
| 7115 Nickaburr Creek Dr | 0.61mi | 3/2.0 (-1) | 1,719 (-6%) | 6mo | $300,000 | $175 | 49 |
| 6626 Grant Dr | 0.66mi | 3/2.0 (-1) | 1,570 (-14%) | 5mo | $255,000 | $162 | 34 |
Match score weights: distance 35% · size 25% · config 20% · recency 20%. Top-matched comps best support the ARV.
Projected returns pro-forma
10.0% appreciation · 0.32% rent growth · sell at horizon
- IRR
- 22.8%
- Equity multiple
- 2.82×
- Total profit
- $135,180
- Equity at exit
- $238,733
- IRR
- 19.8%
- Equity multiple
- 6.25×
- Total profit
- $389,487
- Equity at exit
- $514,837
Cash invested: $74,200 (down + closing). Projections, not guarantees.
Landlord ↔ Tenant lean methodology
- Overall (STATE)
- 87 Strongly Landlord-Friendly
- State Texas
- 87 Strongly Landlord-Friendly · R+5
- County
- — inherits STATE
- City
- — inherits STATE
ZIP-level market 77354
- Home prices YoY
- 2.4%
- Rents YoY
- 0.3%
- Active inventory
- 1604
- Price-to-rent
- 9.4×
Monthly cashflow live
- Estimated rent
- $2,342 high interval (Pro) →
- Mortgage (P&I)
- −$1,390
- Tax from tax record
- −$360 /mo · $4,324/yr
- Insurance
- −$110
- HOA
- −$38
- Vacancy / Maint / Mgmt
- −$492
- Net cashflow
- $-48
Break-even live
UW: 25.0% down · 7.5% · 30yr · 1.5% tax · 5.0% vac · 8.0% maint · 8.0% mgmt
Financing live
Cash to close
- Down payment
- $66,250
- Closing costs
- $7,950
- Reserves months
- —
- Total cash needed
- —
Loan-product check · same deal, 3 products live
Conventional
25% down · 7.5% · 30yr
- Down + closing
- —
- Monthly P&I
- —
- Monthly cashflow
- —
- DSCR
- —
- Eligible?
- —
Personal DTI + credit; lowest rate.
DSCR
20% down · 8.5% · 30yr
- Down + closing
- —
- Monthly P&I
- —
- Monthly cashflow
- —
- DSCR
- —
- Eligible?
- —
No personal income docs; deal must DSCR.
Hard money
10% down · 12.0% · 12mo
- Down + closing
- —
- Monthly P&I
- —
- Monthly cashflow
- —
- DSCR
- —
- Eligible?
- —
Short-term bridge; refi at stabilization.
Rent comps 13 comps
| Address | Beds | Baths | Sqft | Rent | $/sqft | DOM | Units | Dist |
|---|---|---|---|---|---|---|---|---|
| 7210 Alava Dr Magnolia, TX | 4.0 | 3.0 | 2031 | $2,235 | $1.10 | 43d | 1 | 0.14mi |
| 33200 Forest West St Magnolia, TX | 1.0–3.0 | 1.5–2.5 | 1307 | $4,065 | $3.11 | 1d | 22 | 0.19mi |
| 33139 Oak Heights Pl Magnolia, TX | 4.0 | 2.5 | 1896 | $2,270 | $1.20 | 5d | 1 | 1.08mi |
| 33154 Oak Heights Pl Magnolia, TX | 4.0 | 2.5 | 1896 | $2,345 | $1.24 | 22d | 1 | 1.08mi |
| 33154 Oak Heights Pl Magnolia, TX | 4.0 | 2.5 | 1896 | $2,345 | $1.24 | 17d | 1 | 1.08mi |
| 33154 Oak Heights Pl Magnolia, TX | 3.0–4.0 | 2.5 | 1812 | $2,270 | $1.25 | 5d | 7 | 1.08mi |
| 33123 Oak Heights Pl Magnolia, TX | 4.0 | 2.5 | 1896 | $2,270 | $1.20 | 5d | 1 | 1.09mi |
| 33130 Oak Heights Pl Magnolia, TX | 4.0 | 2.5 | 1896 | $2,270 | $1.20 | 5d | 1 | 1.10mi |
| 33150 Willow Heights Ln Magnolia, TX | 4.0 | 2.5 | 1896 | $2,270 | $1.20 | 5d | 1 | 1.11mi |
| 33146 Willow Heights Ln Magnolia, TX | 4.0 | 2.5 | 1896 | $2,270 | $1.20 | 5d | 1 | 1.11mi |
| 10333 Research Forest Dr Unit 3047 Magnolia, TX | 3.0 | 2.0 | 1377 | $2,383 | $1.73 | 11d | 1 | 1.13mi |
| 10333 Research Forest Dr Unit 10366 Magnolia, TX | 3.0 | 2.0 | 1377 | $2,372 | $1.72 | 10d | 1 | 1.18mi |
| 10333 Research Forest Dr Unit 3228 Magnolia, TX | 3.0 | 2.0 | 1377 | $2,340 | $1.70 | 3d | 1 | 1.18mi |
HOA detail
- Monthly dues
- $38 · $456/yr
Listing history 36 events
-
2026-06-18days on market $265,000 Active 127 DOM
-
2026-06-17days on market $265,000 Active 126 DOM
-
2026-06-16days on market $265,000 Active 125 DOM
-
2026-06-16remarks 699-char remark
-
2026-06-15days on market $265,000 Active 124 DOM
-
2026-06-13days on market $265,000 Active 122 DOM
-
2026-06-09days on market $265,000 Active 118 DOM
-
2026-06-08days on market $265,000 Active 117 DOM
-
2026-06-07days on market $265,000 Active 116 DOM
-
2026-06-04days on market $265,000 Active 113 DOM
-
2026-06-03days on market $265,000 Active 112 DOM
-
2026-06-02days on market $265,000 Active 111 DOM
-
2026-06-01days on market $265,000 Active 110 DOM
-
2026-05-31days on market $265,000 Active 109 DOM
-
2026-02-17$2,100
-
2026-02-11$265,000 Active 691-char remark
Show marketing remark (691 chars)
Move in Ready. Welcome to 7218 Cool Springs, a beautiful and immaculate 2-story home located in the desirable Forest Crossing community. Nestled in a quiet cul-de-sac, this home offers both privacy and convenience. With 4 bedrooms and 2 1/2 bathrooms, there is plenty of space for the whole family. The primary bedroom is located downstairs, providing a peaceful retreat. The spacious game room upstairs is perfect for entertaining or relaxation. The lovely laminate floors downstairs add a touch of elegance. This home is also conveniently located just minutes away from great shopping, a variety of restaurants, and a movie theater. Don't miss the opportunity to make this your dream home.
-
2025-03-03historical $2,100
-
2025-02-28historical
-
2025-01-27price $259,000
-
2025-01-24price $265,000
-
2024-11-24price $2,100
-
2024-10-30$2,500
-
2024-08-20status Active
-
2024-08-13status Option Pending
-
2024-08-02status Active
-
2024-08-02$269,000 Active
-
2024-08-02historical
-
2024-08-01historical
-
2024-06-18price $275,000
-
2024-04-11price $285,000
-
2024-01-31$295,000 Active
-
2016-05-10soldstatus
-
2016-05-06soldstatus Sold
-
2016-03-28status Pending
-
2016-03-18status Option Pending
-
2016-03-15$165,000 Active
ⓘ Source: listings_history table (triggers on properties + properties_extension) + one-shot
backfill from property_details.listing_events for pre-trigger history.
Tax reassessment forecast TX · Resets to sale price
- Current annual tax
- $4,324 · $360/mo
- Projected year-2 tax
- $4,850 · $404/mo
- Expected delta
- +$526/yr (+$44/mo · 12.2%)
ⓘ Screening estimate from a state-policy table — verify with the county assessor before closing.
Climate risk First Street
- Flood 1/10 Low FEMA zone X (unshaded) · 0% chance over 30 yrs
- Wildfire 4/10 Moderate
- Heat 9/10 Extreme 7 d/yr ≥111°F today · 24 d/yr by 30 yrs out
- Wind 8/10 Severe 99% chance of damaging wind over 30 yrs
- Air quality 2/10 Low 2 unhealthy d/yr today · 2 by 30 yrs out
Nearby sold comps map
Loading sold comps map…
Walkable amenities ~0.75 mi
Loading nearby amenities…
Taxation est. · year 1
- Rental income
- $28,104
- − Mortgage interest
- −$14,844
- − Property taxes
- −$4,324
- − Insurance
- −$1,325
- − Repairs & maintenance
- −$2,248
- − Management
- −$2,248
- − HOA
- −$456
- − Depreciation
- −$7,709
- Taxable loss
- −$5,051
- Est. tax savings @ 24.0%
- +$1,212
- After-tax cash flow
- $633/yr
For passive investors: Depreciation is non-cash, so a rental often shows a tax loss while cash-flowing — sheltering income. Rental losses are passive: they offset passive income freely, and up to $25,000/yr can offset ordinary (W-2) income if you actively participate and your MAGI is under $100k (phasing out to $0 by $150k); unused losses carry forward. On sale, claimed depreciation is recaptured at up to 25%, and gains may owe capital-gains tax (a 1031 exchange can defer both). Figures are a year-1 estimate at your 24.0% rate — not tax advice; consult a CPA.
Schools (NCES district)
- District
- Magnolia ISD
- NCES district ID
- 4828740
- Math proficiency
- 42% ▼ -7.00%
- Reading proficiency
- 45% ▼ -4.00%
- Median HH income
- $71,692
- Composite
- 39.46/100
- National rank
- #3958
- State rank
- #247 of 826 in TX
Livability — The Woodlands
- Score
- 91/100
- State rank
- #1
- US rank
- #47
Category grades
Schools grade is shown separately in the Schools card above.
Census & demographics
- County
- Montgomery County · 663,713 people
- City population
- 106,505
- Metro
- Houston-The Woodlands-Sugar Land, TX
- Population (ZIP)
- 44,900
- Household income
- $112,504
- Rent vs Own
- Severe rent burden
- 586.0
Population outlook (Montgomery County) Hauer SSP2
- Today (2025)
- 713,896 people
- By 2030
- 805,263 · +12.8%
- By 2040
- 992,708 · +39.1%
- By 2050
- 1,179,590 · +65.2%
- By 2075
- 1,628,084 · +128.1%
- By 2100
- 1,937,880 · +171.5%
Race, ethnicity, and origin ACS 2023
- Neighborhood character
- Predominantly White (66%)
- Race & ethnicity
- White 66% Hispanic / Latino 25% Two or more races 18% Black 3% Asian 1%
- Hispanic origin (detail)
- Mexican 14% Puerto Rican 1%
- Common ancestry
- Lithuanian 4% Slovak 2% Italian 2%
- Foreign-born
- 11% · Canada, Vietnam
- Languages at home
- 83% English-only · Spanish 15% Other Indo-European 1% German/W. Germanic 1%
Political lean MEDSL · Montgomery
- 2024 margin
- Solid R (+45.5) · D 26.8% · R 72.3%
- 2008→2024 swing
- +7.2pp toward D · 2008: -52.7pp · 2024: -45.5pp
- All cycles
- 2024: R+45.5 2020: R+43.8 2016: R+51.4 2012: R+60.7 2008: R+52.7
Not yet ingested
- Civics
- —
Market trends
- HPI YoY
- ▲ 12.09%
- Current HPI
- 512.87
- Rent YoY
- ▲ 0.32%
- Metro
- Houston-The Woodlands-Sugar Land, TX
- State GDP YoY
- ▲ 3.95%
- F500 in state
- 110
Industry mix (Fortune 500 HQ in TX)
| Industry | F500 HQs | Revenue |
|---|---|---|
| Energy | 16 | $1,198B |
|
||
| Technology | 5 | $198B |
|
||
| Engineering / Construction | 4 | $72B |
|
||
| Energy Services | 3 | $60B |
|
||
| Utilities | 3 | $41B |
|
||
| Healthcare | 2 | $330B |
|
||
Price history
-98.7% since first listed22 events — show timeline
- 2026-02-17 Listed for Rent $2,100 HARMLS
- 2026-02-11 Listed $265,000 HARMLS
- 2025-03-03 Rental Removed $2,100 HARMLS
- 2025-02-28 Listing Removed — HARMLS
- 2025-01-27 Price Changed $259,000 HARMLS
- 2025-01-24 Price Changed $265,000 HARMLS
- 2024-11-24 Price Changed $2,100 HARMLS
- 2024-10-30 Listed for Rent $2,500 HARMLS
- 2024-08-20 Relisted — HARMLS
- 2024-08-13 Pending — HARMLS
- 2024-08-02 Relisted — HARMLS
- 2024-08-02 Listing Removed — HARMLS
- 2024-08-02 Listed $269,000 HARMLS
- 2024-08-01 Listing Removed — HARMLS
- 2024-06-18 Price Changed $275,000 HARMLS
- 2024-04-11 Price Changed $285,000 HARMLS
- 2024-01-31 Listed $295,000 HARMLS
- 2016-05-10 Sold (Public Records) — Public Records
- 2016-05-06 Sold (MLS) — HARMLS
- 2016-03-28 Pending — HARMLS
- 2016-03-18 Pending — HARMLS
- 2016-03-15 Listed $165,000 HARMLS
Property tax history
+3.3%/yrLatest (2025): $4,324 · +10.7% YoY. Source: county tax records.
Cash-flow waterfall
monthlySold comps — $/sqft
last 12 mo · ≤1 miLoading sold comps…