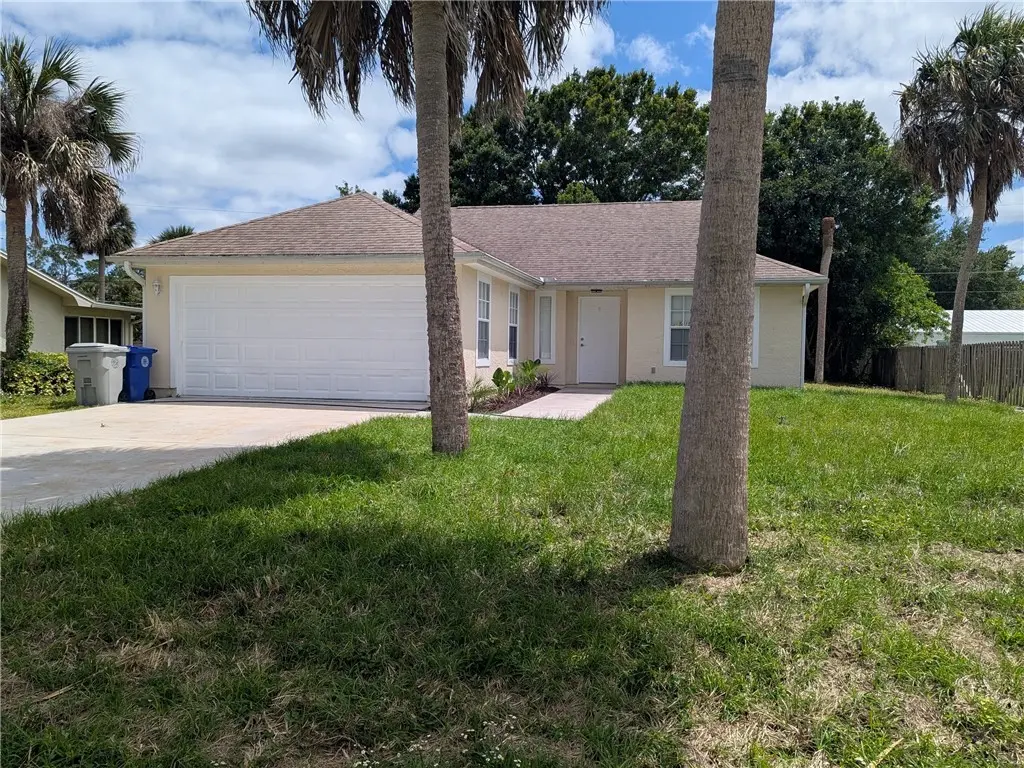
2515 1st Pl · Vero Beach South, FL
Flood risk 1/10 · Minimal
- FEMA flood zone
- X (unshaded)
- Chance of flooding over 30 yrs
- 0.0%
- Est. flood insurance / yr
- $507 – $1,088
Fire risk 1/10 · Minimal
- Est. fire insurance / yr
- $947 – $1,759
Heat risk 10/10 · Severe
- Hot days now (above 106°F)
- 7 days/yr
- Hot days in 30 yrs
- 24 days/yr
Wind risk 10/10 · Severe
- Chance of severe wind over 30 yrs
- 99.0%
Air-quality risk 1/10 · Minimal
- Unhealthy air days now
- 0 days/yr
- Unhealthy air days in 30 yrs
- 0 days/yr
Risk factors via First Street. Map © Google.
Why this score? — see what drove the F grade
The composite is a weighted blend of 9 inputs, each scored 0–100. Each bar is that input's sub-score; the figure is the points it added to the 100-point composite (weight × sub-score).
- Cash flow +13.0/30.0
- Schools +4.2/10.0
- DSCR +3.9/10.0
- Livability +3.9/5.0
- Rent growth +3.5/5.0
- 1% rule +3.3/10.0
- Condition / age +2.5/5.0
- ARV discount +0.0/15.0
- Appreciation +0.0/10.0
$300,000
🖨 Deal sheet (PDF) 📄 Offer letter ✓ Due diligence
Listing remarks
Rarely available area! Nice three bedroom, two bath, two car garage home. Roof redone in 2020. New drain field in 2026. Newer AC compressor. Fully tiled throughout, breakfast bar, fresh paint and established trees in the backyard make this property ready to go!
Key facts
- New drain field
- Newer ac compressor
- Fully tiled
Tags
Property features AI
Finance
- Financial info: Pets allowed
- HOA & community: No HOA (N/A); Community gutters
Exterior
- Parking: Garage; 2-car garage
- Security: Smoke detector(s)
- Utilities: Public water; Septic tank
- Home design: Single-story home
- Construction: Frame and stucco construction; Shingle roof
- Exterior features: Patio; Rain gutters; Has view; Property faces North; Less than quarter acre lot
Interior
- Kitchen: Dishwasher; Microwave; Range; Refrigerator; Electric water heater
- Bedrooms: Bedroom — 11 x 10; Bedroom — 11 x 10; Bedroom — 11 x 14; Primary bedroom located on the main level
- Flooring: Tile flooring
- Bathrooms: 2 full bathrooms
- Heating & cooling: Central heating; Central air conditioning
- Interior features: High ceilings; Vaulted ceiling(s); Split bedrooms; Walk-in closet(s); Unfurnished; Single-hung and sliding windows
- Laundry & utility: Washer hookup; Dryer hookup; Laundry closet; In-unit laundry
Neighborhood map
What this means for you Summary
Snapshot
- This is a 3-bed/2.0-bath single-family listed at $300k.
Deal economics
- At list price, monthly cash flow is $-16 ($-192/yr) — negative.
- To cash-flow at today's rent, offer at most $297k (0.9% below list).
- To meet the 1% rule (rent ≥ 1% of price), the offer needs to be $248k (17.3% below list).
- Recommended offer: $248k (17.3% below list) — sets the bar for 1% rule.
- Cap rate 6.2% vs local median 4.3% in Vero Beach South — top-decile yield for the area; either an underpriced asset or a hidden risk that comps aren't pricing in. Stress-test before assuming the spread holds.
Location & tenants
- Location reads 78/100 on livability (#163 in FL, #2,445 nationally) — a middle-class / working-renter tenant base. Strengths: commute A+, housing A+, health & safety A; Watch: amenities F.
- Indian River (other): math 48% / reading 52% proficiency, ranked #35 of 73 in FL (top 48%) — acceptable for families but not a draw, mixed tenant base, ~2y average lease.
- Zoned schools: Citrus Elementary School (math 52% / reading 52%, grade C-, #990 of 2,144 statewide, top 48%, 666 students, 78% FRL); Oslo Middle School (math 39% / reading 45%, grade D-, #340 of 571 statewide, top 61%, 864 students, 72% FRL); Vero Beach High School (math 28% / reading 43%, grade F, #367 of 667 statewide, top 57%, 2,847 students, 50% FRL).
- Market conditions: Rents rising fast (+4.2%/yr); 351 active listings in the ZIP; 14 comparable units currently listed for rent nearby; rentals at typical pace (median 23d on market — plan ~3-4 weeks tenant-placement turnaround); 564 units permitted in Indian River County in 2024 (281 in 5+ unit buildings).
- This rent runs 45% of the median local income ($67k/yr) — at the standard rent-burdened threshold; future hikes will face affordability resistance.
Forward outlook
- Local home prices are declining (-3.0%/yr); year-one equity from $2k of loan paydown is wiped out by about $9k of value loss. Plan a longer hold.
- Indian River County population projected at +18% by 2050 — long-run rental-demand tailwind backs the buy-and-hold thesis.
Negotiation context
- Only 12 days on market — expect competitive offers; lowballing is unlikely to land.
- Current owner paid $103k; list at $300k implies a 192% gain — meaningful room to come down on a strong offer.
Risks & watch-outs
- Climate carrying-cost: severe wind risk, 99% chance of damaging wind over 30y; extreme-heat days projected 7→24/yr by 2055 (HVAC capex compounding) — expect insurance premiums to compound above CPI over the hold.
Questions for the listing agent
- What do current leases actually rent for vs. the listed asking? Can we see a recent rent roll and the last 12 months of T-12 income?
- Is there a deadline driving the sale (1031 exchange, divorce, estate, relocation)? That informs how much negotiation room exists.
- The area grade is low — what's the realistic commute time and amenity access for the typical tenant pool here? Any planned neighborhood developments (good or bad) we should know about?
- What's the average days-on-market for RENTAL listings here right now (not sales)? A rising rental-DOM trend means longer vacancies and softer asking-rent achievability than the comps imply.
- What's the recent tenant-quality profile in this submarket — average credit score on applications, eviction rate, late-payment / NSF rate, and stable-employment percentage? A property-management company in the area should have these aggregated.
- How much new for-sale + rental construction is in the pipeline within 1–3 miles? Heavy new supply typically softens prices + rents 12–24 months out; constrained supply supports both.
Investment metrics
- 1% rule
- 0.83% ✗
- Cap rate
- 6.23%
- Cash-on-cash
- -0.23%
- DSCR
- 0.99
- GRM
- 10.1
CMA / ARV
- ARV (on-the-fly)
- $253,572
- Comps found
- 12
Show comp detail 12 sales within ~0.75 mi
| Address | Dist | Beds/Ba | Sqft | Sold | Price | $/sf | Match |
|---|---|---|---|---|---|---|---|
| 2545 1st Pl N | 0.04mi | 3/2.0 | 1,232 (+10%) | 4mo | $305,500 | $248 | 78 |
| 3246 1st St | 0.47mi | 2/2.0 (-1) | 1,117 (-0%) | 6mo | $225,900 | $202 | 67 |
| 525 22nd Ave | 0.58mi | 3/2.0 | 1,150 (+2%) | 2mo | $260,000 | $226 | 67 |
| 2431 4th Pl | 0.39mi | 2/2.0 (-1) | 1,041 (-7%) | 3mo | $287,000 | $276 | 62 |
| 3236 1st Rd | 0.47mi | 3/2.0 | 1,200 (+7%) | 6mo | $265,000 | $221 | 61 |
| 306 35th Ave | 0.63mi | 3/2.0 | 1,186 (+6%) | 3mo | $240,000 | $202 | 59 |
| 3196 1st Ln | 0.40mi | 3/2.0 | 1,274 (+14%) | 2mo | $232,000 | $182 | 57 |
| 355 20th Ave | 0.48mi | 2/2.0 (-1) | 1,224 (+9%) | 4mo | $235,000 | $192 | 54 |
| 3496 1st St SW | 0.60mi | 2/2.0 (-1) | 1,023 (-9%) | 1mo | $270,000 | $264 | 52 |
| 356 18th Ave | 0.62mi | 3/2.0 | 1,254 (+12%) | 6mo | $285,000 | $227 | 47 |
| 506 20th Ct | 0.63mi | 2/1.5 (-1) | 1,009 (-10%) | 1mo | $265,000 | $263 | 46 |
| 1826 4th Pl | 0.62mi | 2/2.0 (-1) | 1,288 (+15%) | 6mo | $218,000 | $169 | 37 |
Match score weights: distance 35% · size 25% · config 20% · recency 20%. Top-matched comps best support the ARV.
Projected returns pro-forma
-3.0% appreciation · 4.18% rent growth · sell at horizon
- IRR
- -15.4%
- Equity multiple
- 0.44×
- Total profit
- $-46,671
- Equity at exit
- $44,731
- IRR
- -5.1%
- Equity multiple
- 0.65×
- Total profit
- $-29,508
- Equity at exit
- $25,939
Cash invested: $84,000 (down + closing). Projections, not guarantees.
Landlord ↔ Tenant lean methodology
- Overall (STATE)
- 87 Strongly Landlord-Friendly
- State Florida
- 87 Strongly Landlord-Friendly · R+3
- County
- — inherits STATE
- City
- — inherits STATE
ZIP-level market 32962
- Rents YoY
- 4.2%
- Active inventory
- 351
- Price-to-rent
- 10.1×
Monthly cashflow live
- Estimated rent
- $2,482 high interval (Pro) →
- Mortgage (P&I)
- −$1,573
- Tax from tax record
- −$278 /mo · $3,341/yr
- Insurance
- −$125
- HOA
- −$0
- Vacancy / Maint / Mgmt
- −$521
- Net cashflow
- $-16
Break-even live
Sensitivity live
| Price | -10% $154 | -5% $69 | +0% $-16 | +5% $-101 | +10% $-186 |
|---|---|---|---|---|---|
| Rent | -10% $-212 | -5% $-114 | +0% $-16 | +5% $82 | +10% $180 |
| Rate | -1.0pp $135 | -0.5pp $60 | base $-16 | +0.5pp $-94 | +1.0pp $-173 |
UW: 25.0% down · 7.5% · 30yr · 1.5% tax · 5.0% vac · 8.0% maint · 8.0% mgmt
Financing live
Cash to close
- Down payment
- $75,000
- Closing costs
- $9,000
- Reserves months
- —
- Total cash needed
- —
Loan-product check · same deal, 3 products live
Conventional
25% down · 7.5% · 30yr
- Down + closing
- —
- Monthly P&I
- —
- Monthly cashflow
- —
- DSCR
- —
- Eligible?
- —
Personal DTI + credit; lowest rate.
DSCR
20% down · 8.5% · 30yr
- Down + closing
- —
- Monthly P&I
- —
- Monthly cashflow
- —
- DSCR
- —
- Eligible?
- —
No personal income docs; deal must DSCR.
Hard money
10% down · 12.0% · 12mo
- Down + closing
- —
- Monthly P&I
- —
- Monthly cashflow
- —
- DSCR
- —
- Eligible?
- —
Short-term bridge; refi at stabilization.
Rent comps 14 comps
| Address | Beds | Baths | Sqft | Rent | $/sqft | DOM | Units | Dist |
|---|---|---|---|---|---|---|---|---|
| 2624 2nd St SW Vero Beach, FL | 2.0 | 1.0 | 748 | $1,750 | $2.34 | 15d | 1 | 0.26mi |
| 248 27th Ave SW Vero Beach, FL | 3.0 | 2.0 | 836 | $1,700 | $2.03 | 23d | 1 | 0.34mi |
| 405 27th Ct Vero Beach, FL | 3.0 | 2.0 | 1100 | $1,850 | $1.68 | 15d | 1 | 0.40mi |
| 3285 3rd Pl Unit 1018166P Vero Beach, FL | 3.0 | 2.0 | 1420 | $3,708 | $2.61 | 15d | 1 | 0.57mi |
| 275 16th Ave Vero Beach, FL | 2.0 | 2.0 | 1144 | $1,600 | $1.40 | 15d | 1 | 0.64mi |
| 1816 5th Pl Unit 1018162P Vero Beach, FL | 2.0 | 2.0 | 1323 | $3,841 | $2.90 | 23d | 1 | 0.72mi |
| 3673 2nd Pl SW Vero Beach, FL | 3.0 | 2.0 | 1410 | $4,800 | $3.40 | 15d | 1 | 0.91mi |
| 3673 2nd Pl SW Vero Beach, FL | 3.0 | 2.0 | 1410 | $4,800 | $3.40 | 23d | 1 | 0.91mi |
| 1702 7th St Vero Beach, FL | 3.0 | 2.0 | 1230 | $2,100 | $1.71 | 15d | 1 | 0.92mi |
| 2543 Stockbridge Sq SW Vero Beach, FL | 3.0 | 2.0 | 1464 | $2,200 | $1.50 | 15d | 1 | 0.99mi |
| 826 Middleton Dr SW Vero Beach, FL | 3.0 | 2.0 | 1464 | $2,150 | $1.47 | 23d | 1 | 1.10mi |
| 2619 Langrove Ln SW Unit 2619 Vero Beach, FL | 3.0 | 2.0 | 1464 | $2,450 | $1.67 | 23d | 1 | 1.10mi |
| 2565 Langrove Ln SW Vero Beach, FL | 3.0 | 2.0 | 1464 | $2,000 | $1.37 | 23d | 1 | 1.13mi |
| 1136 9th Sq Unit 1467671P Vero Beach, FL | 3.0 | 2.0 | 1399 | $4,165 | $2.98 | 23d | 1 | 1.47mi |
Listing history 4 events
-
2026-04-28status Pending
-
2026-04-16$300,000 Active
-
2002-07-02soldstatus $102,800
-
2000-09-06soldstatus $12,500
ⓘ Source: listings_history table (triggers on properties + properties_extension) + one-shot
backfill from property_details.listing_events for pre-trigger history.
Tax reassessment forecast FL · Resets to sale price
- Current annual tax
- $3,341 · $278/mo
- Projected year-2 tax
- $3,341 · $278/mo
- Expected delta
- $0/yr ($0/mo · 0.0%)
ⓘ Screening estimate from a state-policy table — verify with the county assessor before closing.
Climate risk First Street
- Flood 1/10 Low FEMA zone X (unshaded) · 0% chance over 30 yrs
- Wildfire 1/10 Low
- Heat 10/10 Extreme 7 d/yr ≥106°F today · 24 d/yr by 30 yrs out
- Wind 10/10 Extreme 99% chance of damaging wind over 30 yrs
- Air quality 1/10 Low 0 unhealthy d/yr today · 0 by 30 yrs out
Nearby sold comps map
Loading sold comps map…
Walkable amenities ~0.75 mi
Loading nearby amenities…
Taxation est. · year 1
- Rental income
- $29,782
- − Mortgage interest
- −$16,805
- − Property taxes
- −$3,341
- − Insurance
- −$1,500
- − Repairs & maintenance
- −$2,383
- − Management
- −$2,383
- − Depreciation
- −$8,727
- Taxable loss
- −$5,356
- Est. tax savings @ 24.0%
- +$1,285
- After-tax cash flow
- $1,094/yr
For passive investors: Depreciation is non-cash, so a rental often shows a tax loss while cash-flowing — sheltering income. Rental losses are passive: they offset passive income freely, and up to $25,000/yr can offset ordinary (W-2) income if you actively participate and your MAGI is under $100k (phasing out to $0 by $150k); unused losses carry forward. On sale, claimed depreciation is recaptured at up to 25%, and gains may owe capital-gains tax (a 1031 exchange can defer both). Figures are a year-1 estimate at your 24.0% rate — not tax advice; consult a CPA.
Schools (NCES district)
- District
- Indian River
- NCES district ID
- 1200930
- Math proficiency
- 48% ▼ -9.00%
- Reading proficiency
- 52% ▼ -3.00%
- Median HH income
- $46,597
- Composite
- 42.45/100
- National rank
- #3218
- State rank
- #35 of 73 in FL
Livability — Vero Beach South
- Score
- 78/100
- State rank
- #163
- US rank
- #2445
Category grades
Schools grade is shown separately in the Schools card above.
Census & demographics
- Census place
- Vero Beach South, FL
- County
- Indian River County · 143,738 people
- Metro
- Sebastian-Vero Beach, FL
- Population (ZIP)
- 25,522
- Household income
- $66,664
- Rent vs Own
- Severe rent burden
- 425.0
Population outlook (Indian River County) Hauer SSP2
- Today (2025)
- 165,104 people
- By 2030
- 172,869 · +4.7%
- By 2040
- 185,640 · +12.4%
- By 2050
- 194,465 · +17.8%
- By 2075
- 211,115 · +27.9%
- By 2100
- 211,781 · +28.3%
Race, ethnicity, and origin ACS 2023
- Neighborhood character
- Predominantly White (70%)
- Race & ethnicity
- White 70% Black 13% Hispanic / Latino 12% Two or more races 5% Native American 1%
- Hispanic origin (detail)
- Mexican 1% Puerto Rican 2% Cuban 1%
- Common ancestry
- Romanian 4% Lithuanian 4% Italian 3%
- Foreign-born
- 12% · Canada, Jamaica, Dominican Republic
- Languages at home
- 85% English-only · Spanish 9% Other Indo-European 2% French/Haitian/Cajun 1%
Political lean MEDSL · Indian River
- 2024 margin
- Strong R (+27.4) · D 36.0% · R 63.4%
- 2008→2024 swing
- -12.5pp toward R · 2008: -14.8pp · 2024: -27.4pp
- All cycles
- 2024: R+27.4 2020: R+21.6 2016: R+24.5 2012: R+22.3 2008: R+14.8
Not yet ingested
- Civics
- —
Market trends
- HPI YoY
- ▼ -182.13%
- Current HPI
- 333.3274
- Rent YoY
- ▲ 4.18%
- Metro
- Sebastian-Vero Beach, FL
- State GDP YoY
- ▲ 3.28%
- F500 in state
- 36
Industry mix (Fortune 500 HQ in FL)
| Industry | F500 HQs | Revenue |
|---|---|---|
| Industrial Technology | 2 | $29B |
|
||
| Insurance | 2 | $17B |
|
||
| Retail | 1 | $60B |
|
||
| Technology Distribution | 1 | $58B |
|
||
| Homebuilding | 1 | $35B |
|
||
| Technology Manufacturing | 1 | $35B |
|
||
Price history
+2300.0% since first listed4 events — show timeline
- 2026-04-28 Pending — RAIRCMLS
- 2026-04-16 Listed $300,000 RAIRCMLS
- 2002-07-02 Sold (Public Records) $102,800 Public Records
- 2000-09-06 Sold (Public Records) $12,500 Public Records
Property tax history
+8.8%/yrLatest (2025): $3,341 · +12.5% YoY. Source: county tax records.
Cash-flow waterfall
monthlySold comps — $/sqft
last 12 mo · ≤1 miLoading sold comps…