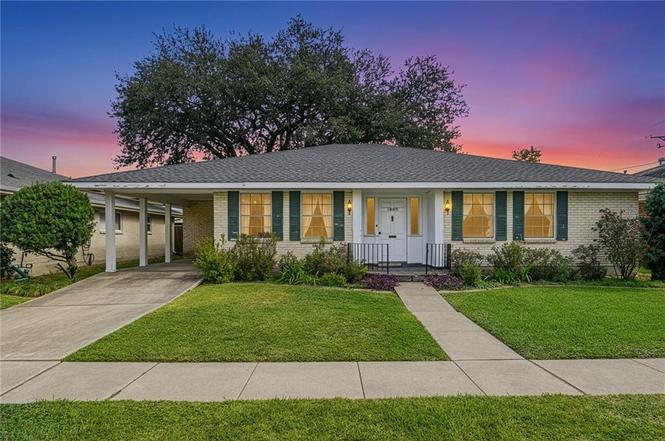
1805 Francis Ave · Metairie, LA
Flood risk No data
- FEMA flood zone
- —
- Chance of flooding over 30 yrs
- %
- Est. flood insurance / yr
- —
Fire risk No data
- Est. fire insurance / yr
- —
Heat risk No data
- Hot days now (above °F)
- days/yr
- Hot days in 30 yrs
- days/yr
Wind risk No data
- Chance of severe wind over 30 yrs
- %
Air-quality risk No data
- Unhealthy air days now
- days/yr
- Unhealthy air days in 30 yrs
- days/yr
Risk factors via First Street. Map © Google.
Why this score? — see what drove the B- grade
The composite is a weighted blend of 9 inputs, each scored 0–100. Each bar is that input's sub-score; the figure is the points it added to the 100-point composite (weight × sub-score).
- Cash flow +26.1/30.0
- ARV discount +15.0/15.0
- DSCR +8.8/10.0
- 1% rule +6.9/10.0
- Livability +4.4/5.0
- Rent growth +3.0/5.0
- Schools +2.5/10.0
- Condition / age +2.5/5.0
- Appreciation +0.0/10.0
$199,000
🖨 Deal sheet (PDF) 📄 Offer letter ✓ Due diligence
Key facts
- 8,400 sq ft lot
- Built 1961
- Listed 2 days
Neighborhood map
What this means for you Summary
Snapshot
- This is a 4-bed/2.0-bath single-family listed at $199k.
Deal economics
- At list price, monthly cash flow is $499 ($6k/yr) — positive.
- The deal already cash-flows at list — no discount required.
- Meets the 1% rule at list price ($2k rent vs $199k).
- Cap rate 9.3% vs local median 3.6% in Metairie — top-decile yield for the area; either an underpriced asset or a hidden risk that comps aren't pricing in. Stress-test before assuming the spread holds.
Location & tenants
- Location reads 87/100 on livability (#1 in LA, #261 nationally) — a professional / high-income tenant draw. Strengths: commute A+, housing A+, health & safety A+.
- Jefferson Parish (suburban): math 24% / reading 34% proficiency, ranked #44 of 98 in LA (top 45%) — low school quality limits family demand, transient renter base, plan for 1-2y turnover; 70% free/reduced lunch — lower-income household profile, screen leases tightly.
- Market conditions: Rents rising (+2.1%/yr); 227 active listings in the ZIP; 26 comparable units currently listed for rent nearby; rentals at typical pace (median 22d on market — plan ~3-4 weeks tenant-placement turnaround); solid renter incomes; 518 units permitted in Jefferson Parish in 2024 (43 in 5+ unit buildings).
- This rent runs 37% of the median local income ($76k/yr) — at the standard rent-burdened threshold; future hikes will face affordability resistance.
Forward outlook
- Local home prices are declining (-3.0%/yr); year-one equity from $1k of loan paydown is wiped out by about $6k of value loss. Plan a longer hold.
Negotiation context
- Only 2 days on market — expect competitive offers; lowballing is unlikely to land.
Questions for the listing agent
- Built in 1961 — when were the roof, HVAC, electrical panel, plumbing, and water heater last replaced?
- Is there a deadline driving the sale (1031 exchange, divorce, estate, relocation)? That informs how much negotiation room exists.
- Schools are B-rated — typically a magnet for longer-tenancy family renters. What's the average tenant stay here, and is there a school-zone premium baked into asking?
- What's the average days-on-market for RENTAL listings here right now (not sales)? A rising rental-DOM trend means longer vacancies and softer asking-rent achievability than the comps imply.
- What's the recent tenant-quality profile in this submarket — average credit score on applications, eviction rate, late-payment / NSF rate, and stable-employment percentage? A property-management company in the area should have these aggregated.
- How much new for-sale + rental construction is in the pipeline within 1–3 miles? Heavy new supply typically softens prices + rents 12–24 months out; constrained supply supports both.
Investment metrics
- 1% rule
- 1.19% ✓
- Cap rate
- 9.30%
- Cash-on-cash
- 10.75%
- DSCR
- 1.48
- GRM
- 7.0
CMA / ARV
- ARV (on-the-fly)
- $332,406
- Comps found
- 12
Show comp detail 12 sales within ~0.75 mi
| Address | Dist | Beds/Ba | Sqft | Sold | Price | $/sf | Match |
|---|---|---|---|---|---|---|---|
| 2101 Riviere Ave | 0.15mi | 4/2.5 | 2,000 (+6%) | 1mo | $365,500 | $183 | 79 |
| 1904 Hall Ave | 0.13mi | 3/2.0 (-1) | 1,770 (-6%) | 4mo | $270,000 | $153 | 76 |
| 1613 Riviere Ave | 0.24mi | 3/2.0 (-1) | 1,683 (-10%) | 2mo | $141,900 | $84 | 65 |
| 1725 Vegas Dr | 0.58mi | 3/2.0 (-1) | 1,888 (+0%) | 2mo | $499,000 | $264 | 65 |
| 1721 Vegas Dr | 0.58mi | 3/2.0 (-1) | 1,863 (-1%) | 2mo | $499,000 | $268 | 65 |
| 1901 Eisenhower Ave | 0.13mi | 3/2.0 (-1) | 1,603 (-15%) | 2mo | $265,000 | $165 | 63 |
| 1109 David Dr | 0.44mi | 3/2.5 (-1) | 1,994 (+6%) | 0mo | $385,000 | $193 | 62 |
| 1317 Frankel Ave | 0.31mi | 3/2.0 (-1) | 1,635 (-13%) | 2mo | $290,000 | $177 | 57 |
| 1120 Trudeau Dr | 0.55mi | 3/2.0 (-1) | 1,673 (-11%) | 1mo | $289,000 | $173 | 51 |
| 1608 Princeton St | 0.68mi | 4/2.5 | 2,063 (+10%) | 1mo | $245,000 | $119 | 49 |
| 6104 Camphor St | 0.50mi | 3/2.0 (-1) | 1,600 (-15%) | 0mo | $320,000 | $200 | 47 |
| 2201 Elise Ave | 0.63mi | 3/2.0 (-1) | 1,607 (-14%) | 1mo | $237,000 | $147 | 41 |
Match score weights: distance 35% · size 25% · config 20% · recency 20%. Top-matched comps best support the ARV.
Projected returns pro-forma
-3.0% appreciation · 2.15% rent growth · sell at horizon
- IRR
- -1.2%
- Equity multiple
- 0.96×
- Total profit
- $-2,423
- Equity at exit
- $29,672
- IRR
- 7.6%
- Equity multiple
- 1.55×
- Total profit
- $30,867
- Equity at exit
- $17,206
Cash invested: $55,720 (down + closing). Projections, not guarantees.
Landlord ↔ Tenant lean methodology
- Overall (STATE)
- 90 Strongly Landlord-Friendly
- State Louisiana
- 90 Strongly Landlord-Friendly · R+12
- County
- — inherits STATE
- City
- — inherits STATE
ZIP-level market 70003
- Rents YoY
- 2.1%
- Active inventory
- 227
- Price-to-rent
- 7.0×
Monthly cashflow live
- Estimated rent
- $2,373 high interval (Pro) →
- Mortgage (P&I)
- −$1,044
- Tax est. 1.5%
- −$249 /mo · $2,985/yr
- Insurance
- −$83
- HOA
- −$0
- Vacancy / Maint / Mgmt
- −$498
- Net cashflow
- $499
Break-even live
Sensitivity live
| Price | -10% $637 | -5% $568 | +0% $499 | +5% $431 | +10% $362 |
|---|---|---|---|---|---|
| Rent | -10% $312 | -5% $406 | +0% $499 | +5% $593 | +10% $687 |
| Rate | -1.0pp $600 | -0.5pp $550 | base $499 | +0.5pp $448 | +1.0pp $395 |
UW: 25.0% down · 7.5% · 30yr · 1.5% tax · 5.0% vac · 8.0% maint · 8.0% mgmt
Financing live
Cash to close
- Down payment
- $49,750
- Closing costs
- $5,970
- Reserves months
- —
- Total cash needed
- —
Loan-product check · same deal, 3 products live
Conventional
25% down · 7.5% · 30yr
- Down + closing
- —
- Monthly P&I
- —
- Monthly cashflow
- —
- DSCR
- —
- Eligible?
- —
Personal DTI + credit; lowest rate.
DSCR
20% down · 8.5% · 30yr
- Down + closing
- —
- Monthly P&I
- —
- Monthly cashflow
- —
- DSCR
- —
- Eligible?
- —
No personal income docs; deal must DSCR.
Hard money
10% down · 12.0% · 12mo
- Down + closing
- —
- Monthly P&I
- —
- Monthly cashflow
- —
- DSCR
- —
- Eligible?
- —
Short-term bridge; refi at stabilization.
Rent comps 26 comps
| Address | Beds | Baths | Sqft | Rent | $/sqft | DOM | Units | Dist |
|---|---|---|---|---|---|---|---|---|
| 2012 Airline Park Blvd Metairie, LA | 3.0 | 2.0 | 1583 | $2,100 | $1.33 | 25d | 1 | 0.10mi |
| 1712 Abadie Ave Metairie, LA | 4.0 | 2.0 | 1900 | $2,750 | $1.45 | 25d | 1 | 0.20mi |
| 1820 Fairfax Ave Metairie, LA | 3.0 | 2.0 | 1838 | $2,400 | $1.31 | 0d | 1 | 0.26mi |
| 6908 Christine St Metairie, LA | 3.0 | 2.0 | 1550 | $2,000 | $1.29 | 16d | 1 | 0.26mi |
| 6908 Christine St Metairie, LA | 3.0 | 2.0 | 1550 | $2,100 | $1.35 | 25d | 1 | 0.26mi |
| 1108 Cardinal Ave Metairie, LA | 4.0 | 2.0 | 1903 | $2,650 | $1.39 | 45d | 1 | 0.52mi |
| 1808 Elise Ave Metairie, LA | 3.0 | 2.0 | 1508 | $2,100 | $1.39 | 25d | 1 | 0.58mi |
| 1216 Hymelia Ave Metairie, LA | 4.0 | 2.0 | 1400 | $3,500 | $2.50 | 6d | 1 | 0.65mi |
| 705 N Lester Ave Metairie, LA | 3.0 | 2.0 | 1334 | $2,100 | $1.57 | 45d | 1 | 0.70mi |
| 6016 Loraine St Metairie, LA | 3.0 | 1.0 | 1600 | $1,950 | $1.22 | 0d | 1 | 0.72mi |
| 6016 Loraine St Metairie, LA | 3.0 | 1.0 | 1600 | $1,950 | $1.22 | 4d | 1 | 0.72mi |
| 808 Cynthia Ave Metairie, LA | 3.0 | 2.0 | 1500 | $2,100 | $1.40 | 16d | 1 | 0.81mi |
| 703 Linden St Metairie, LA | 3.0 | 2.0 | 1650 | $2,500 | $1.52 | 22d | 1 | 0.82mi |
| 6801 Veterans Blvd Metairie, LA | 1.0–3.0 | 1.0–2.0 | 985 | $1,701 | $1.73 | 0d | 27 | 0.92mi |
| 2013 Minnesota Ave Kenner, LA | 4.0 | 2.0 | 1300 | $2,000 | $1.54 | 23d | 1 | 1.08mi |
| 1001 Minnesota Ave Kenner, LA | 3.0 | 2.0 | 1800 | $2,100 | $1.17 | 45d | 1 | 1.10mi |
| 8817 25th St Metairie, LA | 3.0 | 1.0 | 1390 | $2,100 | $1.51 | 6d | 1 | 1.11mi |
| 3 Donald Ct Metairie, LA | 3.0 | 2.0 | 1633 | $2,000 | $1.22 | 25d | 1 | 1.13mi |
| 216 Trudeau Dr Metairie, LA | 4.0 | 3.0 | 1825 | $2,800 | $1.53 | 6d | 1 | 1.14mi |
| 4960 York St Unit 4954 Metairie, LA | 3.0 | 2.5 | 1597 | $1,995 | $1.25 | 0d | 1 | 1.17mi |
| 4960 York St Unit 4922 Metairie, LA | 3.0 | 2.5 | 1846 | $1,975 | $1.07 | 0d | 1 | 1.17mi |
| 6217 Leslie St Metairie, LA | 3.0 | 1.0 | 1300 | $1,800 | $1.38 | 46d | 1 | 1.29mi |
| 1201 High Ave Metairie, LA | 3.0 | 2.0 | 1600 | $2,200 | $1.38 | 0d | 1 | 1.44mi |
| 3908 Page Dr Metairie, LA | 3.0 | 1.5 | 1470 | $1,850 | $1.26 | 46d | 1 | 1.48mi |
| 5029 Loveland St Metairie, LA | 3.0 | 2.0 | 2100 | $2,500 | $1.19 | 6d | 1 | 1.48mi |
| 527 Little Farms Ave New Orleans, LA | 3.0 | 2.0 | 1855 | $2,800 | $1.51 | 25d | 1 | 1.50mi |
Listing history 1 events
-
2026-06-17$199,000 Pending 2 DOM
ⓘ Source: listings_history table (triggers on properties + properties_extension) + one-shot
backfill from property_details.listing_events for pre-trigger history.
Nearby sold comps map
Loading sold comps map…
Walkable amenities ~0.75 mi
Loading nearby amenities…
Taxation est. · year 1
- Rental income
- $28,474
- − Mortgage interest
- −$11,147
- − Property taxes
- −$2,985
- − Insurance
- −$995
- − Repairs & maintenance
- −$2,278
- − Management
- −$2,278
- − Depreciation
- −$5,789
- Taxable income
- $3,002
- Est. tax owed @ 24.0%
- −$720
- After-tax cash flow
- $5,271/yr
For passive investors: Depreciation is non-cash, so a rental often shows a tax loss while cash-flowing — sheltering income. Rental losses are passive: they offset passive income freely, and up to $25,000/yr can offset ordinary (W-2) income if you actively participate and your MAGI is under $100k (phasing out to $0 by $150k); unused losses carry forward. On sale, claimed depreciation is recaptured at up to 25%, and gains may owe capital-gains tax (a 1031 exchange can defer both). Figures are a year-1 estimate at your 24.0% rate — not tax advice; consult a CPA.
Schools (NCES district)
- District
- Jefferson Parish
- NCES district ID
- 2200840
- Math proficiency
- 24% ▼ -36.00%
- Reading proficiency
- 34% ▼ -30.00%
- Median HH income
- $48,421
- Composite
- 25.19/100
- National rank
- #7511
- State rank
- #44 of 98 in LA
Livability — Metairie
- Score
- 87/100
- State rank
- #1
- US rank
- #261
Category grades
Schools grade is shown separately in the Schools card above.
Census & demographics
- Census place
- Metairie, LA
- County
- Jefferson Parish · 426,999 people
- City population
- 137,978
- Metro
- New Orleans-Metairie, LA
- Population (ZIP)
- 39,344
- Household income
- $76,261
- Rent vs Own
- Severe rent burden
- 710.0
Population outlook (Jefferson County) Hauer SSP2
- Today (2025)
- 451,696 people
- By 2030
- 455,451 · +0.8%
- By 2040
- 458,308 · +1.5%
- By 2050
- 461,031 · +2.1%
- By 2075
- 476,351 · +5.5%
- By 2100
- 499,377 · +10.6%
Race, ethnicity, and origin ACS 2023
- Neighborhood character
- Predominantly White (65%)
- Race & ethnicity
- White 65% Hispanic / Latino 19% Two or more races 12% Black 8% Asian 5%
- Hispanic origin (detail)
- Mexican 3% Cuban 1%
- Common ancestry
- Lithuanian 12% Scotch-Irish 1% Slovak 1%
- Foreign-born
- 14% · Canada, Vietnam, China
- Languages at home
- 81% English-only · Spanish 12% Other Indo-European 3% Arabic 1%
Political lean MEDSL · Jefferson
- 2024 margin
- R (+12.9) · D 42.5% · R 55.5% · Other 2.1%
- 2008→2024 swing
- +13.6pp toward D · 2008: -26.6pp · 2024: -12.9pp
- All cycles
- 2024: R+12.9 2020: R+11.1 2016: R+14.8 2012: R+18.4 2008: R+26.6
Not yet ingested
- Civics
- —
Market trends
- HPI YoY
- ▼ -252.03%
- Current HPI
- 138.5632
- Rent YoY
- ▲ 2.15%
- Metro
- New Orleans-Metairie, LA
- State GDP YoY
- ▲ 3.29%
- F500 in state
- 10
Industry mix (Fortune 500 HQ in LA)
| Industry | F500 HQs | Revenue |
|---|---|---|
| Telecommunications | 2 | $23B |
|
||
| Utilities | 1 | $12B |
|
||
| Wholesale / Distribution | 1 | $5B |
|
||
| Advertising | 1 | $2B |
|
||
Cash-flow waterfall
monthlySold comps — $/sqft
last 12 mo · ≤1 miLoading sold comps…